*e-mail: [email protected]
1. Introduction
Cavitation erosion of metals is characterized by local impacts of luid against the metallic surface due to collapse of bubbles, resulting in progressive loss of original material from the solid surface, in the vicinity of the active cloud within a liquid. Some problems related to cavitation are vibration in hydraulic machines, increase in hydrodynamic drag and change in hydrodynamic low, noise, thermal and light effects like luminescence, besides erosion wear1. Erosion wear due
to cavitation phenomenon has demanded special attention of researchers and engineers mainly in power generation plants. This is due to the high costs associated to preventive and corrective maintenance of hydraulic machine components, which are continually exposed to cavitation. The relative resistance of materials to cavitation erosion is commonly determined by mass loss measurement in laboratory, and it has been reported in terms of two quantities, the nominal incubation period (IP) and the maximum erosion rate (MER)2.
In previous work2, cavitation erosion behavior of pure
niobium was investigated by means of a 20 kHz ultrasonic vibrator at peak-to-peak amplitude of 50 μm, aiming to determine the niobium potential as a material for the
manufacturing of hydraulic machine components. The study was emphasized for the three irst cavitation stages of the cumulative erosion–time curve. The modiication of the niobium surface morphology as a function of the cavitation testing time in the incubation, acceleration, and maximum erosion rate stages was veriied for niobium samples in cold-worked and annealed conditions. Results indicated that the annealing treatment leads the niobium hardness to be decreased and its ductility to be increased, resulting to an increase of the incubation period when compared with the cold-worked niobium. Finally, it was concluded that the cavitation erosion failure mechanism in annealed niobium occurs in a sequence of events comprising the work-hardening effect and the fracture of debris allied to the effect of fatigue and microcracks formation.
On the other hand, plasma nitriding has been widely used in many industrial applications for different materials, aiming to improve speciic properties of treated surfaces, such as wear and fatigue resistance, surface hardness, corrosion resistance, and eventually to obtain reduced static friction coeficient between two solid surfaces. In recent work3,
plasma nitriding of pure niobium was investigated using a DC square waveform pulsed power supply of 5.0 kW for
First Results of Cavitation Erosion Behavior of Plasma Nitrided Niobium:
Surface Modiication
Ricardo Kertschera, Juliana Martins de Moraesa, Sérgio Henkea, Angela Nardelli Allensteinb,
Regis Henrique Gonçalves e Silvac, Jair Carlos Dutrac, Silvio Francisco Brunattoa*
aLaboratório de Tecnologia de Pós e Plasma – LT2P, Departamento de Engenharia Mecânica,
Universidade Federal do Paraná – UFPR, Av. Cel. Francisco H. dos Santos, 210, Jardim das Américas, CEP 81531-980, Curitiba, PR, Brasil
bSpectroScan Tecnologia de Materiais Ltda., R. Wanda dos Santos Mullmann, 1233,
CEP 83323-400, Pinhais, PR, Brasil
cLaboratório de Soldagem – LABSOLDA, Departamento de Engenharia Mecânica,
Universidade Federal de Santa Catarina – UFSC, Bloco B, Campus Universitário, s/n, Trindade, CEP 88040-900, Florianópolis, SC, Brasil
Received: July 28, 2015; Revised: August 24, 2015
This work presents the irst results of the plasma nitriding study performed in pure niobium in order to increase its cavitation erosion resistance. Samples were prepared from 98.9% purity and 90% reduction cold-rolled niobium bars. Annealing treatment of the cold-worked niobium samples was carried out in vacuum furnace at 1.33 Pa pressure, in the temperature of 1000 °C, for a time of 60 min. Annealed samples showing hardness of 80 HV were cut to dimensions of 20 × 30 × 4 mm3. Nitriding
treatment was conducted at 1080 °C, gas mixture of 90% N2 + 10% H2, low rate of 5 × 10⁻⁶ Nm3s–1,
and pressure of 1200 Pa (9 Torr), for a total time of 4 h comprised by two treatment steps of 2 h each. For comparison purpose, results for nitrided and non-nitrided niobium are confronted. Samples were characterized by XRD, nanoindentation, microhardness, SEM, and 2D surface topography and 3D interferometry proile analysis techniques. Cavitation testing was conducted according to ASTM G32-09. Comparatively, promising results based on the formation of niobium nitride phases in treated surfaces are presented and discussed in the present work.
the temperature range of 500-1080 °C, aiming to change the material surface characteristics due to heating and physical-chemical reactions caused by the ions and fast neutral bombardment during the treatment. Strong increase of the surface hardness varying on the order of 2.5 GPa for pure niobium (as non-nitrided) to 21 GPa in the as-nitrided condition was veriied, being this result attributed to the formation of ε-NbN and β-Nb2N hexagonal phases in the nitrided layer. In addition, signiicant changes on surface morphology and roughness of the treated samples were observed for the studied conditions and such results were discussed considering the sputtering and plasma species bombardment effect.
It is worth to mention that nitriding techniques have been successfully applied, mainly for different stainless steels, aiming to increase their cavitation erosion resistance. In prior work4, improvement of the cavitation erosion resistance was veriied by applying the high temperature gas nitriding technique for an AISI 304L austenitic stainless steel. In more recent work5, similar result was veriied, but
in this case, by using the low-temperature plasma nitriding technique in a CA-6NM martensitic stainless steel. In both the cases4,5, the gain on the cavitation erosion resistance was
attributed to nitrogen-expanded austenite formation in the nitrided layers. But, in the specialized literature, cavitation erosion behavior of plasma nitrided niobium has not been studied. Despite that signiicant research works have been done on the cavitation behavior of pure metals and metallic alloys, a much lesser degree of published works has studied the behavior of engineering ceramics6-13. Plasma nitriding
technique was used here in order to obtain niobium nitride (ceramic-like material) surfaces formed in pure niobium substrates. Thus, the cavitation erosion behavior of the obtained system ‘ceramic layer surface + metallic bulk’ is the main subject of the present work. Potential applications comprise the cavitation erosion problem in high temperature materials, like those used in gas turbines. In this entry, the reader is then irstly directed to aspects related to cavitation erosion behavior of structural ceramics, since the cavitation erosion behavior of ceramic materials are quite different from that of metals. The morphology and roughness changes of the nitrided surface, due to ions and fast neutrals bombardment is carefully characterized, considering that surface properties are determinant in cavitation erosion behavior of different substrates. Then, the new material formed at the plasma nitrided surface, typically a ceramic, is characterized in terms of its structure and mechanical properties, before being subjected to the cavitation erosion testing study.
2. Cavitation Erosion Behavior of Structural
Ceramics
Some important aspects of the cavitation erosion behavior of structural ceramics are presented in this section, aiming to base the main events that can be expected to occur when plasma nitrided niobium samples are subjected to cavitation erosion testing.
In a previous work6, aspects which can lead structural
ceramics to present high cavitation erosion resistance are discussed. Results clearly show that surface inishing critically
affects the incubation period, being that the selection of the correct material with a suitable surface preparation can increase the incubation period by over 1000%6. Ceramic
with high resistance to cavitation erosion in terms of both the incubation period and erosion rate would have ultraine microstructure, no porosity, high fracture toughness and a smooth surface inish, as a whole6. It was also observed by
studying different ceramic materials that the possibility of exploring compressive stresses in surface layers would be an interesting prospect to improve the incubation period6.
As presented in8, silicon nitride and zirconia has been
reported as the technical ceramics with the best cavitation erosion resistance in the literature6-8, comprising the main
subject for studies aiming to improve the performance of bearings, injectors or valves submitted to cavitation problem in real and different operating conditions, such as those veriied in rocket engines8,10,11. Karunamurthy et al. have
also shown that cracking in cavitation eroded silicon nitride is preferentially intergranular, leading erosion pits to be produced. The presence of microcracks at the pits boundaries would result in a coalescence mechanism or pits bridging formation, leading more pits to be successively removed as the surface exposition to cavitation erosion goes on10.
Finally, possible deformation and cracking mechanisms in the pit formation are presented in a study of cavitation exposure carried out in silicon nitride and zirconia8. In general
terms, according to the authors8, it has been established that
pseudoplastic deformation pits are formed when tensile stress induced by the impact of the collapsing bubble, leading the surface to be elastically deformed, is high enough to create cracks in intergranular phase next to the surface. These cracks release the slip systems in the crystals, making possible the occurrence of a small plastic deformation, as a result of the water pressure action, within the remaining grains after the impact8. Local plastic deformation tends to occur at the same
time as the surface is still highly elastically deformed, being that the plastically deformed surface its the new geometry of the elastically deformed bulk material8. After the pressure
action from the collapsing bubbles ends, the bulk material tends to return to its original geometry, but since the new surface does not match that geometry, a residual stress state is created, leading the pit to be formed8. For the case that
cracks are not created, the surface simply would return elastically to its original geometry8.
The different aspects evidenced in structural ceramic surfaces subjected to cavitation erosion testing, as above presented, comprise a list of possible events that could be also observed in nitrided surfaces exposed to cavitation testing, in the present work, considering the formation of niobium nitride phases at the niobium substrates. But, as it will be discussed hereafter, the main difference in this case is that the ceramic phase, supposedly formed at the substrate surface, comprises a nitrided layer obtained by nitrogen diffusion into a metallic bulk of the niobium substrate. So, the system ‘surface + bulk’ to be considered in this work would be formed by ‘ceramic layer + metallic bulk’, thus differing from those ‘ceramic surface + ceramic bulk’ as previously shown in references6-11.
for example, for thin ilms deposited on substrate surfaces, for which brittle mode fracture and ilm delamination would be present13. As expected for that case of thin ilm coatings,
independently of the substrate nature, if ceramic or metallic, adhesion should be a decisive property to be considered, which concludes the main aspects related to the present subject.
3. Experimental Procedure
Niobium samples were cut by wire electrical discharge machining (WEDM) in dimensions of 30 × 20 × 4 mm3 from
98.9% purity and 90% reduction cold-rolled niobium bar. Annealing treatment of the cold-worked niobium samples was carried out in vacuum furnace at 1.33 Pa (10–2 Torr)
pressure, in the temperature of 1000 °C, for a time of 60 min. The samples were ground using 220, 320, 400, 600 and 1200 SiC sand-paper. Aiming to obtain the inishing of the testing surfaces, samples were initially polished using 1.0 µm diamond paste, and inally polished with 0.05 μm Al2O3
solution. The etchant ASTM 160(a), composed of 20 ml HF, 15 ml H2SO4, 5 ml HNO3, 50 ml H2O, applied during 5 min by sample immersion, was used to reveal the nitrided layer and its thickness. The annealed niobium structure (the grain boundary) was revealed using the etchant ASTM 160 SWAB 15Ss, composed of 40 ml HF, 30 ml H2SO4, 10ml HNO3, 100ml de H2O, during 15 s application at the polished surface. Plasma nitriding was conducted at 1080 °C, gas mixture of 90% N2 + 10% H2, low rate of 5 × 10⁻⁶ Nm3s–1 (300 sccm),
and pressure of 1200 Pa (9 Torr). The total nitriding time of 14.4 ks (4 h) was achieved by two treatment steps of 7.2 ks (2 h) each, intercalated by the vacuum chamber cooling up to room temperature. Treatments were carried out using 4.16 kHz square-wave pulsed DC power supply, at a peak voltage of 670 ± 15 V, and pulse period of 240 µs. The sample temperature was controlled by varying the duty cycle, and it was measured by means of a chromel-alumel thermocouple (type K, and 1.5 mm diameter), which was inserted to a depth of 15 mm inside the sample. Before nitriding step, sample was cleaned using H2 glow discharge at 300 °C, for 0.6 ks (10 min), and pressure of 400 Pa (3 Torr). After this step, the gas pressure was adjusted to the speciied value of 1200 Pa (9 Torr), and the sample was heated up to the nitriding temperature by plasma species bombardment at a heating rate on the order of 0.32 °Cs–1.
The 30 × 20 mm2 sample surfaces were characterized by
SEM, XRD, nanohardness, microhardness, and high precision 3D interferometry proile analysis techniques. Measurements of surface inishing were performed in accordance with ISO 25178, using a Talysurf CCI - Lite Non-contact 3D Proiler, from Taylor Hobson. In this case, measurements were performed before and after plasma nitriding treatment, using a area of 1.5 × 1.5 mm2, with a resolution of 1632 µm,
1633 µm, and 0.01 nm, for X, Y, and Z axis, respectively. The average and standard deviation values of the surface roughness parameters Sa, Sz, Sp, Sv, Sds, Ssk, and Sku, here presented, were obtained by analyzing six measure areas per sample, being realized three characterizations on each sample side. It is to be noted that 3D roughness parameters give more signiicant values than the 2D ones, which are achieved by analyzing the roughness proile on a rope.
According to standard ISO 25178, 3D parameters Sa, Sz, Sp, Sv, Sds, Ssk, and Sku, can be understood as follows:
i) Sa = the average (arithmetic mean) or the absolute values for the peaks height and valleys depth in the measured area;
ii) Sz = the mean of the maximum height of the surface, or the height between the highest peak and the deepest valley;
iii) Sp = the maximum peak height, or the height between the highest peak and the medium plane;
iv) Sv = the maximum valley depth, or the deep between the deepest valley and the medium plane;
v) Sds = the density of summits. This parameter is expressed in peaks/mm2. It takes into account that a
determined point is considered a peak if it is higher than its 8 neighbors;
vi) Ssk = the skewness. Skewness equal to zero means a symmetrical height distribution in relation to the average line, for eventual occurrence of deep valleys or high peaks; skewness positive (Ssk > 0, or skewed downward in relation to the average line), is typical for surfaces with high peaks and/or illed valleys; and skewness negative (Ssk < 0, or skewed upward in relation to the average line) tends to represent surfaces with deep scratches and/or removed peaks; and, inally,
vii) Sku = the kurtosis. Kurtosis equal to 3 relects in a normal probability density curve in terms of the surface roughness height distribution; for Sku > 3, the curve height distribution in relation to the average line is spiked, that means the occurrence of many high peaks and many deep valleys; in the other hand, for Sku < 3, the form of the surface roughness height distribution is squashed, that means the occurrence of few high peaks and few deep valleys.
Vickers microhardness characterization of the studied surfaces was performed using a Shimadzu Micro Hardness Tester HMV2T, for applied loads of 0.5 (50 gf), 1 (100 gf), and 2 (200 gf) N, and peak-load contact of 15 s. The presented hardness values correspond to a mean of four measurements, in each case. Nanoindenter XP-MTS System was also used to determine the hardness and to perform scratch testing and roughness analysis of the studied surfaces. The hardness versus penetration depth curves were obtained on the average of 25 (5 × 5 matrix) indentations with 100 µm spacing, using a Berkovich type indenter, and 12 charge-discharge cycles, for loads up to 400 mN (40 gf) and 10 s loading time. The scratch tests were performed using loadings from 0 to 400 mN (0 to 40 gf), scratch length of 600 μm and indenter translation velocity of 10 μms–1. Topography proiles at the studied
surfaces were also obtained, by making the indenter tip to run along 0.5 μm length.
with CuKα radiation, at Bragg-Brentano coniguration, for 2θ angles ranging from 30 to 120°, and scanning speed of 0.01° s–1. On the other hand, Scanning Electron Microscopy
(SEM) analysis was performed aiming to determine the surface morphology of the studied samples and the characteristics of the cavitation eroded surfaces, using two distinct equipments, in the case one from JEOL and other from Zeiss.
The cavitation experiment as a function of testing time was conducted on nitrided and non-nitrided niobium surfaces, using a standard cavitation erosion tester, according to ASTM G 32-09. Samples were tested via indirect method, using an ultrasonic generator KLN type 500. The vibratory frequency and the peak-to-peak amplitude were 20 ± 2 kHz and 50 ± 1.0 μm, respectively. The tip of the probe was machined from AISI 304 stainless steel and polished for 1.0 μm surface roughness. The temperature of the distilled water bath was maintained at 25 ± 2 °C. The surface of the test specimen was immersed 12 mm in distilled water, distant 0.5 ± 0.005 mm from the probe tip. The cumulative mass loss of the test specimens was determined by means of 0.1 mg precision balance, for testing times up to 960 min (16 h). The cavitation erosion behavior results are discussed in terms of the three irst cavitation stages of the cumulative erosion-time curves. Experiments were repeated to conirm the reproducibility and to determine the dispersion range of the obtained results.
4. Results and Discussion
4.1. Characterization of plasma nitrided niobium
surface
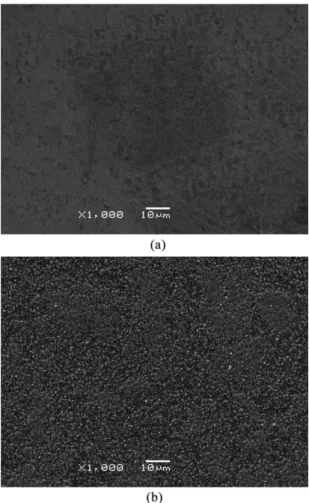
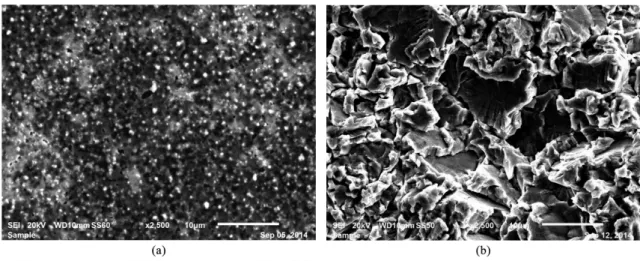
SEM micrograph of the surface aspect of non-nitrided and nitrided niobium is presented in Figure 1a, b, respectively. Figure 1a shows the initial condition of the surface obtained by mechanical polishing before being subjected to plasma nitriding treatment. Signiicant change of the polished surface morphology (Figure 1a) is observed by comparing with that of the plasma nitrided sample (Figure 1b). The changes in the surface morphology are due to the different phenomena of the plasma-surface interaction occurring in plasma nitriding, leading the nitrided layer to be formed at the treated surface, in the case, sputtering, scattering and backdiffusion in gas phase of sputtered metal atoms, with eventual subsequent condensation at the original surface. Formation of clusters of condensed metal atoms and nitrogen at the surface tends to result in island-like products nucleated at the surface, at the same time in which the nitrided layer is formed by diffusion of nitrogen into the substrate bulk. Such island-like products nucleated at the surface can be easily seen in Figure 1b, and they are responsible by the morphology modiication observed on the plasma nitrided surface. The surface morphology noted for the nitrided sample (Figure 1b) also remembers the presence of atom islands growing at the surface, as presented in3. In that case3, the mechanism of surface modiication was
supposedly due to sputtering and re-condensation of atoms on the surface, resulting in the formation of atom islands and/or clusters at the surface, in similar way to the veriied in thin ilm formation, according to Chapman14. The increment of the surface inishing parameters observed for the studied
nitrided samples agrees very well with the formation of sub-micrometric atom islands at the treated surface.
The assertion with regard to islands-like products nucleated at the nitrided surface is based on the 2D topography proile results presented in Figure 2. It is shown in Figure 2 that the number of peaks with amplitude between 0 and +600 nm at the nitrided surface was strongly increased in relation to the valleys (which ranged between 0 and –400 nm), comparatively to the non-nitrided surface. This is also conirmed by Table 1 results, which shows the average and standard deviation values of the 3D surface roughness parameters Sa, Sz, Sp, Sv, Sds, Ssk, and Sku. According to Table 1, Sa, Sz, Sp, Sv, and Sds values of the nitrided surface were increased of 5.2, 4.0, 6.5, 2.7, and 1.8 times in relation to non-nitrided surface, all these roughness parameters conirming the assertion regarded to the islands-like products nucleated at the nitrided surface, which make the surface roughness to be grown. Despite that the veriied roughness increment in the nitrided surface could be detrimental for cavitation erosion purposes, since it is very well established that roughness surface and cavitation resistance tend to be inversely correlated greatness, it is to be considered that the referred roughness increment is a self-result of the plasma nitriding process, and additional efforts to be conducted are necessary aiming to overcome this supposed problem.
In addition, considering the Ssk results, the negative value (–0.85) veriied at the non-nitrided surface tends to conirm the occurrence of a surface presenting deep scratches, and/or removed peaks, agreeing well with the initial condition of the studied surface which was achieved by polishing. On the other hand, the skewness at 4 h plasma nitrided surface was changed to a positive value (+0.02), clearly indicating a surface presenting high peaks, and/or illed valleys. It is to be noted that the Ssk, and Sp results of the nitrided surface also agree with the islands-like morphology shown in Figure 1b, by comparing with the results of the non-nitrided surface. To inish, the Sku values veriied for both the non-nitrided and nitrided surfaces were higher than 3. For Sku > 3, the curve height distribution in relation to the average line is spiked, that means the occurrence of many high peaks and many deep valleys. It is also presented in Table 1, 3D surface roughness parameters results of repolished-after-nitrided
surface. Repolishing procedure of the nitrided surface was necessary since the high roughness veriied for the nitrided surface makes impossible the hardness characterization by nanoindentation technique, as veriied ahead (see Figure 3 results).
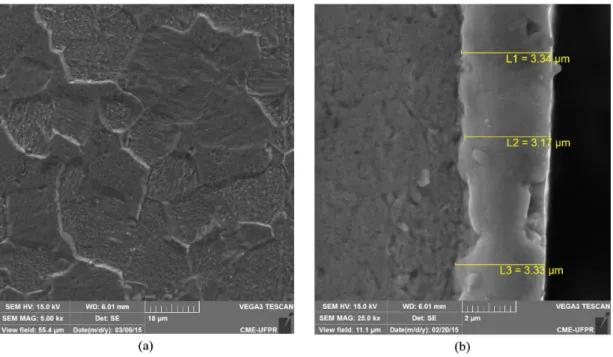
In addition, it is shown in Figure 4a, b, cross-section SEM micrographs of the niobium before nitriding, and the aspect of the nitrided layer obtained after 4 h (2 + 2 h) nitriding treatment, respectively. A typical full annealed niobium microstructure can be observed in Figure 4a, which is characterized by equiaxed grains present all over the niobium substrate. In Figure 4b, nitrided layer thickness measured values attained by SEM observation are shown, conirming that the nitriding procedure used in present work has led to the obtainment of nitrided layers on the order of 3.3 μm in depth. It is to be noted that both the Figures 1b and 4b correspond to the same specimen, and the evidence of islands formed on the surface as well as the eventual presence of craters between the coalesced islands, in Figure 4b, depends exclusively on the position of the cut at the cross-section, during the sample preparation stage. Finally, the XRD patterns of the nitrided and non-nitrided surface studied in present work are shown in Figure 5. Results indicating the presence of NbN-ε and Nb2N-β phase layer conirm the formation
of typical ceramic material in the nitrided surface, being in agreement with earlier results presented in3.
4.2. Mechanical characterization of the nitrided
layer
Figure 6 shows hardness values of the studied surfaces as a function of the load obtained by using the Vickers indentation technique. The relatively constant measured values, on the order of 85 HV for non-nitrided surfaces are in agreement with the expected for the annealed pure
Table 1. Average (+ standard deviation) values for the surface roughness parameters Sa, Sz, Sp, Sv, Sds, and Ssk, obtained at non-nitrided, nitrided, and repolished-after-nitrided surfaces.
Condition Sa (µm) Sz (µm) Sp (µm) Sv (µm) Sds (1/mm2) Ssk Sku
Non-nitrided 0.05 (0.06) 0.60 (0.07) 0.20 (0.01) 0.41 (0.06) 10900 (445) –0.85 (0.17) 5.45 (1.72) Nitrided 0.26 (0.02) 2.42 (0.22) 1.31 (0.25) 1.10 (0.05) 19700 (750) 0.02 (0.15) 3.45 (0.41) Repolished 0.11 (0.01) 1.08 (0.07) 0.51 (0.08) 0.61 (0.06) 25117 (1111) –0.27 (0.06) 3.81 (0.29)
Figure 2. 2D topography proile results of the non-nitrided and
nitrided niobium surface.
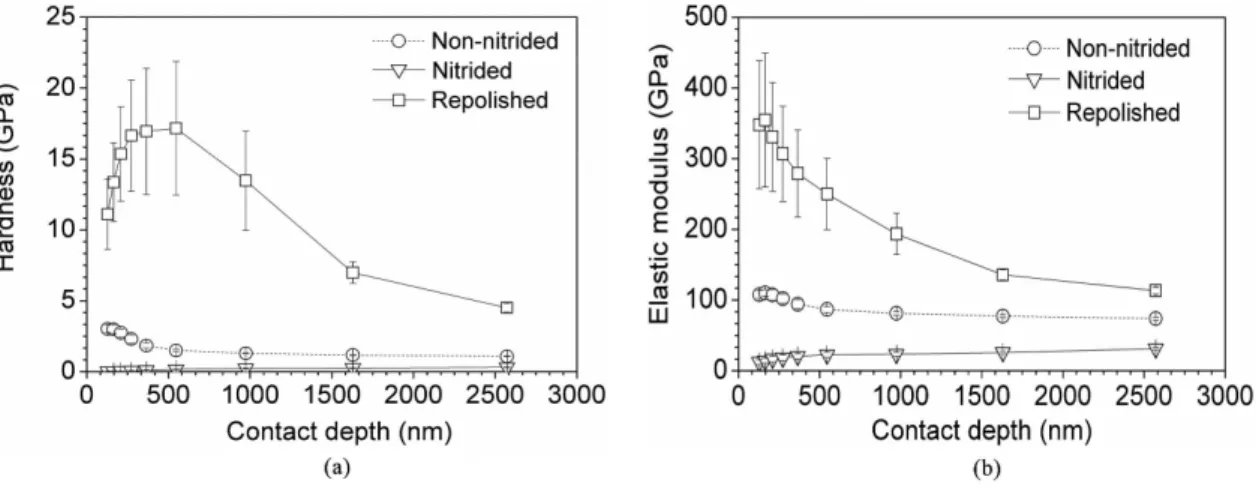
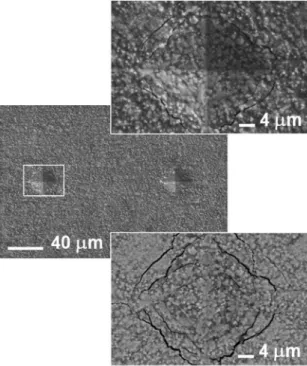
niobium substrates. On the other hand, strong variation in the measured values of the nitrided surface can be observed by decreasing the used load from 2 to 0.25 N load. This result is due to the inluence of the chemically non-altered niobium substrate bulk (which is very ductile) on the nitrided surface hardness measurement, since the obtained nitrided layer is too thin, as shown in Figure 4b. Thus the value on the order of 900 HV obtained using 0.25 N load is far from being the true hardness of the nitrided surface. In Figure 7, the brittle feature of the studied system formed by ‘ceramic (NbN) layer + metallic (Nb) bulk’ can be evidenced by the presence of cracks around the Vickers indentation performed at 2 N loading. In this case, SEM micrography of the indicated indentation (in the center, at the left) was detailed by using higher magnitude, and secondary electrons (at the top), and backscattered electrons (at the bottom) detectors. Aiming to determine the nitrided surface hardness closer to the true value, nanoindentation technique was also performed. Figure 3a, b, show the nanohardness, and elastic modulus results as a function of the indentation (penetration) depth, for the studied surfaces, respectively. The nanoindentation characterization of the surface in the as-nitrided condition was not possible to be achieved, since values close to zero were obtained, as shown in Figure 3a. These unreal results were due to the high roughness of the nitrided surface (see Figure 1b, and Table 1 results). It is to be noted that the problem of nanoindentation characterization in rough surfaces attained by plasma nitriding is well known, and it has been extensively stressed in15. Aiming to turn this
problem, the original nitrided surface was repolished, and a new topography was obtained showing lower roughness values (see Table 1). This procedure made possible to estimate maximum nitrided surface hardness values on the order of 18 GPa, on average, at 500 nm penetration depth,
Figure 4. Cross-section SEM micrography of the: (a) niobium substrate bulk, before nitriding; and (b) nitrided layer, obtained after 4 h (2 + 2 h) nitriding treatment.
Figure 5. The XRD pattern of the nitrided and non-nitrided niobium surface.
which agrees well with results previously presented in3,
considering the differences of nitriding conditions in both the works. For comparison purpose, it is to be noted that 1 GPa is usually correlated to be equal to 100 HV.
In addition, the empirical rule for which the substrate bulk effect on the measured hardness of a hard ilm tends to be negligible for small indenter penetration depths, usually smaller than 10-20% of the total ilm thickness, in accordance with16, was conirmed here. In this case, the measured nitrided layer thickness value of 3.3 μm (as shown in Figure 4b) is attained to the condition for which the penetration depth of 500 nm would correspond to 15% of the total nitrided layer thickness. On the other hand, the lower hardness values ranging from 11 to 18 GPa, at shallow tip penetrations (< 500 nm), are also due to the nitrided surface roughness. Finally, for penetration depths > 500 nm, a continuous decrease to hardness values near 5 GPa is veriied for contact depths up to 2580 nm. In Figure 3b, the elastic modulus determination shows a decrease on average on the order of 360 (ranging from 450 GPa maximum value to 250 GPa minimum value) to 120 GPa range, by varying the penetration depth from 170 to 2580 nm, respectively. For comparison purpose, it is to be noted that nanocrystalline NbN ilms has shown high hardness (36.6 GPa) and a high elastic modulus (457 GPa) and a good elastic recovery (71%), as presented in17. On the
other hand, non-nitrided niobium has presented hardness, and elastic modulus on the order of 1 GPa, and 100 GPa, respectively (Figure 5), which agree well with the expected for pure niobium18,19. The whole of properties obtained for the nitrided samples in this work, as above mentioned, conirms that very hard and thin surfaces, thus apparently presenting low ductility, were obtained in present case.
4.3. Cavitation erosion behavior characterization
of the system formed by ‘ceramic (NbN)
layer + metallic (Nb) bulk’
Figure 8 presents the cumulative mass loss (CML) curve as a function of the cavitation erosion time for non-nitrided and nitrided niobium. It is evidenced that nitrided niobium surfaces, comprising the system formed by ‘ceramic (NbN) layer + metallic (Nb) bulk’ in study, tend to present higher cavitation resistance than at the non-nitrided niobium. For the case of annealed niobium, as presented in2, the energy provided
by the impacts of microjets and/or spherical collapse of micro bubbles would be spent in higher proportion to produce plastic deformation work on the specimen surface, resulting in the work-hardening effect, which necessarily precedes the crack formation process in materials typically ductile like niobium. On the other hand, for the nitrided niobium surface, the formation of niobium nitride phases (NbN-ε and Nb2N-β)
has necessarily led to a strong strengthening of the surface, when confronted with its original state, before nitriding, as veriied by the Figure 3a, b nanoindentation characterization results. In this case, the whole of properties obtained for the nitrided samples in this work conirms that very hard and thin nitrided layer surfaces, thus apparently presenting low ductility, were obtained. Since the hexagonal niobium nitride phase presents high covalent character, such material tend to show no plastic deformation when submitted to mechanical loading, thus the main way to relieve the imposed stresses due to the bubbles collapse, in cavitation erosion testing, would be by nucleating cracks next to surface. As seen, the results of Vickers indentation test (see Figure 7) using 2 N (200 gf) load on the niobium nitrided surface conirms the assumption that the nitrided layer in niobium substrates tends to present low ductility, at least for the conditions studied here. In the case of Figure 7, the damaged surface characterized in details by SEM images using as secondary electrons as backscattered electrons detectors, clearly shows the occurrence of microcracks, which apparently show no plastic deformation. It is to be noted that cracking
Figure 7. SEM image of microhardness (Vickers) indentations performed at 2 N load in the nitrided niobium surface (in central). Indentation detail attained by using secondary (at the top), and backscattered electron (at the bottom) detectors.
Figure 8. The cumulative mass loss (CML) curve as a function of the cavitation erosion time for non-nitrided and nitrided niobium
and spalling are the predominant modes of wear for hard brittle materials, according to Stachowiak1, being the case
of the surface system studied here. The SEM images of the cavitation eroded surface of a nitrided niobium sample tested for a time of 180 min, and 960 min are presented in Figure 9a, b, respectively. Figure 9a shows a typical surface morphology in the incubation stage, presenting few and too small pits formation (black-aspect points), and no apparent undulations. In this case, the single impact loads tend to remove some and small sharply edged nanoparticles during the incubation stage, being that the sites in which such particles are extracted seem to coincide with the original positions of the island-like products nucleated at the surface. Eventually craters formed in the irst incubation period cycles can also be present (results not-shown) conirming that advanced material removal can be veriied in very small and speciic sites in the initial times of the cavitation testing. On the other hand, craters formed in profusion all over the nitrided surface, eroded at the 960 min cavitation testing time, can be seen in Figure 9b. In this case, the appearance of fatigue striations inside the craters, in speciic sites, similar to veriied in2, is
strong indicative that the nitrided (ceramic phase) layer was completely removed from the surface by cavitation erosion at the longest testing time (see Table 2). This assumption is based on the fact that the nitride layer tends to fail in brittle mode, as expected for ceramic phases, thus at the absence of fatigue fail mode, which is the typical cavitation erosion mechanism of metals.
Table 2 summarizes the results obtained to determine the cumulative mass loss (CML), and the average erosion rate
(AER) as a function of the cavitation erosion testing time for non-nitrided and nitrided niobium samples. The CML and AER values were 43.9 mg and 14.6 mg/h for non-nitrided niobium, and 0.6 mg and 0.2 mg/h for nitrided niobium, respectively.
These results indicate that non-nitrided niobium has reached the maximum erosion rate stage, as veriied in2,
while the nitrided niobium is in the incubation stage. On the other hand, CML and AER values of 44.5 mg and 2.78 mg/h, respectively, were determined for the nitrided niobium at 960 min cavitation testing time. In this case, the strong inclination difference of both the cavitation erosion curves of the Figure 8 results, for testing times longer than the incubation time of each case, conirm that the system ‘ceramic layer + metallic bulk’ cavitation erosion behavior tends to be slightly changed from the accelerate stage to the maximum erosion rate stage, after the incubation period. Such behavior shall be associated to the fact that the niobium nitride presents elastic modulus of about 4 times higher than the metallic niobium. In this case, the nitrided layer tends to respond elastically to the impacts of microjets and/or spherical collapse of bubbles and this would explain its better behavior to cavitation erosion testing. Finally, from the Figure 8 results, it can be determined that the nominal incubation period (IP) of the nitrided niobium (on the order of 200 min) was at least twice higher than that veriied for non-nitrided niobium (of about 90 min), for the nitriding conditions studied here.
Table 2. Cumulative mass loss (CML) and the average erosion rate (AER) values as a function of the cavitation erosion testing time for non-nitrided and nitrided niobium samples.
Parameter Nb condition
Cavitation Time (min)
0 20 40 60 80 100 120 140 160 180 200 220 240 360 480 600 720 840 960
CML (mg) Non-nitrided 0 0 0 0 2.3 8.1 16.4 23.1 32.6 43.9 - - -
-Nitrided 0 0.2 0.2 0.2 0.3 0.3 0.5 0.5 0.5 0.6 1.0 1.5 1.8 6.9 13.3 17.4 24.6 34.1 44.5
AER (mg/h) Non-nitrided 0 0 0 0 1.7 3.0 8.2 9.9 12.2 14.6 - - -
-Nitrided 0 0.6 0.3 0.2 0.2 0.1 0.25 0.2 0.19 0.2 0.3 0.41 0.45 1.55 1.66 1.74 2.05 2.43 2.78
5. Conclusion and Final Remarks
The irst results of the plasma nitriding study performed in pure niobium in order to improve its cavitation erosion behavior were presented in this work. Emphasis was given to determine the cavitation erosion behavior of the system ‘ceramic layer + metallic bulk’, by confronting it with the metallic system behavior, in the case the non-nitrided (or pure) niobium. The main conclusions can be listed as follows:
• Plasma nitriding process successfully leads the niobium substrate to have improved its cavitiation erosion behavior;
• The increase of the cavitiation erosion resistance is attributed to the whole of mechanical and metallurgical properties of the obtained system ‘ceramic layer + metallic bulk’, which is constituted of NbN-ε and Nb2N-β phases present in the ceramic layer, and niobium in the metallic bulk;
• The cavitation erosion behavior of the system ‘ceramic layer + metallic bulk’ tends to present a slight change from the accelerate stage to the maximum erosion rate stage, after the incubation period, when compared to the non-nitrided niobium;
• The character more resilient of the nitrided layer in relation to the non-nitrided niobium, evidenced here, opens up a new and promising ield for niobium research; and, inally,
• Additional efforts are being conducted in the present moment, aiming to elucidate the cavitation erosion fail mechanism of the system ‘ceramic layer + metallic bulk’ obtained in this work.
Acknowledgements
This work was supported by CNPq, Fundação Araucária of the Paraná State, CNPq-Universal Grant N. 482380/2012-8, and MCTI/CNPq/CT-Aquaviário Grant N. 456347/2013-5. The authors also wish to express their thanks to the Laboratory of X-ray Optics and Instrumentation (LORXI) and Laboratory of Minerals (LAMIR) from UFPR, by the use of the XRD and SEM equipments, and to Dr. Sara Blunk by performing the nanoindentation characterization. Thanks are also due to Dr. Julio Klein Neves, and Dr. Giuseppe Pintaúde from UTFPR, by the use of SEM and the high precision 3D proile analysis equipment.
References
1. Stachowiak GW and Batchelor AW. Abrasive, erosive and cavitation wear engineering tribology. 3rd ed. Boston: Butterworth-Heinemann; 2006.
2. Brunatto SF, Allenstein AN, Allenstein CLM and Buschinelli AJA. Cavitation erosion behavior of niobium. Wear. 2012; 274-275:220-228. http://dx.doi.org/10.1016/j.wear.2011.09.001. 3. Borcz C, Lepienski CM and Brunatto SF. Surface modification
of pure niobium by plasma nitriding. Surface and Coatings Technology. 2013; 224:114-119. http://dx.doi.org/10.1016/j. surfcoat.2013.03.008.
4. Santos JF, Garzón CM and Tschiptschin AP. Improvement of the cavitation erosion resistance of an austenitic AISI 304L stainless steel by high temperature gas nitriding. Materials Science and Engineering: A. 2004; 382:378-386.
5. Allenstein AN, Lepienski CM, Buschinelli AJA and Brunatto SF. Improvement of the cavitation erosion resistance for low-temperature plasma nitrided CA-6NM martensitic stainless steel. Wear. 2014; 309(1-2):159-165. http://dx.doi.org/10.1016/j. wear.2013.11.002.
6. Tomlinson WJ and Matthews SJ. Cavitation Erosion of Structural Ceramics. Ceramics International. 1994; 20(3):201-209. http:// dx.doi.org/10.1016/0272-8842(94)90040-X.
7. Niebuhr D. Cavitation erosion behavior of ceramics in aqueous solutions. Wear. 2007; 263(1-6):295-300. http://dx.doi. org/10.1016/j.wear.2006.12.040.
8. Fatjó GGA, Hadfield M and Tabeshfar K. Pseudoplastic deformation pits on polished ceramics due to cavitation erosion. Ceramics International. 2011; 37(6):1919-1927. http://dx.doi. org/10.1016/j.ceramint.2011.03.043.
9. Pedzich Z, Jasionowski R and Ziabka M. Cavitation wear of structural oxide ceramics and selected composite materials. Journal of the European Ceramic Society. 2014; 34(14):3351-3356. http://dx.doi.org/10.1016/j.jeurceramsoc.2014.04.022.
10. Karunamurthy B, Hadfield M, Vieillard C and Morales G. Cavitation erosion in silicon nitride: Experimental investigations on the mechanism of material degradation. Tribology International. 2010; 43(12):2251-2257. http://dx.doi. org/10.1016/j.triboint.2010.06.012.
11. Karunamurthy B, Hadfield M, Vieillard C, Morales-Espejel GE and Khan Z. Cavitation and rolling wear in silicon nitride. Ceramics International. 2010; 36(4):1373-1381. http://dx.doi. org/10.1016/j.ceramint.2010.02.011.
12. Krella AK. The new parameter to assess cavitation erosion resistance of hard PVD coatings. Engineering Failure Analysis. 2011; 18(3):855-867. http://dx.doi.org/10.1016/j. engfailanal.2010.10.002.
13. Krella A and Czyzniewski A. Influence of the substrate hardness on the cavitation erosion resistance of TiN coating. Wear. 2007; 263(1-6):395-401. http://dx.doi.org/10.1016/j.wear.2007.02.003. 14. Chapman B. Glow discharge processes. New York: John Wiley
& Sons; 1980.
15. Souza GB, Foerster CE, Silva SLR and Lepienski CM. Nanomechanical properties of rough surfaces. Materials Research. 2006; 9(2):159-163. http://dx.doi.org/10.1590/ S1516-14392006000200009.
16. Foerster CE, Assmann A, Silva SLR, Nascimento FC, Lepienski CM, Guimarães JL, et al. AISI 304 nitrocarburized at low temperature: Mechanical and tribological properties. Surface and Coatings Technology. 2010; 204(18-19):3004-3008. http:// dx.doi.org/10.1016/j.surfcoat.2009.12.030.
17. Han Z, Hu X, Tian J, Li G and Mingyuan G. Magnetron sputtered NbN thin films and mechanical properties. Surface and Coatings Technology. 2004; 179(2-3):188-192. http:// dx.doi.org/10.1016/S0257-8972(03)00848-X.
18. American Society for Microbiology - ASM. Properties and selection: nonferrous alloys and special-purpose materials. 10th ed. Ohio; 1990. ASM Handbooks, v. 2.