*e-mail: [email protected]
1. Introduction
Aluminum–silicon (Al-Si) alloys belong to important group of casting alloys. Such alloys are characterized by good castability, relatively low melting temperature, corrosion resistance, high strength to speciic weight ratio (greater than steel), amongst other things. Therefore, these alloys ind their application in the automotive industry, machinery and household industries, as well as in military and aviation applications. Their mechanical properties are directly affected by shape, size and distribution of silicon crystals, aluminum grain size, as well as shape and parameters of dendrite, which are considered as the main factors inluencing application ield of the Al-Si alloys in production of the castings 1-7.
The coarse structure of the alloy, disadvantageous from technical point of view, having adverse effect on the mechanical properties of the castings, can be effectively eliminated by use of modiication processes. The process of chemical modiication comprises adding small quantities of chemical elements (the most often - Na, Sr, Sb) to the melt, what changes coarse and large needles of silicon into a ine and well-rounded form 8-14, advantageously inluencing the mechanical properties, mainly the plasticity.
Therefore, conscious control of the technological parameters to optimize obtained structure of the material, and hence to adaptation of material properties to a speciic requirements, emerges as an important factor leading to quality improvement of the castings. Thermal analysis consisting in recording of temperature during crystallization of the alloy belongs to one from the most common methods used for assessment and estimation of the grain size, extent of the alloy’s modiication, and temperature of phase transformations of the alloy15-18.
In many cases, however, a simple thermal analysis is not sensitive enough to describe the thermal processes being in progress, and in such cases a simultaneously plotted curve is used, which is considered more helpful. The curve illustrates the derivative dT/dt, what enhances less visible changes present on the cooling curve T = f(t) 19 (method of
the thermal-derivative analysis – ATD method). Except such methods, other methods based on thermal effects (DTA, ATDG method) 20-22, thermo-electric effects (ATD-AED method) 23, and thermo-voltage effects (ATND method) are also used 24-29.
The ATND (thermal- voltage- derivative analysis) method is the author’s own method of analysis of the crystallization process. This method was developed as a combination of the ATD method and measurement of the voltage present during crystallization and phase transformations of the casting alloys, complementing information about structural transformations of the alloy. The testing probes measure differences of electric potential within volume of the test piece. The voltage arisen during crystallization of the test piece is small but well measurable (included within range of ± 5 mV). The phenomenon of the electric voltage present during the crystallization process belongs to the cumulative electric effect connected with changes of the state of aggregation. Combination of the above mentioned methods gives a distinct picture of the changes occurring during crystallization and solidiication of the alloy. The generated voltage and temperature are recorded during the process. The course of the crystallization process is presented in form of diagrams, created quickly and accurately during solidiication of the alloy, relecting structural changes of the alloy during the solidiication (formation of phases and eutectic mixtures).
At the current stage of the research, such method is used under laboratory conditions to record the crystallization processes in aluminum casting alloys, to identify phase transformations [24,27-28], and to predict the mechanical properties 25,26,29.
The main topic of the present investigation is prediction of the mechanical properties (yield strength R0,2 and hardness HB 10/1000/30) of the AlSi13Cu2 alloy with the use of the ATND method, providing information on properties of the alloy as early as at the stage of its preparation, what is especially important in case of performed modiication, aimed at improvement of the mechanical properties of the alloy.
Prediction of Mechanical Properties of AlSi13Cu2Fe Alloy Using the ATND Methods
Jacek Pezdaa*
aDepartment of Manufacturing Technology and Automation, University of Bielsko-Biała, Poland
Received: February 5, 2015, Revised: October 22, 2015, Accepted: December 16, 2015
The present paper describes an experimental testing method connected with use of the thermal-voltage-derivative analysis (the ATND method in short) to crystallization recording of the AlSi13Cu2Fe eutectic alloy in aspects of possible prediction of its mechanical properties, basing on dependencies obtained from regression analysis, performed on the basis of temperature and voltage values of characteristic points seen on curves from the ATND method. Results of the experiment have demonstrated a signiicant relation between values of the characteristic points from the ATND method and the mechanical properties (yield strength R0,2 and hardness HB 10/1000/30). Moreover, obtained dependencies have enabled prediction of the yield strength R0,2 and the hardness HB 10/1000/30 as early as at preparation stage (melting) of the investigated alloy, what allows quick correction of performed modiication process.
2. Experimental procedure
The AlSi13Cu2Fe alloy is classiied as a multi-component alloy used in the foundry industry. This alloy is graded as a near eutectic alloy (silicon, as the alloying element is present in a quantity near to eutectic). The chemical composition of the alloy is presented in Table 1.
The analysis of the chemical composition was performed with use of emission spectroscopy method (spectrometer of the ARL 3440 type).
To prepare test pieces for the testing, the alloys were melted in an electric resistance furnace at temperatures of about 760 - 780 °C. The next treatment consisted in reining of the melt by the Rafal 1 lux. This operation entails the treatment of aluminum alloys (or magnesium alloys) with the degassing lux at 730°C for 5 min. The lux is based on hexachloroethane. The lux is in the form of 50-g pellets submerged on the bottom of the metal bath and is used in quantity corresponding to 0.4% of the weight of the melt 30. Reined alloys, after removal of oxides and slag from the surface of the liquid metal, were modiied with the AlSr10 master alloy in quantity of 0.6% mass of charge (0.06% Sr) at temperature of 780 oC.
The modiied alloy was poured into a metal mould intended for production of standardized castings of the test pieces used to determination of the mechanical properties. The metal mould was adapted to controlling of the crystallization processes with use of the ATND method (Fig. 1). The metal mould was heated to temperature of 250 oC.
After removal of the sink head and the gating system from cylindrical part of the casting having diameter of 15 mm and length of 180 mm, it has been produced the test pieces with threaded heads, having diameter of 6 mm (Fig. 2).
The static tensile test was performed on the Schenck PSB 100 testing machine according to the PN-EN ISO 6892-1:2010 standard 31. Recording of strain of the test piece under load was performed with use of the Schenck-DSA 25/10M extensometer with measuring base of 24,9 mm and measuring range of ±2,5 mm. The test was performed with constant displacement speed of the cross-beam of the tester equal to 1,6x10⁻⁵s-1. The Brinell hardness measurement according to the PN-EN ISO 6506-1:2008 standard 32, using the Brinell hardness tester of the PRL 82 type, was carried out using a steel ball with a diameter of 10 mm, under load of 9800 N, sustained for 30 seconds.
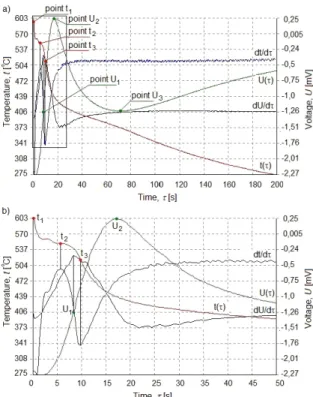
The crystallization process of the investigated alloy was recorded with use of the ATND method, with marked characteristic points on the thermal (t1 - t3) and voltage (U1 - U3) curves, what is shown in the Fig. 3.
Characteristic points on the thermal and voltage curves taken from the ATND method are connected with crystallization of the alloy and phase transformations in solid
state, which has direct effect on the structure, and thus on the mechanical properties of the material. During recording of the crystallization process and cooling of the investigated alloy, these points are present in form of a distinct “peaks” on curves of the ATND method.
The ATND method consists in continuous measurement of temperature and electric voltage generated on the probes during crystallization and phase transformations of the solidiied alloy. The generated voltage and temperature of the investigated test pieces were recorded in course of the measurement. The course of the crystallization is presented in form of diagrams created during solidiication of the alloy. Based on obtained values of the characteristic points from the ATND method (independent variables) and values of the mechanical properties (dependent variables), computer iles were created with input data to regression analysis, performed with use of the Statistica, version 10, packet developed by the StatSoft Company.
The irst order polynomial was assumed as a function of the tested object (1).
Table 1. Chemical properties of the AlSi13Cu2Fe alloy
Chemical composition (% weight)
Si Fe Cu Zn Ti Mn Ni Sr Pb Cr Mg Al
11.89 0.805 2.22 0.32 0.018 0.15 0.036 0.045 0.036 0.036 0.163 Balance
Fig. 1. Metal mould to pouring of the test pieces and controlling of the crystallization process with use of the ATND method
0 1 1 2 2 3 3 ... n n
z= +b b x +b x +b x + +b x ±ε (1)
where:
z - dependent variable (R0,2, HB),
x1, x2, ..., xn - independent variables (t1 ÷ t3, U1 ÷ U3), b0, b1, ..., bn - estimator of regression,
ε - standard error of estimation.
3. Description of the obtained results
As result of the regression analysis, the dependencies (2, 4-5) were obtained, which describe effect of the characteristic points values on change of the mechanical properties of the AlSi13Cu2Fe alloy modiied with strontium.
3.1. Yield strength R
0,2The R0,2 value for the modiied alloy was included within limits from 125 to 148 MPa. The complete model of the R0,2 value is presented by the equation (2).
R0,2 = 379.1 - 0.08t1 - 0.41t2 + 0.06t3 - 10.8U1 + 10.3U2 + 5.2U3 ± 2.29 [MPa] (2)
A high determination coeficient R2=0.92, denoting 92% of general variability of the yield strength R0,2, was explained by this model. The determination coeficient R2 is understood as ratio of the explained variability to the total varialility. The R2 is a number from interval <0, 1> ; and the situation is optimal when this number is high. Presenting this ratio in percents we answer the question of what percentage of the variability Y is explained by the variability X. Computer calculated coeficient of linear determination is also expressed by the equation (3) below, as a measure corrected by the number of degrees of freedom, namely 33:
( )
2 2
.
1
1 1
1
corr
n
R R
n k
− =
− −− − (3)
where: n- size of the group,
k- number of variables, including the free term The determination coeficient corr. R2 amounts to 0.88. The complete model presented here comprises three variables plus the free term only, having signiicance level of p < α = 0.05. Other members are variables having insigniicant inluence, which did not fulill the signiicance condition (p<α=0.05). The signiicance level α is equal to predetermined by us allowable probalibility error, consisting in the fact that we accept obtained result as the true one. In many areas of the research work the value of α=0,05 is accepted as typical limiting value of the signiicance level. When value p obtained from the test is below this value, the result is assessed as statistically signiicant. The analysis of variance conirms that from the general sum of squares of the variable R0,2 only 8% of variability can not be explained by regression, whereas statistical signiicance of the independent variables having effect on the dependent variable R0,2 is fulilled at the level of p = 0.00002 (Fobl > F(α;df1;df2) (Fobl = 21.83 > F(0,05;6;11) = 3.09).
Test of signiicance of the Fobl model according to scheme of the proceeding presented in the Table 2 constructed as quotient of mean WSK/RSK, serves to assessment of an effect of the independent variable on the dependent variable Fobl>Fkr where Fkr=F(α,df1,df2). It’s theoretical distribution has form of the Fisher-Snedecor’s distribution 34.
In the complete model, there are present also variables with insigniicant inluence, which undergo elimination. The analysis was terminated after elimination of three variables: temperature variables - t1, t3 and voltage variable - U3.
The model reduced to value of the yield strength R0,2 and represented by the equation (4) comprises ive variables (inclusive of the free term), complying with condition of the signiicance (p < α = 0.05).
R0,2 = 330.2 - 0.36t2 - 7.08U1 + 7.58U2 ± 2.35 [MPa] (4)
The determination coeficient R2 was reduced with respect to the complete model (difference in value of -0.03) and it amounts to 0.89. The corrected coeficient R2 amounts to
Fig. 3. Curves from the ATND method with marked characteristic
points for the investigated alloy: a) complete run of the crystallization
process, b) magniication of the marked area [26]
Table 2. ANOVA table
Source of variability Sums of square
deviations
Number of degrees of
freedom Mean square deviations F test of signiicance
Explained by regression WSK df1 = k-1 WSK/(k-1) / ( )
/ ( )
WSK k 1
RSK n k
− −
Remainders RSK df2 = n-k RSK/(n-k)
0.87 (change of the value is equal to -0.01) and it constitutes a comparative measure for the models with different number of variables. It means, that the obtained model is correct, and four variables were introduced to the model (together with the free term), reducing its structure.
The analysis of variance conirms statistical signiicance of the aggregate effect of the inluence of the independent variables on the dependent variable at residual critical level of p = 0.00002 < ∝ = 0.05 - Fobl > F(α;df1;df2) (Fobl = 29.42 > F(0,05;4;13) = 3.34). The total inluence is not only signiicant, but also very strong.
The Fig. 4 presents how the values of the yield strength R0,2 are shaped, both the predicted and observed (from the test) ones.
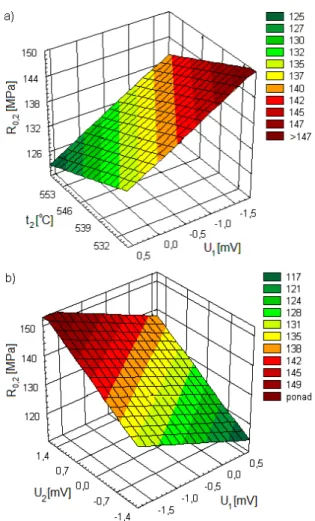
To compare the effect of changes of the characteristic points values on the yield strength R0,2, these values were plotted on spatial diagrams representing character of their inluence on the dependent variable (Fig. 5). Average values obtained from the measurement (assumed values of constant points) of the characteristic points of the reined and modiied AlSi13Cu2Fe alloy were used to plot the diagrams.
Increase of the yield strength R0,2 is connected mainly with change of the voltage in the points U1 and U2, and to a smaller extent, with decrease of the temperature t2.
3.2. Hardness HB 10/1000/30
Hardness of the alloy after the modiication ranged from 73.5 to 89 HB 10/1000/30. The complete model for the value HB 10/1000/30 is represented by the equation (5).
HB = -34 + 0.04t1 + 0.66t2 - 0.51t3 + 0.61U1 + 1.8U2 + 2.58U3 ± 1.61 (5)
In spite of presence of only two variables with a satisfactory level of signiicance in the equation (5), a high determination coeficient R2 = 0.95 was obtained, which means that as many as 95% of total variability of the HB was explained by the model. The corrected determination coeficient, corr. R2 amounts to 0.92. Statistic signiicance of the effect of inluence of the independent variables on the dependent variable HB is fulilled at p = 0.000001 < α = 0.05 (Fobl > F(α;df1;df2) (Fobl = 36.23 > F(0,05;6;11) = 3.09).
Elimination of the variables with insigniicant inluence was terminated after removal of two variables. Reduced
model for the hardness HB 10/1000/30 was represented by the equation (6).
HB = -38.6 + 0.78t2 - 0.58t3 + 2.85U2 + 3.62U3 ± 1.63 (6)
Performed elimination of the variables with insigniicant inluence did not have any considerable effect on changes
Fig. 4. Diagram of predicted and observed values for the variable R0,2
Fig. 5. Effect of change of values of characteristic points: a) t2, U2,
and b) U2, U1 on the yield strength R0,2
of the determination coeficient R2 (change with - 0.01). The coeficient corr. R2 remained unchanged. In the equation (6) there are present ive variables (together with the free term), from which only the free term exceeded critical level of signiicance ∝ = 0.05. The analysis of variance conirms that only 6% of the variability cannot be explained by regression. Moreover, it has been conirmed signiicant inluence of the independent variables on the dependent variable HB at residual critical level p = 0.000001 < α = 0.05 (Fobl > F(α;df1;df2) (Fobl = 52.5 > F(0,05;4;13) = 3.17).
The Fig. 6 presents a system of predicted and observed values of the dependent variable HB 10/1000/30.
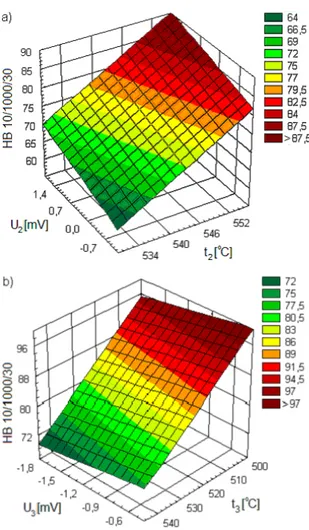
To ilustrate how individual variables inluence on change of the hardness HB 10/1000/30, in the Fig. 7 in form of spatial diagram are shown direction and ‘intensity’ of inluence of the temperature and the voltage variables.
Increase of the tempearture t2 and decrease of the temperature t3 result in the increased hardness HB 10/1000/30.
4. Conclusions
Obtained results of the research have confirmed correlation between values of temperature and voltage of the characteristic points seen on the curves from the ATND method and the mechanical properties (yield strength R0,2 and HB 10/100/30 hardness) of the AlSi13Cu2Fe alloy modiied with strontium.
The obtained dependencies (4 and 6) enable prediction of the mechanical properties of the investigated alloy under laboratory conditions at signiicance level of α = 0.05, which allows quick quality control of the alloy as early as at its preparation stage.
Fig. 7. Effect of change of values of characteristic points:
a) U2, t2 and b) U3, t3 on the hardness HB 10/1000/30
5. References
1. Closset B, Gruzleski JE. Structure and properties of hypoeutectic
Al-Si-Mg alloys modified with pure strontium. Metallurgical
Transactions A. 1982;13(6):945-951.DOI 10.1007/BF02643389
2. Liao H, Sun Y, Sun G. Correlation between mechanical
properties and amount of dendritic α-Al phase in as-cast near-eutectic Al-11.6% Si alloys modified with strontium. Materials
Science and Engineering A. 2002; 335(1-2):62-66. doi:10.1016/
S0921-5093(01)01949-9
3. Shabestari SG, Shahri F. Influence of modification, solidification conditions and heat treatment on the microstructure and mechanical properties of A356 aluminum alloy. Journal of
Materials Science. 2004; 39(6):2023-2032.
4. Mallapur DG, Udupa KR, Kori SA. Influence of grain refiner
and modifier on the microstructure and mechanical properties of A356 alloy. International Journal of Engineering Science
and Technology. 2010;2(9):4487-4493.
5. Hegde S, Prabhu KN. Modification of eutectic silicon in Al–Si
alloy. Journal of Materials Science. 2008;43(9):3009-3027. DOI 10.1007/s10853-008-2505-5
6. Rodrıguez SH, Goytia-Reys RE, Dwivedi DK, Baltazar-Hernándex VH, Flores-Zuñinga, Pérez-López MJ . On influence of Ti and Sr on microstructure, mechanical properties and quality
index of cast eutectic Al-Si-Mg alloy. Materials & Design. 2011;32(4):1865-1871.
7. Jenkinson DC, Hogan LM. The modification of
aluminium-silicon alloys with strontium. Journal of Crystal Growth. 1975; 28(2):171-187. doi:10.1016/0022- 0248(75)90233-X
8. Fatahalla N, Hafız M, Abdulkhalek M. Effect of microstructure
on the mechanical properties and fracture of commercial hypoeutectic Al-Si Alloy modified with Na, Sb, and Sr.
Journal of Material Science. 1999; 34(14):3555-3564. DOI
10.1023/A:1004626425326
9. Liao H, Dong G, Sun G. Investigation on influence of sodium- or
strontium-modification on corrosion-resistance of Al-11.7%Si
alloy. Journal of Materials Science. 2007; 42(13):415-420.
10. Stunova BB. Strontium As a structure modifier for non-binary Al–Si Alloy. Acta Polytechnica. 2012; 52(4):26-32. https://ojs. cvut.cz/ojs/index.php/ap/article/viewFile/1580/1412
11. Knuutinen A, Nogita K, McDonald SD, Dahle A. K. Modification
of Al–Si alloys with Ba, Ca, Y and Yb. Journal of Light Metals. 2001;1(4):229-240.doi:10.1016/S1471-5317(02)00004-4
12. Sigworth GK, Guzowski MM. Grain refining of hypoeutectic
Al-Si alloys. AFS Transaction. 1985; 93:907-912.
13. Dahle AK, Nogita K, McDonald S, Zindel J, Hogan L. Eutectic
strontium levels. Metallurgical and Materials Transactions A.
2001; 32(4):949-960. DOI 10.1007/s11661-001-0352-y
14. Haque MM, Maleque MA. Effect of process variables on structure
and properties of aluminium-silicon piston alloy. Journal of Materials Processing Technology. 1998;77(1- 3):122-128. doi:10.1016/S0924-0136(97)00409-3
15. Heusler L, Schneider W. Influence of alloying elements on the
thermal analysis results of Al-Si cast alloys. Journal of Light
Metals. 2001; 2(1):17-26. doi:10.1016/S1471-5317(02)00009-3
16. Robles Hernández FC, Sokolowski JH. Thermal analysis and
microscopical characterization of Al–Si hypereutectic alloys.
Journal of Alloys and Compounds. 2006; 419(1-2):180-190.
doi:10.1016/j.jallcom.2005.07.077
17. Lu SZ, Hellawell A. Modification of Al-Si alloys: microstructure, thermal analysis, and mechanisms. JOM. 1995;47(2):38-40. DOI 10.1007/BF03221405
18. Wu RI, Perepezko JH. Liquidus temperature determination in
multicomponent alloys by thermal analysis. Metallurgical and
Materials Transactions A. 2000;31(2):497-501. DOI 10.1007/
s11661-000-0285-x
19. Poniewierski Z. Crystallization, structure and properties of
silumins. Warszawa: WNT; 1989.
20. Klančnik G, Medved J, Mrvar P. Differential thermal analysis
(DTA) and differential scanning calorimetry (DSC) as a method of material investigation. RMZ - Materials and Geoenvironment.
2010;57(1):127-142. http://www.rmz-mg.com/letniki/rmz57/
RMZ57_0127-0142.pdf
21. Jaradeh MM, Calbery T. Solidification studies of 3003 aluminium
alloys with Cu and Zr additions. Journal of Materials Science
& Technology. 2011;27(7):615-627.
doi:10.1016/S1005-0302(11)60116-3
22. Cholewa M, Suchoń J, Kondracki M, Jura D. Method of thermal
derivative gradient analysis (TDGA). Archives of Foundry
Engineering. 2009;9(4):241-245.
23. Dudyk M, Wasilewski P, Ciućka T, Pezda J. Simultaneous
recording of crystallization process of aluminium alloys
with ATD and AED methods. Archives of Metallurgy. 1998; 43(3):321-328.
24. Białobrzeski A, Pezda J. Registration of melting and crystallization
process of ultra-light weight MgLi12,5 alloy with use of ATND method. Archives of Foundry Engineering, 2012;12(2):143-146.
25. Pezda J. Determination through use of ATND method of impact
strength of 359.0 alloy modified with strontium. International
Journal of Computational Engineering Research. 2013;
3(2):82-85.
26. Pezda J. Determination of Rm tensile strength of Al-Si alloys with use of ATND method. Advances in Manufacturing Science
and Technology. 2013;37(1):99-109.
27. Ciućka T. Analysis of Al-Mg casting alloys crystallization with use of “ATND” method. Archives of Foundry Engineering.
2008;8(4):27-30.
28. Ciućka T. Analysis of AlSi9Mg alloy crystallization with use
of ATND method. Advances in Manufacturing Science and
Technology, 2009;33(2):65-70.
29. Pezda J. Assessment of quality of EN AC-43300 alloy with use
of ATND method. Archives of Foundry Engineering, 2013;13(1): 139-142.
http://www.afe.polsl.pl/index.php/pl/3785/assessment-of-quality-of-en-ac-43300-alloy-with-use-of-atnd-method.pdf 30. Pezda J. Optimization of the T6 heat treatment to improve the
mechanical properties of alloy AlSi12CuNiMg. Metal Science
and Heat Treatment. 2015;57(5):286-290.
DOI:10.1007/s11041-015-9876-4
31. PN-EN ISO 6892-1:2010. Metals. Tensile strength. Testing
method in ambient temperature. Warszawa, Polish Committee
for Standardization; 2010.
32. PN-EN ISO 6506-1:2008. Metallic materials - Brinell hardness
test - Part 1: Test method. Warszawa, Polish Committee for
Standardization; 2008.
33. Luszniewicz A, Słaby T. Statistics with the Statistica PL computer
package - Theory and usage. Warszawa: C.H. Beck; 2001.
34. Ostasiewicz S, Rusnak Z, Siedlecka U. Statistics - elements
of theory and problems. Wroclaw: Wydawnictwo Akademii