Corresponding Author: Carlos Alberto Silva de Lima
10.1590/S1517-707620150001.0021
Received on: 11/09/2014 Accepted on: 29/09/2014
Determination of non-isothermal crystallization
rate constant of a rotational
molding grade LLDPE
Carlos Alberto Silva de Lima1, Marcel Andrey de Goes 2, Luís Antonio Pinheiro 3, Benjamim de Melo Carvalho 4
1,2 Graduate Program in Materials Science and Engineering – State University of Ponta Grossa - UEPG e-mail: [email protected]; [email protected]
3,4 Materials Engineering Department – UEPG, Av.Carlos Cavalcanti 4748, Uvaranas, CEP 84030-900, Ponta Grossa -PR. e-mail: [email protected] [email protected]
ABSTRACT
The purpose of the present paper was to test the validity of the nonlinear regression method for calculating the non-isothermal crystallization rate constant of the Nakamura’s model of a rotational molding grade
LLDPE directly from non-isothermal crystallization experiments carried out in a single cell DSC. Cooling rates of 50, 40, 30, 20, 10 and 5 oC/min were used with samples of 3.0 mg under nitrogen atmosphere. Here, good agreement was observed between the experimental relative crystallinity curves and the simulated ones using the calculated parameters by nonlinear regression. It shows that this method can be used to determine
the Nakamura’s non isothermal rate constant for using in simulation of the cooling phase of rotational mol d-ing. In this paper it was used 10-3, 10-4 and 10-14 as the initial crystallinity in the Nakamura’s model. How-ever the best average results for all cooling rates was obtained when 10-4 was used. Average spherulitic di-mensions of LLDPE studied in this paper did not change significantly with different cooling conditions.
Keywords: Nonlinear regression method, non-isothermal crystallization, Nakamura’s model, linear low
density polyethylene, rotational molding.
1. INTRODUCTION
One of the difficulties for incorporation of the crystallization phenomenon in softwares for simulation of pol-ymer processing is the necessity of easy and reliable methods for determining the parameters of a given ki-netic model chosen to describe the crystallization process.
The nonlinear regression method can be used for obtaining the parameters of kinetic crystallization
models, such as Nakamura’s [1,2], Kamal and Chu’s [3], Dietz [4] and Malkin’s [5], directly from the non-isothermal crystallization data obtained by Differential Scanning Calorimeters. Results of this method are usually considered good. However, literature mentions unsatisfactory results related to nonlinear regression, but this behavior is more likely associated to limitations of the crystallization model in describing the non-isothermal crystallization process of the polymer than by the nonlinear regression method itself [4,7]. One advantage of nonlinear regression is that its procedure for calculating the crystallization kinetic constant is faster than the master curve approach [8].
The rotational molding is highly dependent on the raw material and it could not exist without ade-quate polymers for typical conditions of this process. To be rotomolded, a polymer must have heat resistance in order to avoid chemical oxidative degradation due to long residence time in the oven. The most common material used in the process is polyethylene (PE), and in this class stands Linear Low Density Polyethylene (LLDPE) [9]. This polymer is semicrystalline and its crystallization during the cooling phase of rotational molding affects both properties and processing conditions.
Therefore, the purpose of the present study was to test the validity of the nonlinear regression meth-od for calculating the non-isothermal crystallization rate constant of the Nakamura’s model of a rotational
LIMA, C. A.S.; GOES, M. A.; PINHEIRO, L. A.; CARVALHO, B. M. revista Matéria, v.20, n.1, pp. 203 – 211, 2015.
204 Hot Stage-DSC. This equipment reaches controlled cooling rates up to 100 °C/min and allows the in-situ recording of the developed crystalline microstructure during cooling. Therefore, it is an interesting alternative for studying non-isothermal crystallization process of polymers.
2. MATERIALS AND METHODS
Materials
A specific Linear low density polyethylene (LLDPE) to be used in rotational molding process was used in this study. This polymer, kindly supplied by Braskem S.A, has melting point of 125 °C and melt flow index equal to 4.2g/10min [9].
Methods
A Differential Scanning Calorimeter DSC 600 Hot Stage from Linkam was used to study the non-isothermal crystallization kinetics of LLDPE. About 3.0 mg of the material, sealed in an aluminum pan, was heated to 200°C and held at this temperature for 5 minutes before cooling at different rates (50, 40, 30, 20, 10 and 5 °C/min) to 30°C under nitrogen atmosphere. According the procedure recommended by Isayev et al. [10-12] the experiments were carried out with the same sample for all the six cooling rates in order to obtain good repeatability for the heat transfer conditions between DSC furnace and the aluminum pan.
The normal procedure for obtaining the non-isothermal crystallization rate constant was applied using the experimental data. Therefore, it was necessary to define the temperature of the onset of
crystalliza-tion for each cooling rate. The relative crystallinity (θ) vs. temperature curve was determined (as well as the corresponding θ vs. time curve) for each cooling rate by partial area calculation in the experimental DSC curve. In this way, the experimental derivative curve dθ/dt vs. temperature was obtained.
Nonlinear regression method was used to obtain the parameters (1/t1/2)0 and Kg in equation 1 by fit-ting the differential form of Nakamura’s model, given by equation 2, to the experimental dθ/dt vs. T:
(1)
(2)
where (1/t1/2)0 is a pre-exponential factor that includes all terms independent of temperature; U is the activa-tion energy for the transport of crystallizing units across the phase boundary; Kg is the nucleaactiva-tion exponent; T∞ = Tg – 30 K is the temperature below which molecular transport ceases; R is the universal gas constant;
ΔT=Tm0-T is the degree of supercooling, f=2T/(Tm0+T) is a correction factor accounting for the reduction in the latent heat of fusion as the temperature is decreased, and Tm0 is the equilibrium melting temperature.
3. RESULTS AND DISCUSSION
205
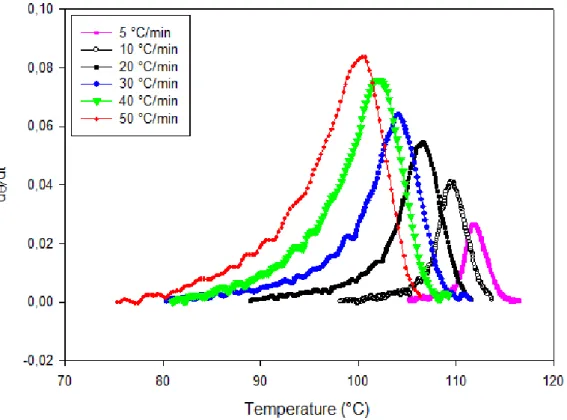
Figure 1: Crystallization rates dθ/dt as a function of temperature for LLDPE sample cooled at different cooling rates.
As expected, higher cooling rates led to larger and broader peaks and lower onset and peak tempera-tures, as well as higher crystallization rates. The non-isothermal crystallization data was used to obtain the parameters Kg and (1/t1/2)0 by nonlinear regression method. Table 1 shows that the Kg obtained from the nonlinear regression are different for all six cooling rates. The (1/t1/2)0 for the six cooling conditions are dif-ferent too, mainly for 50 °C/min. For this last cooling rate, the kinetic parameters are much higher than for the other cooling conditions. Using the calculated K(T) and assuming n equal to 3, the differential form of the Nakamura equation, given by Equation 2, could be used to simulate the dθ/dt vs. T curves, which are in-tegrated to obtain the θ vs. T curves. These simulated data were compared to the experimental ones to check the quality of the kinetic parameters calculated by non-linear regression.
Table 1: Crystallization kinetic parameters of LLDPE obtained by the nonlinear regression.
Cooling Rate (1/t1/2)0 (s-1) Kg (K2)
5 °C/min 1,65 2,49x10⁻⁵
10 °C/min 1,46 9,9x10⁻⁷
20 °C/min 1,13 4,4x10⁻⁷
30 °C/min 0,98 4,5x10⁻⁸
40 °C/min 0,75 2,2x10⁻⁸
50 °C/min 15,38 4,1x10⁴
LIMA, C. A.S.; GOES, M. A.; PINHEIRO, L. A.; CARVALHO, B. M. revista Matéria, v.20, n.1, pp. 203 – 211, 2015.
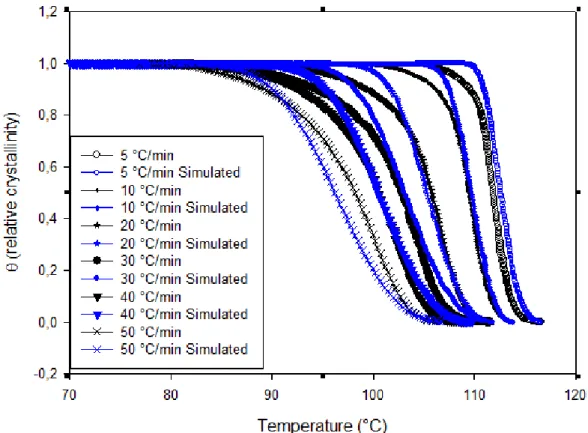
206 Fig. 4 shows all curves of relative crystallinity as a function of temperature. In general, simulated curves presented good agreement with experimental ones (mainly at intermediate rates of 40, 30, 20 and 10 °C/min). In each case, the major divergence between experimental and simulated curves appears at the final stages of the crystallization process. It is not an unexpected behavior once Nakamura’s model usually has
difficulties to describe the end of crystallization process [6].
The differential form of the Nakamura’s Model, equation 2, shows that for θ equal to zero, the rate of crystallization dθ/dt is zero. In this case, a negligible θt = 0 must be used in equation 2 to obtain the simulat-ed curves, albeit different from zero. Otherwise, (dθ/dt)t = 0 will be zero and θt + Δt will always be zero, as clearly demonstrated by Galera et al [8]. They showed that θt = 0 equal to 10-3 was a good value to be used instead of 10-14 suggested by Chan [10]. Therefore in the present study it was tested 10-3, 10-4 and 10-14 as the initial crystallinity in the Nakamura’s model. However the best average results for the set of cooling rates was obtained when 10-4 was used as the initial relative crystallinity and this value was applied for calculating the simulated curves shown in Figures 2, 3 and 4.
As mentioned by Galera et al [8], the Nakamura’s Model presents an extremely slow initial crysta l-lization rate. Therefore, in the initial stages of crystall-lization, it takes a considerable amount of time to go from θ = 10–14 to θ = 10–3. In this case, the use of θinitial equal to 10–3 or 10-4 is more convenient because it can be used with a Tic (temperature at the beginning of the crystallization process in DSC experiments) that is much easier to define than the one coherent with θ = 10–14.
(A)
207 (C)
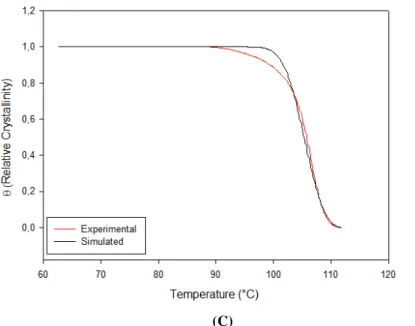
Figure 2: Comparison between experimental and simulated relative crystallinity curves as a function of temperature
gen-erated by the Nakamura’s model: (A) 5 °C/min; (B) 10 °C/min and (C) 20 °C/min.
(A)
LIMA, C. A.S.; GOES, M. A.; PINHEIRO, L. A.; CARVALHO, B. M. revista Matéria, v.20, n.1, pp. 203 – 211, 2015.
208 (C)
Figure 3: Comparison between experimental and simulated relative crystallinity curves as a function of temperature
gen-erated by the Nakamura’s model: (A) 30 °C/min; (B) 40 °C/min and (C) 50 °C/min.
Figure 4: Comparison between experimental and simulated relative crystallinity curves for all cooling rates.
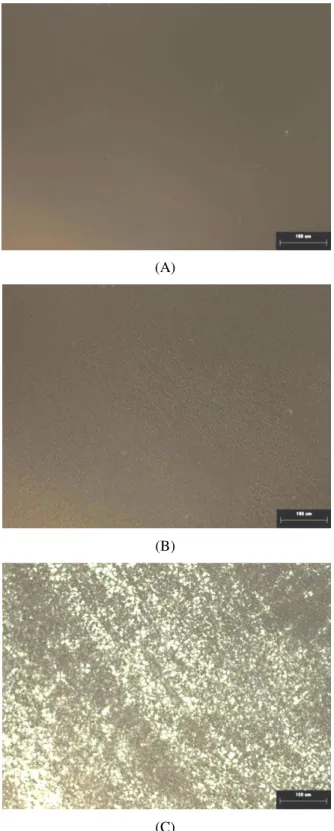
209 microscope and due to the small crystalline structures developed in this sample. However, an increase in the depolarized light intensity (not shown here) also confirmed that the crystallization process had already started at 107 oC. The final crystalline morphology for this sample cooled at 30oC/min is shown in Figure 5C.
Figure 6 shows the morphology at 30 oC for LLDPE cooled at 5 oC/min from the melt state. It is possible to observe that nucleation density is still high and the average spherulitic size did not increase signif-icantly when compared to that developed under cooling of 30 oC/min, as shown on Figure 5C.
(A)
(B)
LIMA, C. A.S.; GOES, M. A.; PINHEIRO, L. A.; CARVALHO, B. M. revista Matéria, v.20, n.1, pp. 203 – 211, 2015.
210
Figure 5: Development of microstructure of LLDPE for the cooling rate of 30 ° C/ min at: (A) 133 ° C; (B) 107 ° C and
(C) 30 ° C.
Figure 6: Microstructure at 30 ° C for LLDPE cooled at of 5 °C/min.
4. CONCLUSIONS
A good agreement was obtained between the experimental and simulated relative crystallinity curves using calculated parameters by nonlinear regression. It shows that this method can be used to determine the
Naka-mura’s non isothermal rate constant for using in simulation of the cooling phase of rotational molding. In the present work it was tested 10-3, 10-4 and 10-14 as the initial crystallinity in the Nakamura’s model. However the best average results for the set of cooling rates was obtained when 10-4 was used. For the grade of LLDPE used in the present work spherulitic dimensions did not change significantly with different cooling condi-tions. The single cell Hot Stage-DSC used in this paper showed to be an interesting alternative for studying non-isothermal crystallization process of polymers.
5. ACKNOWLEDGMENTS
The authors would like to thank Braskem S.A. by supplying the LLDPE and Fundação Araucária and CAPES for the financial support.
6. BIBLIOGRAPHY
[1] NAKAMURA, K., KATAYAMA, K., AMANO, T. “Some aspects of nonisothermal crystallization of polymers. II. Consideration of the isokinetic condition”, Journal of Applied Polymer Science, v.17, n.4,
pp.1031-1041, April. 1973.
[2] PATEL, R.M, SPRUIELL, L.J.E. “Crystallization kinetics during polymer processing: analysis of availa-ble approaches for process modeling”,Polymer Engineering and Science, v. 31, n.10, pp.730-738. May. 1991.
[3] PÉREZ, C. J., ALVAREZ, V.A., STEFANI, P. M., et al., “Non-isothermal crystallization of materbi-z/clay nanocomposites”,Journal of Thermal Analysis, v.88, n.3, pp. 825-832, July. 2007.
[4] ALVAREZ, V. A., STEFANI, P.M., VÁZQUEZ, A. “Non-isothermal crystallization of polyvinylalcohol-co-ethylene”, Journal of Thermal Analysis, v. 79, n.1, pp.187-193, Feb. 2005.
[5] FRIEDL, C.F., MCCAFFEREY, N.J. “Crystallization prediction in injection molding”, In: SPE ANTEC Technical Papers, pp.330-332, Montreal, May. 1991.
[6] CARVALHO, B., BRETAS, R.E.S., “Crystallization kinetics of a PEEK/LCP blend”, J. Appl. Polym. Sci.,
v.55, n.2, p.233. Jan. 1995.
[7] MUBARAK, Y, HARKIN-JONES, EMA, MARTIN, P. J, et al., “Modeling of non-isothermal crystalliza-tion kinetics of isotactic polypropylene”, Polymer, v.42, n.7, pp.3171-3182, March. 2001.
[8] GALERA, V. V., LUCAS, A.L., CARVALHO, B. M., “Determination of Non-Isothermal Crystallization Rate Constant for Pseudo-Experimental Calorimetric Data”, Materials Research, v.12, n.2, pp. 151-157, June.
211 [9] COMISSO, T. B., LIMA, C.A.S., CARVALHO, B. M., “Estudo Experimental do Processo de Rotomol-dagem de PELBD: Efeitos sobre a Morfologia e Estabilidade Dimensional”, Polímeros, v.23, n.1, pp. 97-107, Feb. 2013.
[10] CHAN, T.V., SHYU, G.D., ISAYEV A.I. “Master curve approach to polymer crystallization kinetics”,
Polymer Engineering and Science, v.35, n.9, pp.733-740, May. 1995.
[11] CARVALHO, B. M, BRETAS R. E. S. “Determinação da constante cinética de cristalização não iso-térmica de polipropilenos modificados com ácido acrílico e anidrido maleico”, Polímeros, v.16, n.4,
pp.305-311, October. 2006.
[12] MARINELLI, A. L, CARVALHO, B. M, BRETAS, R.E.S. “Evaluation of the master curve approach for the non-isothermal crystallization of PP/EPR”, UEPG Ciências Exatas e da Terra, Ciências Agrárias e