Modelling and Optimization for Heat Treatment of Al-Si-Mg Alloy Prepared by Indirect
Squeeze Casting Based on Response Surface Methodology
Liwen Chena, Yuhong Zhaoa*, Zhiqin Wena, Jinzhong Tiana, Hua Houa
Received: March 18, 2017; Revised: June 05, 2017; Accepted: June 20, 2017
The purpose of the present study is to model and analyze heat treatment process of Al-Si-Mg alloy
prepared by indirect squeeze casting. The combined efects of whole heat treatment process, including
solution treatment temperature, solution treatment time, ageing temperature and ageing time, on Vickers
hardness, were investigated. The non-linear mathematical model has been developed through Box-Behnken design based on response surface methodology. The results of ANOVA tests have proven the model is capable of making accurate predictions and statistically adequate. The signiicance tests show all four process parameters signiicantly afect response value and the relationship might be non-linear in nature. The dimensional response surface and matching contour plots are drawn, establishing an evaluation of the interaction efects of process parameters. The optimum heat treatment process is found
as solution treatment temperature of 540.28ºC, solution treatment time of 7.55h, ageing temperature of 174.23ºC, and ageing time of 8.61h.
Keywords: Al-Si-Mg alloy, Response surface methodology, Indirect squeeze casting, HV
* e-mail: [email protected]
1. Introduction
In recent years, there is a large demand for lightweight components with high mechanical capacity. The density
of aluminum is one-third of the steel or cast iron, and the
trend is to substitute cast iron components with aluminum
components produced by squeeze casting. Squeeze casting (SC) is an advanced special casting technique that the molten
metal is illed into the mold slowly and solidiied under
high-pressure. The applied pressure in squeeze casting leads to an obvious decrease of the secondary dendrite arm spacing and
disappearance of micro-porosity in the casting, which are the
main reasons for the improvement of mechanical properties1.
Due to the low porosity rate in the squeeze casting parts, heat treatment can be applied, which can further improve the
mechanical performance2. The heat treatment of Al-Si-Mg
alloys prepared by squeeze casting involves the following
procedures: solution treatment, quenching, and ageing. Solution treatment involves soaking at a relatively high temperature to the dissolution of Mg-rich particles generated
during the stage of solidiication and redistribution of solute
atoms to achieve a homogeneous and high concentration
of alloying elements in matrices. The maximum solution
treatment temperature decided by the alloy composition is as
close to the eutectic temperature as possible while avoiding
incipient melting of phases. Mg-containing phases formed
during solidiication are Mg2Si and the π-Al8Mg3FeSi6
phase. Dissolution and homogenization of Mg2Si particles are a fast process3. Rometsch et al.4 found that dissolution
of the Mg2Si phase was completed within 2-4 minute and
homogenization was inished within 8-15 minute in the A356 alloy. The particles of π-Al8Mg3FeSi6 phase are hard to
dissolve and they can transform into β-Al5FeSi phase while
reducing the Mg concentration in the alloy (0.3-0.4wt.%). The β-Al5FeSi phase particles fragment and gradually dissolve
at a high temperature with a long time5-7. Another efect
of solution treatment is spheroidization of eutectic silicon particles. According to Shivkumar et al.8, the optimal time
for a sand-cast Sr-modiied A356 alloy is 3-6h at 540 ºC. The time can be further reduced if the microstructure is iner9.
Quenching is able to form supersaturated solid solution including a great number of vacancies from the high solution treatment temperature to room temperature. Seifeddine et al. and Emadi et al.10,11 found the efect of quench rate and
Mg concentration on mechanical properties was signiicant.
The purpose of ageing treatment is to obtain uniform distribution of precipitates. For Al-Si-Mg alloys, the
precipitation sequence begins with the formation of spherical GP zones which is formed from an enrichment of Si and
Mg atoms. Then the GP zones develop into needle-shaped
coherent β″ phase. The coherent β″ phase grows to semi-coherent β′ phase and ultimately non-semi-coherent β phase12. If
artiicial ageing temperatures with the range of 170-200ºC
are applied, comparable strength levels can be achieved. If a relatively high temperature is applied the ageing time can be shortened. The time required to peak hardness is
about 10h at 170ºC, while it is only 20minute at 210ºC13,14.
However, a decrease in performance is discovered if the temperature is increased to 210ºC because the β″ phase change to the β′ phase when temperatures over 200ºC15.
1275 Modelling and Optimization for Heat Treatment of Al-Si-Mg Alloy Prepared by Indirect Squeeze Casting
Based on Response Surface Methodology
It is noted that, the efects of diferent heat treatment
process parameters on alloy performance are reported in the
literature widely. However, there is not suicient to consider only one or two parameters. It is of vital importance to take the whole heat treatment process into consideration in order
to achieve the optimal performance of Al-Si-Mg alloy.
Orthogonal array designs are commonly used for experiments but limited in number and may fail to test all interaction efect of the process variables under investigation16.
Many experimental investigations have been conducted using a two-level factorial design for studying the inluence of heat treatment on mechanical properties. However, with this
approach, it is possible to develop only linear input-output relationships. For investigating the nonlinearity of output characteristics, each factor is required at least three levels17.
The number of experiments increases with the increase in
number of parameters and their levels (Refer equation (1))
Number of experiments = ( Levels )^Factors phantom
a phantom a phantom a( 1 )
Number of experiments
=(
Levels
)
Factors(
1
)
RSM is the regression analysis probing the relationships
between one or more response variables and several explanatory
variables. The essential of RSM is that establishing an
approximate mathematical model to replace a complex one
based on results estimated at various points in the design space18.
The purpose of the present study is to develop Vickers hardness (HV) prediction model for heat treatment of indirect squeeze casting Al-Si-Mg alloy. The factors studied are solution treatment temperature, solution treatment time, ageing temperature and ageing time. The Vickers hardness is
the response studied and design of experiments is established through RSM based on BBD.
2. Experimental Procedure
2.1 Materials and equipment
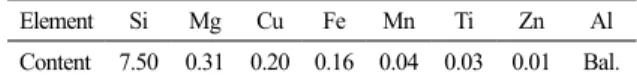
The raw material used in the present study was an
Al-Si-Mg alloy. The alloy composition, measured using an optical
emission spectrometer, is shown in Table 1.
Table 1. Nominal composition of Al-Si-Mg alloy used in this study (wt%)
Element Si Mg Cu Fe Mn Ti Zn Al
Content 7.50 0.31 0.20 0.16 0.04 0.03 0.01 Bal.
Multifunctional squeeze casting machine was applied
on purpose to manufacture specimens for the study. The
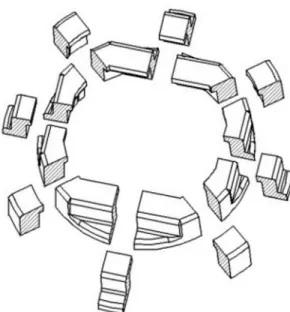
maximum clamping force and maximum plunger injection force are 5000KN and 2000KN respectively. Ring parts castings were fabricated by the machine. The overall dimension of the casting is φ256mm×53mm and the projected area of
mould joint is 26544mm2. The ring parts casting connects
with gating system whichisconsist of sprue, runner and
ingate with the same cross section (as shown in Figure 1).
Figure 1. The structure and gating system of ring parts casting. 1- ring parts casting 2- runner 3- sprue 4- ingate
Alloy was melted in a medium frequency furnace inside a graphite crucible. The die was preheated by resistant heating. The structure of the die is shown in Figure 2. Subsequently, the molten metal was poured into the mould. The pressure was applied directly on the sprue via a plunger and transferred from runner to the solidifying casting. After solidiication, the casting was ejected by ejector plate connected to tie bar which is driven by hydraulic cylinders.
Figure 2. The structure of the die. 1-tie bar; 2- backboard; 3- eject-up-plate; 4- resistant heating hole; 5- ejector plate; 6- movable die core; 7- ixed die; 8- eject-down-plate; 9- rail; 10- movable die
plate; 11- connection guide pin; 12- cavity; 13- resistant heating hole
The melt temperature and the mold temperature were 700ºC
Chen et al.
1276 Materials Research
Specimens of the casting have been taken at eight diferent
locations to heat treatment (see Figure 3). The heat treatment
experiments have been conducted as BBD matrices and two
replicates have been considered for each parameter condition.
Following solution heat treatment, specimens were water quenched for 3 minutes with water temperature of 65ºC, and then the ageing treatment was performed. After heat treatment, the Vickers hardness of Specimens were measured at ten diferent location which made a cross at the point. To reduce the variation, an average of 20 diferent values was
taken for each parameter condition.
The term, α0, αi, αii and αij are the coeicients of the
regression equations and are computed using the least square
method. Where α0 is constant, αi, αii and αij represent the
coeicients of linear, quadratic and cross product terms,
respectively. Xi represents the coded variables which correspond
to the studied process parameters. The coded variables Xi,
i=1,2,3,4 are calculated from the next transformation equations:
Figure 3. Sampling schematic
2.2 Response surface methodology
In order to study the efect of heat treatment on the
Vickers hardness, four principal parameters, including solution treatment temperature (Ts), solution treatment time (ts), ageing temperature (Ta) and ageing time (ta), are
speciied as heat treatment process parameters. The desired
response is the HV which is assumed to be inluenced by
the above four parameters.
In the RSM, The general form describing Y (response)
expressed as a function of process variables (Ts, ts, Ta and
ta) is shown below:
Y=F( T_S,t_S,T_a,T_a ) phantom a phantom a ( 2 )
Y
=
F
(
T
S,t
S,T
a,T
a) (
2
)
Where F is the response function and Y is the desired
response value. The approximation of Y is devised using the itted second-order polynomial regression model which is
named the quadratic model. The quadratic model of response
value can be transformed as follows19:
Y= %alfa _0+ sum from{i=1} to{4} %alfa _i X_i+ sum
from{i=1} to{4} %alfa _ii X_i^2+sum from{i<j}
to{4} %alfa _ij X_i X_j phantom a phantom a ( 3)
Y
=α
0+
∑
i=1 4
α
iX
i+
∑
i=1 4α
iiX
i2
+
∑
i<j4
α
ijX
iX
j(
3
)
X_1= {T_S-T_S0} over { %DELTA T_S } phantom a
phantom a ( 4)
X
1=
T
S−
T
S0Δ
T
S(
4
)
X_2= {t_S-t_S0} over { %DELTA t_S } phantom a
phantom a ( 5)
X
2=
t
S−
t
S0Δ
t
S(
5
)
X_3= {T_a-T_a0} over { %DELTA T_a } phantom a
phantom a ( 6)
X
3=
T
a−
T
a0Δ
T
a(
6
)
X_4= {t_a-t_a0} over { %DELTA t_a } phantom a
phantom a ( 7)
X
4=
t
a−
t
a0Δ
t
a(
7
)
X1, X2, X3 and X4 are the coded values of process parameters
Ts, ts, Ta and ta, respectively. Ts0, ts0, Ta0 and ta0 are the values of Ts, ts, Ta and ta at the center level. ∆Ts, ∆ts, ∆Ta and ∆ta
are the intervals of variation in Ts, ts, Ta and ta, respectively.
BBD consisting of 30 experiments was conducted for
developing the regression model for HV. The input parameters
and their levels used for this work are given in Table 2. The experimental levels for each variable were selected based on results of preliminary experiments and literature values.
Table 2. Input parameters and their levels S.no. Parameter Low level
(-1)
Center level (0)
High level (1)
1 Ts (ºC) 510 530 550
2 ts (h) 5 7 9
3 Ta (ºC) 150 170 190
4 ta (h) 6 8 10
3. Results and Discussion
The experimental results of HV with designed matrix are shown in Table 3. The non-linear mathematical model based on BBD has been developed for the response surface HV with the process parameters set at three levels. Signiicance and ANOVA tests have been carried out to check the statistical
adequacy of the models.
3.1 Statistical analysis and develop of prediction
model
Summary table of ANOVA is established to summarize the test of the prediction model. As is shown in Table 4,
1277 Modelling and Optimization for Heat Treatment of Al-Si-Mg Alloy Prepared by Indirect Squeeze Casting
Based on Response Surface Methodology
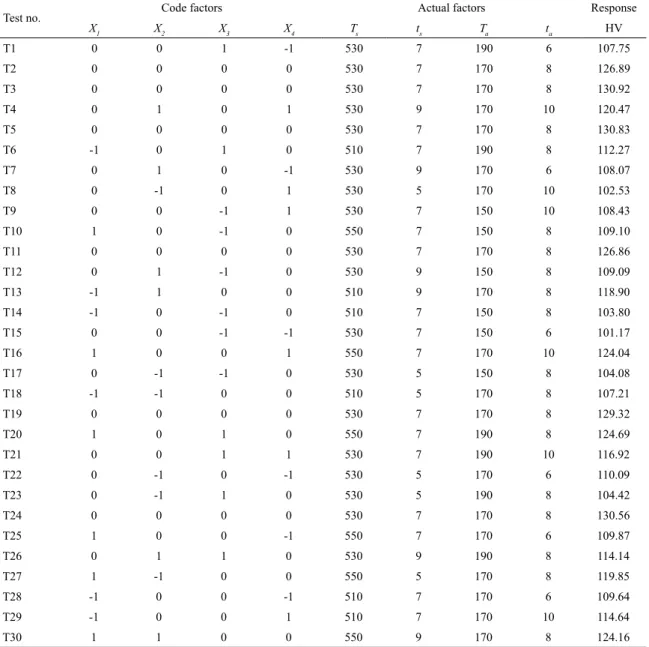
Table 3. Design matrix and experimental results
Test no. Code factors Actual factors Response
X1 X2 X3 X4 Ts ts Ta ta HV
T1 0 0 1 -1 530 7 190 6 107.75
T2 0 0 0 0 530 7 170 8 126.89
T3 0 0 0 0 530 7 170 8 130.92
T4 0 1 0 1 530 9 170 10 120.47
T5 0 0 0 0 530 7 170 8 130.83
T6 -1 0 1 0 510 7 190 8 112.27
T7 0 1 0 -1 530 9 170 6 108.07
T8 0 -1 0 1 530 5 170 10 102.53
T9 0 0 -1 1 530 7 150 10 108.43
T10 1 0 -1 0 550 7 150 8 109.10
T11 0 0 0 0 530 7 170 8 126.86
T12 0 1 -1 0 530 9 150 8 109.09
T13 -1 1 0 0 510 9 170 8 118.90
T14 -1 0 -1 0 510 7 150 8 103.80
T15 0 0 -1 -1 530 7 150 6 101.17
T16 1 0 0 1 550 7 170 10 124.04
T17 0 -1 -1 0 530 5 150 8 104.08
T18 -1 -1 0 0 510 5 170 8 107.21
T19 0 0 0 0 530 7 170 8 129.32
T20 1 0 1 0 550 7 190 8 124.69
T21 0 0 1 1 530 7 190 10 116.92
T22 0 -1 0 -1 530 5 170 6 110.09
T23 0 -1 1 0 530 5 190 8 104.42
T24 0 0 0 0 530 7 170 8 130.56
T25 1 0 0 -1 550 7 170 6 109.87
T26 0 1 1 0 530 9 190 8 114.14
T27 1 -1 0 0 550 5 170 8 119.85
T28 -1 0 0 -1 510 7 170 6 109.64
T29 -1 0 0 1 510 7 170 10 114.64
T30 1 1 0 0 550 9 170 8 124.16
the model F-value is 22.69, which indicates the model is statistically signiicant. There is only 0.01% chance that
the”Model F-Value” could occur due to noise. The “Lack of
Fit F-value” of 2.74 implies the Lack of Fit is not signiicant relative to the pure error, which is desirable. The coeicient of variation is 2.44%, which clearly indicates the deviations between predicted and experimental values are small. Moreover, the model shows a high degree of precision and has a high degree of reliability in conducted experiments. For a well itted model, the coeicient of determination
(R2) should not less than 80 %. A larger value of R2 close
to unity shows that the mathematical model is suitable for itting the actual data. However, a higher value of R2 does
not mean the regression model is good, as R2 increase when
variables are added. R2
adj is often to be used in testing the it
of a regression model. The value of R2= 0.9549 indicates
that 95.49% of the total variations can be explained by the
regression model. The value of the R2
Adj= 0.9128 shows
that 91.28% of the total variations can be explained by the regression model when considering the signiicant factors, which indicated the prediction model had an adequate approximation to the actual values.
HV is expressed as the nonlinear function of the input process parameters in coded form. The model based on BBD
is represented in Eq. 8. The actual values of the response
Table 4. ANOVA test for prediction model
Source Sum of Squares df Mean Square F Value P-value
Model 2507.89 14 179.13 22.69 < 0.0001
X1 170.63 1 170.63 21.61 0.0003
X2 181.35 1 181.35 22.97 0.0002
X3 165.17 1 165.17 20.92 0.0004
X4 136.28 1 136.28 17.26 0.0008
X1 X2 13.62 1 13.62 1.72 0.2089
X1 X3 12.67 1 12.67 1.61 0.2245
X1 X4 21.02 1 21.02 2.66 0.1236
X2 X3 5.55 1 5.55 0.70 0.4151
X2 X4 99.60 1 99.60 12.61 0.0029
X3 X4 0.91 1 0.91 0.12 0.7387
X1
2 122.84 1 122.84 15.56 0.0013
X22 510.40 1 510.40 64.64 < 0.0001
X3
2 990.93 1 990.93 125.50 < 0.0001
X4
2 658.73 1 658.73 83.43 < 0.0001
Residual 118.44 15 7.90
Lack of Fit 100.15 10 10.02 2.74 0.1388
Pure Error 18.29 5 3.66
Cor Total 2626.33 29
Figure 4. The comparison between predicted and actual value for
Vickers hardness
has been found that the predicted values obtained for the
model have a slight deviation from the ideal line, y=x line. However, the majority of the data points are observed to lie
close to the ideal line.
HV=129.23+
3.77X_1+
3.89X_2+
3.71X_3+ newline newline
3.37X_4
-1.84X_1 X_2
+1.78X_1 X_3
+2.29X_1 X_4 +
1.18X_2 X_3+ phantom a ( 8 ) newline
4.99X_2 X_4+
0.48 X_3
X_44.23X^2_1
-
8.63X^2_2-
12.02X^2_3-9.80X^2_4
HV=129.23+3.77X1+3.89X2+3.71X3+¿
3.37X4−1.84X1X2+1.78X1X3+2.29X1X4+1.18X2X3+ (8) 4.99X2X4+0.48X3X4−4.23X12
−8.63X22
−12.02X32 −9.80X24
The signiicance tests have been carried out for all terms of the itted models. The terms, X1, X2, X3, X4, X2X4, X2
1, X 2
2,
X2 3, X
2
4, are signiicant terms as their P-values are less than
0.05, which makes a signiicant contribution to the response.
In the same way, the terms, X1X2, X1X3, X1X4, X2X3, X3X4,
are insigniicant terms. It is worth stressing that, the square
terms of X2 1, X
2 2, X
2 3 and X
2
4 are observed to have less than
P-values of 0.05, suggesting the relationship between Ts, ts,
Ta and ta with the response HV might be non-linear in nature.
3.2 Efect of heat treatment process parameters
on Vickers hardness
The dimensional response surface and matching contour
plots are drawn, establishing an evaluation of the interaction efects of process parameters. These plots represent the regression function of two process parameters, while the other
variables are kept at the center levels. Response surface plot for the response Vickers hardness is presented in Figure 5. It
is clear form the igure that solution treatment temperature
(Ts), solution treatment time (ts), ageing temperature (Ta) and ageing time (ta) show signiicant contribution towards HV.
The interactions between the variables, solution treatment
temperature (Ts) and solution treatment time (ts), solution treatment temperature (Ts) and ageing temperature (Ta), solution treatment temperature (Ts) and ageing time (ta),
are signiicant.
Referring to Figure 5(a), when the ageing temperature
(Ta) and time (ta) are kept at their center levels, the HV is
drastically increased with increasing both solution treatment
temperature (Ts) and time (Ts). However, the further increase
in solution treatment temperature (Ts) and time (Ts) will
1279 Modelling and Optimization for Heat Treatment of Al-Si-Mg Alloy Prepared by Indirect Squeeze Casting
Based on Response Surface Methodology
Figure 5. Response surface plot
efect on it. This is because the increase of solution treatment
temperature (Ts) and time (Ts) leads to the incipient melting of phases and coarsening of eutectic silicon particles.
Regarding Figure 5(b), if the time of solution treatment (ts) and ageing (ta) are kept at their center levels, the HV increases
with increasing both temperature of solution treatment (Ts) and ageing (Ta) in the beginning. However, further increase
in ageing temperature (Ts) leads to a signiicant decrease
in HV. This means that increasing the ageing temperature (Ts) above about 175 ºC is detrimental, which may result in
overageing and coarsening of precipitates.
In Figure 5(c), for the constant values of solution treatment time (ts) and ageing temperature (Ta), the HV is
increased with increasing ageing time (ta) when the time is less than about 8 hours. But over time, the HV decreases with
increasing ageing time (ta). This can be attributed to either
the coarsening of β″ phase or the substitute of β″ phase to β′ phase when the ageing time exceeds 8 hours.
In Figure 5(d), with the increase in both solution treatment
time (ts) and ageing temperature (Ta), the HV signiicantly increases initially and later decreases with further increasing solution
treatment time (ts) and ageing temperature (Ta). The best HV is
achieved approximately at the middle of the parameter values. Figure 5 (e) and Figure 5 (f) show the same trend with
the above analysis.
3.3 Optimization of heat treatment process
Through above analysis, the response value for HV has an optimal solution. The optimization problem of RSM
can be solved by techniques of sequential approximation optimization (SAO) method. The optimization results of heat treatment process, 131.64HV, are shown in Figure 6.
The optimum process parameters are found to be solution treatment temperature of 540.28ºC, solution treatment time of 7.55h, ageing temperature of 174.23ºC, ageing time of 8.61h.
Figure 6. The optimization results of heat treatment process
3.4 Further experiments
The optimized heat treatment process was taken on the sprue of ring parts casting. The sprue with a diameter of 80mm was sectioned along the radial direction (as shown
in Figure 7). The microstructures of the sprue before and
after heat treatment with diferent distance from the center are shown in Figure 8. The HV of sprue and the secondary
dendrite arm space (SDAS) were measured along the radius. The results are shown in Figure 9.
Figure 7. Sectional view and measuring position
During solution treatment, atoms difuse through the matrix
to reduce the concentration gradient, forming a homogenous solid solution. The time needed for homogenization is
afected by the difusing space inluenced by the quality of
the microstructure measured by SDAS3. The microstructure
Figure 8. Microstructures of the sprue before ((a), (c), (e), (g), (i))
and after ((b), (d), (f), (h), (j)) heat treatment with diferent distance
from the center (a) and (b) 3mm; (c) and (d) 11mm; (e) and (f)
19mm; (g) and (h) 27mm; (i) and (j) 35mm
Figure 9. The HV and SDAS alone the sprue radius
the center due to diferent cooling rate from surface to center when the casting solidiies. The mechanical properties are correlated to the average grain size, which is learned from
Hall-Petch equation. The HV, which is directly correlated to the microstructure, shows the increasing trend with increasing
distance from center both before and after heat treatment. The average HV before heat treatment is 75.6HV. After the heat treatment, average HV reaching 129.3 increases
more than 71%. The percentage error between the predicted and the experimental value of HV is -1.78%. It demonstrates
the developed prediction model is adequate accurate mathematical models.
4. Conclusions
1) The non-linear mathematical model based on BBD
has been developed for the response surface Vickers
hardness. The results of significance and ANOVA tests
have proved the prediction model have an adequate
approximation to the actual values. The significance test shows the relationship between solution treatment
temperature (Ts), solution treatment time (ts), ageing temperature (Ta) and ageing time (ta) with the response
Vickers hardness (HV) might be non-linear in nature. 2) The dimensional response surface and matching
contour plots were drawn, establishing an evaluation
of the interaction effects of process parameters. The
interactions between the variables, solution treatment
temperature (Ts) and solution treatment time (ts), solution treatment temperature (Ts) and ageing temperature (Ta), solution treatment temperature (Ts) and ageing time (ta), are significant. When two process parameters
are kept at their center levels, the HV is increased
with increasing the other variables in the beginning. However, the further increase in process parameters
leads to a significant decrease in HV.
3) The optimum heat treatment process parameters are found to be solution treatment temperature of 540.28ºC, solution treatment time of 7.55h, ageing temperature of 174.23ºC, ageing time of 8.61h. Further
experiments found the HV shows the increasing trend with increasing distance from the center of the cylindrical
sprue both before and after heat treatment. After the heat treatment, average HV reaching 129.3HV increases
more than 71%.
5. Acknowledgments
1281 Modelling and Optimization for Heat Treatment of Al-Si-Mg Alloy Prepared by Indirect Squeeze Casting
Based on Response Surface Methodology
51574206, 51274175), International Cooperation project
of the Ministry of Science and Technology of China
(No.2014DFA50320), The Science and Technology Major Project of Shanxi Province(No.MC2016-06), International Science and technology cooperation project of Shanxi Province(No.2015081041), Research Project Supported by Shanxi Scholarship Council of China, No.2016-Key 2).Transformation of Scientiic and Technological Achievements Special Guide Project of Shanxi Province (No.201604D131029).
6. References
1. Zhang M, Zhang WW, Zhao HD, Zhang DT, Li YY. Efect of
pressure on microstructures and mechanical properties of Al-Cu-based alloy prepared by squeeze casting. Transactions of Nonferrous Metals Society of China. 2007;17(3):496-501. DOI:
10.1016/S1003-6326(07)60122-8
2.Dong PY, Zhao HD, Chen FF, Li JW. Microstructures and
properties of A356-10%SiC particle composite castings at diferent solidiication pressures. Transactions of Nonferrous Metals Society of China. 2013;23(8):2222-2228. DOI: 10.1016/ S1003-6326(13)62721-1
3.Sjölander E, Seifeddine S. The heat treatment of Al-Si-Cu-Mg casting alloys. Journal of Materials Processing Technology.
2010;210(10):1249-1259. DOI: 10.1016/j.jmatprotec. 2010.03.020
4.Rometsch PA, Arnberg L, Zhang DL. Modelling dissolution of Mg2Si and homogenisation in Al-Si-Mg casting alloys. International Journal of Cast Metals Research. 1999;12(1):1-8.
5.Rometsch PA, Schafer GB, Taylor JA. Mass balance characterisation of Al-7Si-Mg alloy microstructures as a function of solution treatment time. International Journal of Cast Metals Research. 2001;14(1):59-69.
6.Alhawari KS, Omar MZ, Ghazali MJ, Salleh MS, Mohammed MN.
Dry sliding wear behaviour of thixoformed hypoeutectic Al-Si-Cu alloy with diferent amounts of magnesium. Composite Interfaces.
2016;23(6):519-531. DOI: 10.1080/09276440.2016.1164496
7.Li DF, Cui CX, Wang X, Wang QZ, Chen C, Liu SQ. Microstructure evolution and enhanced mechanical properties of eutectic Al-Si die cast alloy by combined alloying Mg and La. Materials & Design. 2016;90:820-828. DOI: 10.1016/j.matdes.2015.10.078 8.Shivkumar S, Ricci S, Keller C, Apelian D. Efect of solution
treatment parameters on tensile properties of cast aluminum alloys. Journal of Heat Treating. 1990;8(1):63-70.
9. Yang CL, Li YB, Dang B, Lü HB, Liu F. Efects of cooling rate
on solution heat treatment of as-cast A356 alloy. Transactions of Nonferrous Metals Society of China. 2015;25(10):3189-3196.
DOI: 10.1016/S1003-6326(15)63952-8
10.Chaudhury SK, Apelian D. Efects of Mg and Cu content on quench sensitivity of Al-Si-Mg alloy. International Journal of Metalcasting. 2016;10(2):138-146. DOI: 10.1007/s40962-016-0020-z
11.Dang B, Liu CC, Liu F, Liu YZ, Li YB. Efect of as-solidiied microstructure on subsequent solution-treatment process for A356 Al alloy. Transactions of Nonferrous Metals Society of China.
2016;26(3):634-642. DOI: 10.1016/S1003-6326(16)64152-3
12.Colley LJ, Wells MA, Poole WJ. Microstructure-strength models for heat treatment of Al-Si-Mg casting alloys I: microstructure evolution and precipitation kinetics. Canadian Metallurgical Quarterly.
2014;53(2):125-137. DOI: 10.1179/1879139513Y.0000000112
13. Alfonso I, González G, Lara G, Rodríguez M, Domínguez M, Tellez MG, et al. Fractal analysis of the heat treatment response for multiphase Al alloys. Materials Research.
2016;19(3):628-639. DOI: 10.1590/ 1980-5373-MR-2015-0755
14.Alexopoulos ND, Pantelakis SG. Quality evaluation of A357
cast aluminum alloy specimens subjected to diferent artiicial
ageing treatment. Materials & Design. 2004;25(5):419-430.
15.Suarez MA, Figueroa I, Cruz A, Hernandez A, Chavez JF.
Study of the Al-Si-X system by diferent cooling rates and
heat treatment. Materials Research. 2012;15(5):763-769. DOI:
10.1590/S1516-14392012005000103
16.Mukherjee I, Ray PK. A review of optimization techniques in metal cutting processes. Computers & Industrial Engineering.
2006; 50(1-2):15-34. DOI: 10.1016/j.cie.2005.10.001
17.Patel MGC, Krishna P, Parappagoudar MB. Modelling of squeeze
casting process using design of experiments and response surface
methodology. International Journal of Cast Metals Research.
2015;28(3):167-180. DOI: 10.1179/1743133614Y.0000000144
18.Wang H, Li EY, Li GY. Optimization of drawbead design in sheet metal forming based on intelligent sampling by using response surface methodology. Journal of Materials Processing Technology.
2008;206(1-3):45-55. DOI: 10.1016/j.jmatprotec.2007.12.002
19.Horng JT, Liu NM, Chiang KT. Investigating the machinability
evaluation of Hadield steel in the hard turning with Al2O3/TiC
mixed ceramic tool based on the response surface methodology.
Journal of Materials Processing Technology.