Local structure and hybridization states in Ba
0.9Ca
0.1Ti
1 xZr
xO
3ceramic
compounds: Correlation with a normal or relaxor ferroelectric character
V.R. Mastelaro,
a,⇑H.R. Favarim,
bA. Mesquita,
cA. Michalowicz,
dJ. Moscovici
dand J.A. Eiras
ea
Instituto de Fı´sica de Sa˜o Carlos, Universidade de Sa˜o Paulo, Sa˜o Carlos, SP, Brazil
bDEFIS – Universidade Federal de Ouro Preto, Ouro Preto, MG, Brazil
cDepartamento de Fı´sica, Instituto de Geocieˆncias e Cieˆncias Exatas, Universidade Estadual Paulista, Rio Claro, SP, Brazil dInstitut de Chimie et des Materiaux Paris Est, CNRS and Universite´ Paris Est Cre´teil, 94320 Thiais, France
eDepartamento de Fı´sica, Universidade Federal de Sa˜o Carlos, Sa˜o Carlos, SP, Brazil
Received 1 April 2014; revised 22 September 2014; accepted 27 October 2014 Available online 25 November 2014
Abstract—This paper reports on a multi-edge X-ray absorption analysis to elucidate how the substitution of Ti4+by Zr4+ions acts on the local order
structure and on the O 2phybridization states of Ba0.9Ca0.1Ti1 xZrxO3(BCZT) lead-free ceramic compounds, inducing a ferroelectric evolution from
a normal to a relaxor character. Ti, Ba, Zr and O X-ray absorption spectra were measured to probe the local and electronic structure of BCZT sam-ples that exhibit a normal (x< 0.18) or relaxor (xP0.18) ferroelectric character. X-ray absorption near edge structure results show that the local symmetry and distortion of TiO6, ZrO6and BaO12units are not significantly affected by the Ti/Zr ratio, the ferroelectric character or the long-range
order symmetry. The assignment of the ab initio density of states associated with the O K-edge enabled a correlation between the decrease in the hybridization between O 2pand Ti 3dstates and the ferroelectric character evolution of the BCZT samples. The hybridization states in the ferro-electric relaxor samples exhibit a more symmetric spatial configuration, as occurs with long-range symmetry.
Ó2014 Acta Materialia Inc. Published by Elsevier Ltd. All rights reserved.
Keywords:Ferroelectrics; Relaxors; Lead-free; Hybridization; XAS
1. Introduction
Because of their wide range of applications with regard to high-performance materials and their exceptional dielec-tric, electromechanical and pyroelectric properties, relaxor ferroelectric compounds have been studied in much detail [1–4]. However, the relaxation mechanisms underlying their unique dielectric behavior are still far from well under-stood, and this is an obstacle for the further development and optimization of their desirable dielectric properties, such as high dielectric constant, low dielectric loss and high field tunability[1–7].
Compositional disorder, i.e. the disorder in the arrange-ment of different ions on crystallographically equivalent sites, has been pointed out as being a common feature of relaxors [1–7]. The relaxor behavior was first observed in perovskites with disorder in non-isovalent ions, including stoichiometric complex compounds, e.g. Pb(Mg1/3Nb2/3)O3 and Pb(Sc1/2Ta1/2)O3(in which Mg2+, Sc3+, Ta5+and Nb5+ ions are fully or partially disordered in the B-sublattice of the perovskite ABO3structure) and nonstoichiometric solid
solutions, e.g. Pb1 3x/2LaxZr1 yTiyO3 (PLZT), where the substitution of Pb2+ by La3+ ions necessarily leads to vacancies on the A-site[1–7].
Ceramic samples based on barium titanate (BaTiO3 – BT) are among the most studied lead-free ferroelectric materials. The ferroelectric nature and the structural and dielectric phase transition temperatures of BT have been significantly investigated via a partial substitution of either Ba ions (A-site substitution) and/or Ti ions (B-site substitu-tion)[8–13].
If a heterovalent atom substitutes for the Ba atom, a relaxor state is induced at lower amounts of Ti substitution [8–13]. In this case, as proposed for lead-containing relax-ors, the relaxor state should be developed either by charge disorder or A-site vacancy [6]. On the other hand, in the substitution of Ti4+ by Zr4+ ions, which exhibit only a small difference in their ionic radii, the mechanism involved in the formation of polar nanoregions in BaTiO3-based relaxors has not been elucidated.
A few studies have revealed that the polar behavior of BT-based relaxors is substantially related to displacements of Ti4+ions from the central position in the oxygen octahe-dra [6,13]. Indeed, the relaxor state in the BaZrxTi1 xO3 (BZT) system, when xP0.25, has been attributed to a
breakage in the correlation displacement of B-site cations
http://dx.doi.org/10.1016/j.actamat.2014.10.059
1359-6462/Ó2014 Acta Materialia Inc. Published by Elsevier Ltd. All rights reserved. ⇑Corresponding author. Tel.: +55 16 33739828; fax: +55 16
33739824; e-mail:[email protected]
ScienceDirect
Acta Materialia 84 (2015) 164–171
caused by the substitution of Ti4+ by Zr4+, which hinders the perfect alignment of all Ti displacements[6,14,15].
As such remarkable materials are invariably chemically and/or displacively disordered, the study of their local and electronic structures is an important starting point to better understand their intrinsic dielectric properties.
Laulhe´ et al.[14]studied the short-range order structure around Zr atoms in the BZT system. According to their results, the local structure around Zr differs considerably from the average cubic structure determined by X-ray dif-fraction (XRD) and the distance between Zr atoms and their first oxygen neighbors is equal to the distance mea-sured in the BaZrO3 compound independently of the Zr substitution rate. The authors observed that Zr atoms tended to be segregated in Zr-rich regions and the relaxor behavior in BZT could be influenced by the random elastic fields generated by the chemical arrangement of Zr atoms. The analysis of the neutron pair distribution function was also used for the study of the local structure in BZT relaxors[15]. Despite the Ti/Zr substitution and their differ-ent dielectric properties, Ti displacemdiffer-ents in BZT relaxors are similar to those in the classical BT compound. Laulhe´ et al. [15] concluded that the difference in the dielectric properties of BT and BZT materials lies in the different cor-relation between the cations displacements.
Laulhe´ et al. [16]also proposed an explanation for the relaxor behavior of the BaTi0.74Zr0.26O3 sample using first-principles supercell calculations. Based on the calcula-tions, they asserted that the symmetry of a Ti atom dis-placement is fully determined by the distribution of the Ti and Zr atoms in the adjacent unit cells. Unlike what is observed in the classic BT compound, in the BaTi0.74Zr0.26O3relaxor, the chemical substitution imposes a random distribution of the Ti displacement symmetries between the TiO6octahedra, thereby inhibiting the perfect alignment of all Ti displacements. This degree of freedom would lead to a partial correlation of the polar displace-ment, hence the formation of polar nanoregions[16].
Knowledge of the electronic and local structures of fer-roelectric ceramics is a fundamental step towards under-standing their dielectric properties. In lead-based ferroelectric ceramic systems, the ferroelectric character is directly correlated with the electronic properties of both A-site (Pb2+) and B-site (Ti4+) ions [17,18]. Many studies have shown that the density of states (DOS) of oxygen and titanium atoms could provide a more direct correlation with the ferroelectric stability of perovskite-based compounds [19–28]. They have also reported a significant modification in the hybridization among O 2p, Pb 6sp
and Ti 3dstates when the ferroelectric character changes. In the PLZT and Pb1 xBaxZr1 yTiyO3 complex ferro-electric compounds, a reduction in the degree of hybridiza-tion between O 2pand Pb 6sp(Ti 3d) states as the amount of La (Ba) increased was directly related to the manifesta-tion of the relaxor character[23–28].
To the best of our knowledge, no investigation into the evolution from a normal character to a relaxor one and the hybridization state of the ions has been conducted in lead-free systems. Thus, this paper presents a multi-edge X-ray absorption spectroscopy (XAS) analysis to investigate how the substitution of Ti4+by Zr4+ions acts on the local structure and hybridization states of Ba0.9Ca0.1ZrxTi1 xO3 (BCZT) lead-free ceramic compounds and how the results could be related to their ferroelectric character. The local
and electronic structures of BCZT ceramic samples prepared by the solid-state reaction procedure were studied by measuring the XAS spectra at the Ti K- and L-edges and the Zr, Ba and O K-edges. Since the Ba L-edge is just above the Ti K-edge, the latter was studied only by the X-ray absorption near edge structure (XANES). On the other hand, precise extended X-ray absorption fine structure (EXAFS) fitting procedures were used to determine the local structure around Ba and Zr atoms. Furthermore, we applied an ab initio method using the FEFF code [29]to interpret the O K-edge XANES signal of the two most rep-resentative BCZT samples in terms of hybridization states.
2. Experimental details
Ba0,9Ca0,1Ti1 xZrxO3ceramic samples, hereafter labeled BCZT100*x (where x= 0.00, 0.05, 0.09, 0.18, 0.20, 0.22, 0.24 and 0.27), were prepared by the solid-state reaction method. A detailed description of the sample preparation can be found elsewhere[30].
Titanium K-edge X-ray absorption spectra were col-lected at the LNLS (National Synchrotron Light Labora-tory) facility using the D04B-XAS2 beamline. The sample pellets, obtained after sintering, were ground and XAS data were measured in transmission mode from 80 to 430 K using a double crystal Si(1 1 1) monochromator. Ionization chambers were used to detect the incident and transmitted flux. XANES spectra at the Ti K-edge were recorded for each sample between 4910 and 5200 eV using energy steps of 0.5 eV around the edge. For good energy reproducibility during the XANES data collection, the energy calibration of the monochromator was checked with a Ti metal foil at the same time as the sample spectra were collected. Tita-nium L-edges and oxygen K-edge XANES spectra were measured by the electron yield mode using the SGM beam-line at the Canadian Light Source synchrotron facility. The Zr and Ba K-edge EXAFS spectra were collected at the SOLEIL Synchrotron facility using SAMBA beamline with a Si (2 2 0) sagittal focusing monochromator.
The XANES normalization and the extraction of EXAFS spectra were performed using the Multi-Platform Applications for X-ray absorption (MAX) software pack-age [31]. Normalized XANES and EXAFS fitting were obtained with the MAX-Cherokee and MAX-Roundmid-night codes, respectively. The amplitude and phase shift data were calculated using the FEFF8 theoretical ab initio code with the input files issued from MAX-Crystalffrev [29,32]. The MAX-Crystalffrev code enables substitutions and vacancies in the input crystal structure obtained from Rietveld refinements [30]. EXAFS data fitting used the standard EXAFS formula according to the reports of the IXS standard and criteria subcommittees[33].
3. Results and discussion
Table 1shows a summary of previously obtained XRD refinements and the dielectric response of BCZT samples [29]. As can be seen, the long-range order changes from tetragonal (BCZT00) to cubic (BCZT05 to BCZT27) sym-metry, while the dielectric response moves from a ferroelec-tric to a relaxor character.
3.1. Ti K-edge XANES spectra analysis
Fig. 1 shows the Ti K-edge XANES spectra of the BCZT samples. No significant variation was observed in the spectra as the amount of Zr increased, indicating that the local order structure around titanium atoms did not undergo any significant change as Ti atoms were replaced by Zr atoms.
According to the experimental and theoretical study of Vedrinskii et al.[35], in most ABO3centrosymmetric perov-skite compounds, such as EuTiO3, SrTiO3 and CaTiO3, three pre-edge peaks, labeledA,BandC, are observed at the Ti K-edge XANES spectra. In all ferroelectric titanate perovskites with a distorted TiO6octahedral site, the quad-ripolar1s–3dtransition labeledA is almost totally hidden by the quite intense peakB [35]. The authors proved that the dipolar 1s–3d (t2g) transition labeled B is related to
the hybridization ofp-andd-symmetric states of Ti atom under the influence of the neighboring oxygen atoms[35]. For perovskites, the off-center displacement (static and/or dynamic) of the Ti atom in the TiO6 octahedron can be related to the area under the B peak in the1s–3dtransition region[35–37]. As can be observed inFig. 1b, theB peak areas of BCZT00 and BCZT27, characterized as normal and relaxor ferroelectric samples, respectively, are similar to that of the BaTiO3 (BT) ferroelectric phase. According to Ravel et al. [38], independently of the BT crystallo-graphic symmetry, the distortion of Ti atoms calculated from the analysis of the B peak area is around 0.18.
The pre-edge feature labeled C is related to the Ti 1s
electron transition to the unoccupied 3d-originatedeg-type
molecular orbital of the TiO6 polyhedra neighboring the absorbing Ti atoms[35–37]. Thet2g–egenergy gap between
peaksBandCis approximately 3 eV (24,200 cm 1), which is in the expected range for TiO6octahedral sites. The area under peakCdoes not depend strongly on small displace-ments of the atoms from their sites, but it changes signifi-cantly when 4d atoms appear in the vicinity of the absorbing Ti atom [35]. Fig. 1c shows that the peak C intensity varies as the amount of Zr increases, confirming the substitution of Ti nearest neighbors by Zr atoms.
In summary, the results obtained at the Ti K-edge XANES spectra show that, independently of the long-range order symmetry and ferroelectric character, Ti atoms are located in an off-center position and their degree of disor-der is similar to that observed in the BaTiO3compound. Table 1. Space groups and cell parameter obtained from Rietveld
refinement of BCZT ceramics and their dielectric response at room temperature[30].
Sample Space group a(A˚ ) Dielectric response
BCZT00 P4mm 3.99862 Ferroelectric
BCZT05 Pm-3m 4.01154 Ferroelectric
BCZT09 Pm-3m 4.02101 Paraelectric
BCZT18 Pm-3m 4.04207 Relaxor
BCZT20 Pm-3m 4.04119 Relaxor
BCZT22 Pm-3m 4.04903 Relaxor
BCZT24 Pm-3m 4.05199 Relaxor
BCZT27 Pm-3m 4.05746 Relaxor
Fig. 1. (a) Ti K-edge XANES spectra of BCZT samples collected at room temperature, (b) XANES spectra of BCZT00, BCZT27 and BaTiO3 samples measured at 300 K and (c) details of the pre-edge
3.2. Zr K-edge EXAFS data analysis
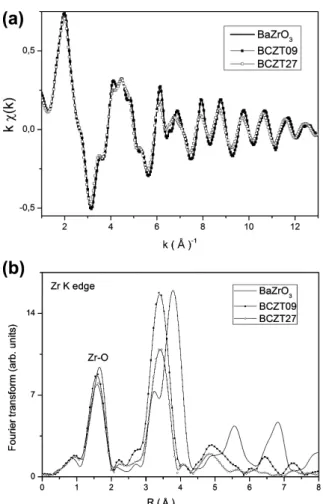
Fig. 2 shows the Zr K-edge EXAFS spectra and the respective Fourier transform (FT) curves of the BaZrO3, BCZT09 and BCZT27 samples. The first FT peak of the BCZT samples, which corresponds to the Zr–O distance, shows a shorter distance in comparison to that in the BaZrO3 compound and its intensity decreases as the amount of Zr increases. The second shell corresponds to Zr–Ba(Ca), Zr–Ti(Zr) and Zr–Zr, as well as contributions from multiple scattering effects. Theoretical calculations issued from FEFF code (not showed) indicate that the sig-nificant modification in the intensity of the second shell as the amount of Zr increases is due to the difference in the backscattering phases of Ti and Zr atoms. Thus, only the first Zr–O coordination shell is analyzed quantitatively because it is more directly correlated to the TiO6octahedra
and the evolution from a normal to a relaxor ferroelectric character.
Table 2 shows the fitting results of Zr K-edge EXAFS spectra that correspond to the first coordination shell (Zr–O) andFig. 3shows a comparison between the filtered and theoretical EXAFS spectra of the BCZT27 sample. As can be observed, the Zr–O mean bond lengths of BCZT samples are similar, whereas the Debye–Waller factor value increases as Ti is substituted by Zr atoms. Such results are similar to those obtained by Laullhe´ et al. in the analy-sis of the local order structure around Zr atoms in the BaTi1 xZrxO3samples[15]. As also stated by the authors, in BZT samples, the structural differences observed around Zr atoms between the BCZT09 and BCZT27 samples are too small to explain the modification in their ferroelectric character.
3.3. Ba K-edge EXAFS data analysis
Fig. 4 shows the Ba K-edge EXAFS spectra and FT curves of the BCZT09, BCZT18, BCZT24 and BCZT27 samples. As the amount of Zr increases, the intensity of the FT peaks decreases and the peak positions are not signif-icantly affected. The decrease in the intensity of the FT peaks can be interpreted in terms of either a decrease in the number of Ba neighbors or an increase in the Debye–Waller factor value. According to previous XRD studies [30], these samples exhibit a cubic symmetry at room temperature. Therefore, at least for the Ba–O first coordination shell, no variation in the number of neighbors is expected.
In order to identify the origin of the FT intensity decrease, the peaks between 1.5 and 4 A˚ were isolated and back-Fourier transformed, and the filtered EXAFS
Fig. 2.(a) Zr K-edge EXAFS spectra and (b) FT of BZ and BCZT samples collected at 300 K.
Table 2. Fitting results of the first coordination shell of EXAFS spectra collected at the Zr K-edge at 300 K and the Zr–O mean bond-length obtained from XRD.
Sample N (Zr–O)* R (Zr–O) A˚ r2(Zr–O) A˚ QF R (Zr–O) A˚
XRD
BaZrO3 6 2.113 ± 0.004 0.0047 ± 0.0003 1.1 2.10
BCZT09 6 2.109 ± 0.005 0.0056 ± 0.0004 1.8 2.11
BCZT27 6 2.103 ± 0.005 0.0065 ± 0.0004 1.7 2.11
QF = quality factor.
*Fixed during the fitting procedure.
spectra were fitted.Table 3shows the fitting results of the first three FT peaks, which correspond, respectively, to Ba–O, Ba–(Ti,Zr) and Ba–(Ba,Ca) interactions. Fig. 5 shows the comparison between the filtered EXAFS spectra of the BCZT27 sample and the theoretical EXAFS spectra obtained after the fitting procedure. The amounts of Zr and Ca were taken into account by considering the nominal sample composition, and the neighbor’s numbers of each shell was fixed during the fitting procedure. A better quality factor was attained when the Ba–Zr, Ba–Ti, Ba–Ca and Ba–Ba contributions were considered separately. Accord-ing to the fittAccord-ing results, the first Ba–O bond length increased from 2.82 to 2.85 A˚ as the amount of Zr increased. Concerning the Ba–Ti, Ba–Zr and Ba–(Ba,Ca)
interactions, the bond lengths also increased and the Debye–Waller factor (r) values remained practically con-stant as the amount of Zr increased. Therefore, the decrease in the intensity of the FT peaks with increasing amount of Zr cannot be attributed to the increase in the disorder around the Ba atoms. In fact, FEFF theoretical calcula-tions show a phase opposition between Ti and Zr signals that could explain the intensity decrease as Ti is substituted by Zr atoms: a variation in the Ti/Zr number of neighbors, even with small distance variations, can lead to a significant interference effect on the EXAFS signal. Due to the super-position of the three FT peaks, this phase opsuper-position effect also affects the amplitude of the Ba–O interaction.
The results of barium EXAFS spectra show that the short-range order structure around Ba atoms is not signif-icantly affected by the modification in the long-range order structure of the ferroelectric phase. Moreover, as can be observed inFig. 6, the structural results from the analysis of the Ba EXAFS spectra showed a good agreement with those from the XRD analysis[30].
3.4. Ti L-edge and O K-edge XANES data analysis
The Ti L-edge XANES spectra of BaTiO3 and BCZT samples (Fig. 7) show two pre-edge peaks, denoted as A
and B,and a usual set of four peaks, denoted asC,D,E
and F. As can be observed, increasing the amount of Zr promotes no significant changes in the spectra. The Ti L-edge XANES spectra of the BaTiO3compound have been studied in detail previously [19–22]. According to these Fig. 4. (a) Ba K-edge EXAFS spectra and (b) respective FT of BCZT
samples collected at room temperature.
Table 3. Fitting results of the first three coordination shells of BCZT EXAFS spectra at Ba K-edge collected at 300 K.
Samplex N*
Ba–O RBa–O rBa–O N*Ba–Ti RBa–Ti rBa–Ti N*Ba–Zr RBa–Zr rBa–Zr N*Ba–(Ba,Ca) RBa–(Ba,Ca) rBa–(Ba,Ca) QF
0.09 12 2.820
(0.009) 0.0133 (0.0008)
7.0 3.480
(0.006) 0.0086 (0.0007)
1.0 3.55
(0.01)
0.0045 (0.0008)
6.0 4.014
(0.006)
0.0096 (0.003)
4.3
0.18 12 2.837
(0.009) 0.0145 (0.009)
7.0 3.492
(0.007) 0.0075 (0.0007)
1.0 3.53
(0.01)
0.0065 (0.0007)
6.0 4.030
(0.009)
0.012 (0.001)
3.1
0.22 12 2.850
(0.009) 0.0144 (0.0009)
6.0 3.520
(0.008) 0.009 (0.001)
2.0 3.550
(0.009) 0.0059 (0.0007)
6.0 4.05
(0.01)
0.014 (0.001)
2.0
0.27 12 2.850
(0.01)
0.0147 (0.0009)
5.0 3.52
(0.01)
0.0083 (0.0009)
3.0 3.55
(0.01)
0.0075 (0.0006)
6.0 4.05
(0.01)
0.014 (0.001)
2.3
() error; NBa–Ti+ NBa–Zr= 8, NBa–Ba+ NBa–Ca= 6, QF = quality factor. *
Fixed during the fitting procedure.
studies, the features labeledAandBare related to forbid-den dipolar transitions in the L–S coupling (spin–orbit cou-pling) allowed by pd multipolar interactions [19–22]. Features C and D occur because the 3d band splits into two sub-bands in the TiLIII-edge, i.e.t2g(peakC) andeg
(peak D) [19–22]. The other two features, E and F, correspond to the LII-edge with t2g and eg symmetries,
respectively. In good agreement with the analysis of the Ti K-edge data, all Ti L-edge XANES spectra of BCZT samples are similar to that of the BaTiO3compound and are not affected by the increase in the amount of Zr.
Fig. 8shows the O K-edge XANES spectra of BaTiO3 and BCZT compounds. As can be observed in Fig. 8a, increasing the amount of Zr promotes a systematic decrease in theApeak intensity. On the other hand, the changes in theBandCfeatures are more complex, since they tend to overlap as the amount of Zr increases abovex =0.09. The
D and E peaks remain quite stable as the amount of Zr increases. According to the literature, the features observed in O K-edge XANES spectra are due to transitions from the O 1s core state to the unoccupied O 2p-derived state [19–22]. More specifically, the features labeled A, B or C
are attributable to hybridized states between O 2pand Ti 3d, whereas features D and E are attributable to the O 2p-derived states hybridized with Ca 3d/Ba 5d[19–21]. As
the electronegativity of Zr (1.33) is lower than that of Ti (1.54), feature A shifts slightly to lower energy as the Zr content increases[20].
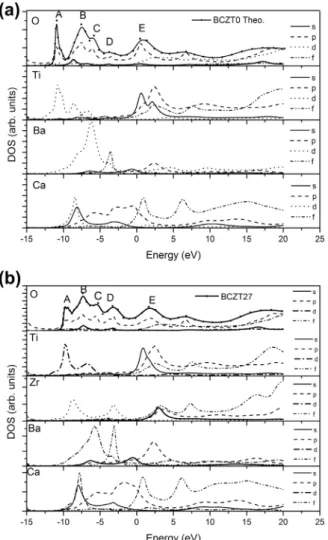
In order to correlate the modifications observed at the O K-edge spectra and the electronic structure of oxygen atoms, the O K-edge X-ray absorption spectra and the O 2p, Ti 3d, Zr 3d, Ca 3dand Ba 5d-derived density of states for two representative samples, BCZT00 (normal ferroelec-tric) and BCZT27 (relaxor ferroelecferroelec-tric), were calculated. The O K-edge theoretical XANES spectra and the DOS of the BCZT00 and BCZT27 samples were calculated using the FEFF9.0 code and considering an ensemble of atoms around the central oxygen atom [34]. These ensembles, which contain 540 atoms and correspond to a 10.14 A˚ clus-ter radius around the absorbing atom (oxygen), were con-structed based on the average X-ray diffraction structure of both compounds previously determined[30]. The ground state DOS was calculated with the same code parameters. The total O XANES spectrum was obtained by summing the contributions of two individual O-atom sites and at least three XANES spectra calculated and averaged to take into account the different possible positions of the substi-tuting atoms (Ca and Zr). The energy scale of the O 2p -pro-jected DOS calculated by FEFF9.0 code was shifted so that the peak positions could be compared with the experimen-tal XANES spectra. The partial DOS has been broadened with a Lorentzian function of 0.2 eV half-width at half maximum.
Fig. 6. Comparison of Ba–O, Ba–Ti, Ba–Zr and Ba–(Ba,Ca) mean bond lengths determined from EXAFS fitting and obtained from the XRD refinement provided in Ref.[30].
Fig. 7.Titanium L-edge XANES spectra of BaTiO3 and BCZT
compounds collected at 300 K.
Fig. 8. (a) O K-edge XANES spectra of BaTiO3and BCZT samples.
Fig. 9shows the calculated O K-edge XANES spectra of the BCZT00 and BCZT27 samples and the local density of states (s-,p-, d-andf-projected DOS) of oxygen, titanium, zirconium, barium and calcium. In both cases, the O 2p -projected DOS resembles the experimental O K-edge XANES spectra calculated. Moreover, from the position of the density of the states peaks, it was possible to infer that featureA results mainly from O 2pstates hybridized with the Ti 3dorbital. FeaturesB andC come up largely from the hybridization between the O 2p and the Ba 5d
and Ca 3d states. Feature D arises predominantly from the hybridization between the O 2pand the Ba 4fand Ca 2p states, whereas feature E can be assigned mainly to a hybridization of O 2pwith Ti 2p4fand Ca 4f.Fig. 9shows the intensity of the Ti 3d, Zr 4d, Ba 4f and Ca 3d DOS divided by a factor of 2, 5 or 10 so that the projected DOS can be compared on a common intensity scale.
Thus, the decrease in the featureAintensity and the evo-lution of the ferroelectric character observed experimen-tally in BCZT samples as the amount of Zr increased can be directly correlated to the hybridization decrease between the O 2pand Ti 3dstates. Furthermore, as the amount of Ca and Ba atoms remained constant in the samples studied, the overlap of theAandBpeaks can be attributed mainly to modifications to the degree of hybridization between the O 2pwith Ti 3dstates.
It is well accepted that the ferroelectric ordering results from a balance between the long-range Coulomb interac-tion and short-range forces [17]. As in other perovskites, the hybridization between Ti 3d and O 2p weakens the short-range repulsions in the BCZT samples and enables the establishment of a ferroelectric order[18,19]. The inten-sity drops of featureAwith increasing Zr content indicate a decrease in the number of unoccupied O 2p–Ti 3d hybrid-ized states. According to Cohen[17], if the Ti–O hybridiza-tion is inhibited, the ferroelectric instability disappears and the cubic phase is more stable. Based on these consider-ations, we propose that the reduction in the O 2p–Ti 3d
hybridization caused by the substitution of Ti by Zr decreases the ferroelectric instability, favoring the relaxor character in samples with xP0.18.
4. Conclusions
This paper has reported a comprehensive experimental analysis of the short-range order and electronic structure of Ba0.9Ca0.1ZrxTi1 xO3 (BCZT) lead-free ferroelectric ceramic compounds. The local and electronic structure around all constituent Ba, Ti, O and Zr atoms were studied as a function of the substitution of Ti by Zr.
The XANES spectra of BCZT and BaTiO3samples col-lected at the Ti K- and L-edges showed that the local and electronic structures of Ti atoms are very similar and remain distorted, despite their different ferroelectric responses, especially in the case of relaxor samples which were assigned as cubic from XRD. From the Ti K-edge XANES spectra, no different displacement direction of Ti was identified, which indicates that no structural changes occur in the TiO6octahedra with increasing amount of Zr. The fitting results of barium EXAFS spectra show that the short-range order structure around Ba atoms is in good agreement with that obtained from the XRD analysis and is not significantly affected by the modification in the long-range order structure or the ferroelectric state.
The structural variations observed around Zr atoms are too small to explain the modification in the ferroelectric character caused by the increase in the amount of Zr.
The calculation of the DOS of the constituent atoms in a normal and a relaxor BCZT sample showed that the inten-sity decrease observed at the O K-edge XANES spectra as the amount of Zr increases is directly correlated to a decrease in the hybridization between the O 2pand Ti 3d
states. Such a result has led to the conclusion that this hybridization reduction favors the relaxor character above a certain amount of Zr.
The decrease in O 2phybridization with Ti 3dis similar to that observed in lead-based ferroelectric ceramic materials, although in the BCZT samples the substitution occurs only on the B (Ti) site.
Although the local structure around the Ti atoms of the BCZT samples is similar to that observed in the BaTiO3 compound, the hybridization states change to a more sym-metric spatial configuration, as occurs with the long-range symmetry when Ti is substituted by Zr atoms.
Acknowledgements
The authors are grateful to FAPESP (Proc.: 2008/04025-0) and Capes Brazilian funding agencies. This research was partially
carried out at the LNLS, SOLEIL and CLS synchrotron facilities. The storage ring operators and XAS beamline scientists of the three synchrotrons (S. Belin, V. Briois, E. Fonda (Soleil), A.P.S. Sotero and J.C. Maurı´cio (LNLS) and T. Regier and D. Chevrier (CLS)) are highly acknowledged.
References
[1]V.A. Isupov, Phys. Solid State 45 (2003) 1107. [2]Z.G. Ye, Key Eng. Mater. 11 (1998) 81.
[3]A.A. Bokov, Z.G. Ye, J. Mater. Sci. 41 (2006) 31.
[4]R.A. Cowley, S.N. Gvasaliya, S.G. Lushnikov, B. Roessli, G.M. Rotaru, Adv. Phys. 60 (2011) 229.
[5]T. Maiti, R. Guo, A.S. Bhalla, Ferroelectrics 425 (2011) 4. [6]V.V. Shvartsman, D.C. Lupascu, J. Am. Ceram. Soc. 95
(2012) 1.
[7]L. Xie, Y.L. Li, R. Yu, Z.Y. Cheng, X.Y. Wei, X. Yao, C.L. Jia, K. Urban, A.A. Bokov, Z.-G. Ye, J. Zhu, Phys. Rev. B 85 (2012) 014118.
[8]J. Ravez, C. Broustera, A. Simon, J. Mater. Chem. 9 (1999) 1609.
[9]J. Ravez, A. Simon, Eur. Phys. J. AP 11 (2000) 9. [10]J. Ravez, A. Simon, J. Solid State Chem. 162 (2001) 260. [11]A. Simon, J. Ravez, M. Maglione, Solid State Sci. 7 (2005)
925.
[12]J. Ravez, A. Simon, Eur. J. Solid State Inorg. Chem. 34 (1997) 1199.
[13]A. Simon, J. Ravez, M. Maglione, J. Phys. Condens. Matter 16 (2004) 963.
[14]C. Laulhe´, F. Hippert, J. Kreisel, M. Maglione, A. Simon, J.-L. Hazemann, V. Nassif, Phys. Rev. B 74 (2006) 014106. [15]C. Laulhe´, F. Hippert, R. Bellissent, A. Simon, G.J. Cuello,
Phys. Rev. B 79 (2009) 064104.
[16]C. Laulhe´, A. Pasturel, F. Hippert, J. Kreisel, Phys. Rev. B 82 (2010) 132102.
[17]R.E. Cohen, Nature 358 (1992) 136–138.
[18]H. Miyazawa, E. Natori, S. Miyashita, T. Shimoda, F. Ishii, T. Oguchi, Jpn. J. Appl. Phys. 39 (Part 1) (2000) 5679. [19]J.C. Jan, K.P.K. Kumar, J.W. Chiou, H.M. Tsai, H.L. Shih,
H.C. Hsueh, S.C. Ray, K. Asokan, W.F. Pong, M.H. Tsai, S.Y. Kuo, W.F. Hsieh, Appl. Phys. Lett. 83 (2003) 3311. [20]J.C. Jan, H.M. Tsai, C.W. Pao, J.W. Chiou, C.K. Asokan,
K.P.K. Kumar, W.F. Pong, Y.H. Tang, M.H. Tsai, S.Y. Kuo, W.F. Hsieh, Appl. Phys. Lett. 87 (2005) 012103.
[21]P. Nachimuthu, S. Thevuthasan, E.M. Adams, W.J. Weber, B.D. Begg, B.S. Mun, D.K. Shuh, D.W. Lindle, E.M. Gullikson, R.C.C. Perera, J. Phys. Chem. B 109 (2005) 1337. [22]S.O. Kucheyev, T.v. Buuren, T.F. Baumann, J.J.H. Satcher, T.M. Willey, R.W. Meulenberg, T.E. Felter, J.F. Poco, S.A. Gammon, L.J. Terminello, Phys. Rev. B 69 (2004) 245102. [23]V.R. Mastelaro, P.P. Neves, S.R. de Lazaro, E. Longo, A.
Michalowicz, J.A. Eiras, J. Appl. Phys. 99 (2006) 044104. [24]V.R. Mastelaro, P.P. Neves, A. Michalowicz, J.A. Eiras, J.
Phys. Condens. Matter 19 (2007).
[25] A. Mesquita, A. Michalowicz, V.R. Mastelaro, in: 14th international conference on X-Ray absorption fine structure (XAFS14), Proceedings book series: journal of physics conference series, vol. 190, 2009, p. 012081.
[26]V.R. Mastelaro, A. Mesquita, P.P. Neves, A. Michalowicz, M. Bounif, P.S. Pizani, M.R. Joya, J.A. Eiras, J. Appl. Phys. 105 (2009) 033508.
[27]V.R. Mastelaro, Y.P. Mascarenhas, P.P. Neves, M. Mir, A.C. Doriguetto, A. Michalowicz, J. Moscovici, M.H. Lente, J.A. Eiras, et al., J. Appl. Phys. 107 (2010) 114103.
[28]A. Mesquita, A. Michalowicz, V.R. Mastelaro, J. Appl. Phys. 111 (2012) 104110.
[29]A.L. Ankudinov, B. Ravel, S.D. Conradson, J.J. Rehr, Phys. Rev. B 58 (1998) 7565.
[30]H.R. Favarim, A. Michalowicz, J.C. M’Peko, V.R. Mastel-aro, Phys. Status Solidi A 207 (2010) 2570.
[31]A. Michalowicz, J. Moscovici, D. Muller-Bouvet, K. Provost, J. Phys. Conf. Ser. 190 (2009) 012034.
[32]A. Michalowicz, J. Moscovici, D. Muller-Bouvet, K. Provost, J. Phys. Conf. Ser. 430 (2013) 012016.
[33] IXS Standards and Criteria Subcommittee Reports, Interna-tional XAFS Society, < http://ixs.iit.edu/subcommit-tee_reports/sc/>, 2000.
[34]J.J. Rehr, J.J. Kas, F.D. Vila, M.P. Prange, K. Jorissen, Phys. Chem. Chem. Phys. 12 (2010) 5503.
[35]R.V. Vedrinskii, V.L. Kraizman, A.A. Novakovich, P.V. Demekhin, S.V. Urazhdin, J. Phys. Condens. Matter 10 (1998) 9561.
[36]A.I. Frenkel, D.M. Pease, J. Giniewicz, E.A. Stern, D.L. Brewe, M. Daniel, J. Budnick, Phys. Rev. B 70 (2004) 014106. [37]V.L. Kraizman, A.A. Novakovich, R.V. Vedrinskii, V.A.
Timoshevskii, Phys. B Condens. Matter 208 (1995) 35. [38]B. Ravel, E.A. Stern, R.I. Vedrinskii, V. Kraizman,
![Table 1 shows a summary of previously obtained XRD refinements and the dielectric response of BCZT samples [29]](https://thumb-eu.123doks.com/thumbv2/123dok_br/15716914.631650/3.892.487.811.95.916/table-summary-previously-obtained-refinements-dielectric-response-samples.webp)