Standard-curve competitive RT-PCR
quantification of myogenic regulatory
factors in chicken embryos
Departamentos de 1Produção Animal and
2Matemática e Estatística, Escola Superior de Agricultura “Luiz de Queiroz”,
Universidade de São Paulo, Piracicaba, SP, Brasil L.E. Alvares1,
A. Mantoani1,
J.E. Corrente2 and
L.L. Coutinho1
Abstract
The reverse transcription-polymerase chain reaction (RT-PCR) is the most sensitive method used to evaluate gene expression. Although many advances have been made since quantitative RT-PCR was first described, few reports deal with the mathematical bases of this tech-nique. The aim of the present study was to develop and standardize a competitive PCR method using standard-curves to quantify tran-scripts of the myogenic regulatory factors MyoD, Myf-5, Myogenin
and MRF4 in chicken embryos. Competitor cDNA molecules were constructed for each gene under study using deletion primers, which were designed to maintain the anchorage sites for the primers used to amplify target cDNAs. Standard-curves were prepared by co-amplifi-cation of different amounts of target cDNA with a constant amount of competitor. The content of specific mRNAs in embryo cDNAs was determined after PCR with a known amount of competitor and com-parison to standard-curves. Transcripts of the housekeeping ß-actin
gene were measured to normalize the results. As predicted by the model, most of the standard-curves showed a slope close to 1, while intercepts varied depending on the relative efficiency of competitor amplification. The sensitivity of the RT-PCR method permitted the detection of as few as 60 MyoD/Myf-5 molecules per reaction but approximately 600 molecules of MRF4/Myogenin mRNAS were nec-essary to produce a measurable signal. A coefficient of variation of 6 to 19% was estimated for the different genes analyzed (6 to 9 repeti-tions). The competitive RT-PCR assay described here is sensitive, precise and allows quantification of up to 9 transcripts from a single cDNA sample.
Correspondence L.L. Coutinho
Departamento de Produção Animal ESALQ, USP
13418-900 Piracicaba, SP Brasil
Fax: +55-19-3429-4285 E-mail: [email protected]
Research supported by FAPESP (Nos. 96/12196-0 and 2000/12864-7) and CNPq (No. 52/600197-9).
Received July 4, 2002 Accepted September 19, 2003
Key words
•Quantitative RT-PCR
•Standard-curve
•Myogenic regulatory factors •Gene expression
Introduction
The combination of reverse transcription and the polymerase chain reaction (RT-PCR) has produced the most sensitive technique available to study gene expression. Under
multiple mRNAs in single samples, and po-tential for rapid analysis of a large number of samples (3). Because of these characteris-tics, RT-PCR has been widely applied in gene expression analysis, proving to be par-ticularly useful when starting material or mRNAs are limited (4-7). Nevertheless, quantification of gene activity using RT-PCR is not trivial because of the exponential nature of PCR. Even slight variations in amplification efficiency of samples contain-ing the same number of a specific target may result in large differences in the amount of amplicons synthesized, precluding correct quantification (8).
The first applications of RT-PCR to quan-tify gene expression were based on the use of an endogenous control, normally housekeep-ing genes such as those codhousekeep-ing for ß-actin, glyceraldehyde-3-phosphate dehydrogenase or ribosomal proteins, which are assumed to be invariable among samples (9-12). The relative content of a specific transcript is obtained after results are normalized with respect to the endogenous control. This method requires amplification efficiency and abundance of control and target templates to be similar so that the exponential range of amplification of both products overlaps, al-lowing quantification before the plateau. Subsequently, Wang et al. (13), Becker-Andre and Hahlbrock (14) and Gilliland et al. (8) described competitive RT-PCR, which resulted in a great improvement in quantita-tive RT-PCR assays, allowing absolute mRNA quantification. Competitive RT-PCR uses an exogenous RNA or DNA control (competitor) that is co-amplified with the target molecule. The competitor must share identical primer binding sites with the target template but must differ in size or restriction sites to allow these fragments to be separated after PCR. Since the region to which primers bind is common, competitor and target DNA compete equally for the limiting reaction components (nucleotides, primers, enzyme). Consequently, the ratio between the two
prod-ucts is kept constant throughout the reaction. The most recent version of quantitative RT-PCR is the real-time RT-RT-PCR which has simplified quantitative assays monitoring the PCR kinetics at each cycle with the use of fluorescent dyes or primers in the reaction (2,15,16). However, many laboratories still do not have access to this technology due to the cost of the equipment.
Myogenic regulatory factors (MRFs) are master regulators of myogenesis (reviewed in Refs. 17-19). Although they have been the subject of intense investigations, there is little information about their threshold for biological activity, magnitude of expression, and relative content during different phases of myogenesis. In this paper we describe competitive RT-PCR assays developed to quantify transcripts of the four MRFs (MyoD,
Myf-5, Myogenin and MRF4) in whole
chicken embryos. The theoretical require-ments for the use of standard-curves in com-petitive RT-PCR assays are addressed for the first time. Using the classical mathemati-cal model for competitive PCR, we deter-mined the relative efficiency of competitors based on equations obtained from standard-curves.
Material and Methods
Embryos
Fertilized eggs from the AgRoss line were obtained from the Ninho Verde Poultry Farm (Tietê, SP, Brazil) and incubated in a hu-midified atmosphere at 38ºC. Embryos were staged according to Hamburger and Hamil-ton (20).
Isolation of total RNA
spectrophotometric readings at 260 nm (A260).
Purity of total RNA was determined by the A260/A280 ratio. Before cDNA synthesis, the
integrity of each RNA sample was confirmed by electrophoresis on 1% agarose gels.
Single-strand cDNA synthesis
One microgram of total RNA was re-verse transcribed using an oligo dT12-18 (500
ng) primer. The final reaction volume was 20 µl, containing 1X RT buffer (20 mM Tris-HCl, pH 8.4, 50 mM KCl), 5 mM MgCl2, 10
mM dithiothreitol, 500 µM of each dNTP, 40 U of RNaseOUT™ (Life Technologies) and 200 U of SuperScript II RNAse H Re-verse Transcriptase (Life Technologies). cDNAs were synthesized at 42ºC for 50 min following inactivation of SuperScript II by heating at 70ºC for 15 min. To remove tem-plate mRNAs, samples were treated with 1 U of RNase H at 37ºC for 30 min.
Synthesis of target and competitor templates
In order to construct standard-curves,
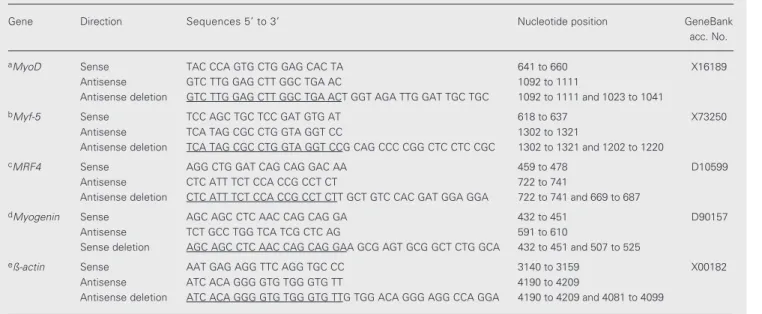
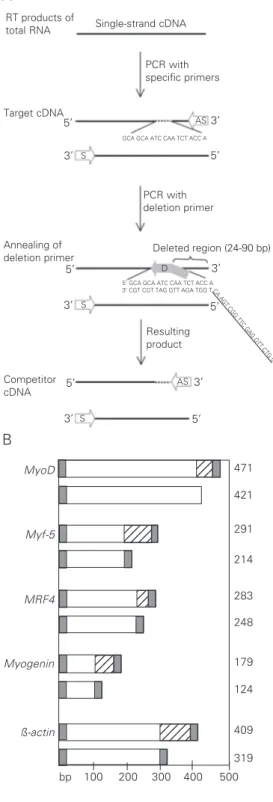
tar-get and competitor cDNA templates were prepared for each gene. To synthesize the target molecules, one-tenth of the RT reac-tion was amplified with the specific primers listed in Table 1. These fragments were iden-tical in size and nucleotide sequence to the cDNA obtained by RT-PCR of embryos. Competitor templates were produced by mutational PCR with the sense and antisense deletion primers (Table 1), using the corre-sponding target fragment as a template. The deletion primers were composed of 19 bases complementary to an internal region of the target template in addition to 20 bases iden-tical to the antisense primer. As can be ob-served in Figure 1A, after PCR the region downstream to the deletion primer site was eliminated in the competitor, resulting in a slightly smaller fragment. However, since the deletion primer contains the complete sequence of the antisense primer site, this stretch is rescued on the copied fragment. Consequently, the same primer pair can be employed to amplify both target and com-petitor cDNAs. A schematic representation of the target and competitor cDNAs
con-Table 1. Oligonucleotide primers used for competitive PCRs.
Gene Direction Sequences 5' to 3' Nucleotide position GeneBank
acc. No.
aMyoD Sense TAC CCA GTG CTG GAG CAC TA 641 to 660 X16189
Antisense GTC TTG GAG CTT GGC TGA AC 1092 to 1111
Antisense deletion GTC TTG GAG CTT GGC TGA ACT GGT AGA TTG GAT TGC TGC 1092 to 1111 and 1023 to 1041
bMyf-5 Sense TCC AGC TGC TCC GAT GTG AT 618 to 637 X73250
Antisense TCA TAG CGC CTG GTA GGT CC 1302 to 1321
Antisense deletion TCA TAG CGC CTG GTA GGT CCG CAG CCC CGG CTC CTC CGC 1302 to 1321 and 1202 to 1220
cMRF4 Sense AGG CTG GAT CAG CAG GAC AA 459 to 478 D10599
Antisense CTC ATT TCT CCA CCG CCT CT 722 to 741
Antisense deletion CTC ATT TCT CCA CCG CCT CTT GCT GTC CAC GAT GGA GGA 722 to 741 and 669 to 687
dMyogenin Sense AGC AGC CTC AAC CAG CAG GA 432 to 451 D90157
Antisense TCT GCC TGG TCA TCG CTC AG 591 to 610
Sense deletion AGC AGC CTC AAC CAG CAG GAA GCG AGT GCG GCT CTG GCA 432 to 451 and 507 to 525
eß-actin Sense AAT GAG AGG TTC AGG TGC CC 3140 to 3159 X00182
Antisense ATC ACA GGG GTG TGG GTG TT 4190 to 4209
Antisense deletion ATC ACA GGG GTG TGG GTG TTG TGG ACA GGG AGG CCA GGA 4190 to 4209 and 4081 to 4099
fied with Sephaglas (Pharmacia Biotech, Uppsala, Sweden). Eluted fragments were cloned in pGEM4Z/E. coli JM109 using the SureClone Ligation kit (Pharmacia Biotech). To confirm the identity and the deletion of the desired sequences, clones were sequenced with the BigDye Terminator kit (Applied Biosystems, Foster City, CA, USA) on an ABI PRISM 377 automated DNA sequencer.
Assay sensitivity
Different quantities of target template (1:10 serial dilutions) were amplified in single reactions to determine the approximate num-ber of molecules that could be detected after 35 PCR cycles. Products were analyzed by electrophoresis on 2-3% agarose gels. The presence of a band after ethidium bromide staining was the criterion used to determine the lower detection level for each primer pair.
Competitive PCR
Amplifications were conducted using the sense and antisense primers shown in Table 1. For the MRFs, sense primers corresponded to a sequence in exon 1, while antisense primers were complementary to a sequence located in exon 3. Sense and antisense primer sites of ß-actin were in exons 3 and 4, re-spectively. All primers were designed to flank an intron to avoid same-size amplification of contaminating genomic DNA.
PCR was performed in a final volume of 25 µl containing 1X PCR buffer (10 mM Tris-HCl, pH 8.3, 50 mM KCl, and 0.01% Triton X-100), 1.0 mM MgCl2 (Myf-5, MRF4
and Myogenin) or 1.5 mM MgCl2 (MyoD,
Myogenin and ß-actin), 200 µM dNTPs, 5
pmol of each primer, 1.25 U of Taq DNA polymerase (Promega, Madison, CA, USA) and 2 µl of cDNA. Sense primers were 5'-labelled with fluorescein. A known amount of competitor was directly added to the 1X PCR master mixture to assure that an equal structed for the different genes under study
is presented in Figure 1B.
After electrophoresis, target and com-petitor templates were identified by their size, excised from the agarose gel and
puri-Figure 1. Synthesis of target and competitor cDNA templates. A, Single-strand cDNA of embryos was amplified with specific S and AS primers to produce the target fragment. A second PCR was performed with the S and D primers to produce competitors using the target molecules as template. The D primer com-prises 19 bases homologous to an internal region of the target template (indicated by the bro-ken line) in addition to the com-plete AS primer sequence (un-derlined). B, Schematic repre-sentation of the target and com-petitor cDNAs. Gray boxes indi-cate annealing sites for the sense and antisense PCR prim-ers. Hatched boxes show the region deleted in competitors. Except for the deletion, competi-tors are identical to the corre-sponding target cDNA. S = sense primer, AS = antisense primer, D = deletion primer.
Deleted region (24-90 bp) PCR with deletion primer PCR with specific primers Resulting product Annealing of deletion primer 3’ 3’ 3’ 5’ 3’ 5’ Competitor cDNA 5’ AS S S D S AS 5’ 3’ 3’ 5’ 5’ Target cDNA
RT products of
total RNA Single-strand cDNA
MyoD Myf-5 MRF4 Myogenin ß-actin 471 421 291 214 283 248 179 124 409 319 123 123 123 12345 12345 12345 12 12 12 12 123 123 123 12345 12345 12345
bp 100 200 300 400 500 B
A
GCA GCA ATC CAA TCT ACC A
5’ GCA GCA ATC CAA TCT ACC A
amount was present in all samples to be quantified. The quantity of competitor added to the PCR was determined in preliminary titration experiments performed for each gene. To monitor DNA contamination, nega-tive controls were included in each PCR run. The first PCR cycle consisted of an initial denaturation at 95ºC for 3 min, followed by annealing for 1 min and synthesis at 74ºC for 1 min. Annealing temperatures for ß-actin/
Myf-5, MyoD/MRF4 and Myogenin were 55º,
57º and 59ºC, respectively. The subsequent cycles were identical except for a reduction in denaturation time to 1 min and inclusion of a 10-min extension in the last cycle. These cycle parameters were slightly different from those described by Lin-Jones and Hauschka (26). The total number of cycles was deter-mined for each gene based on amplification kinetic experiments. This assured that quan-tifications were carried out within the expo-nential phase of the PCR.
Quantification of PCR products
Aliquots of amplified products were loaded on 4.25% denaturing acrylamide gels and submitted to electrophoresis on the Au-tomated Laser Fluorescent DNA sequencer (A.L.F.™, Pharmacia LKB Biotechnology,
Uppsala, Sweden). Following electrophore-sis, peaks derived from target and competi-tor templates were integrated with the Frag-ment Manager software (Pharmacia LKB Biotechnology).
Construction of standard-curves
In order to construct standard-curves, known amounts of target and competitor templates were co-amplified in PCR assays prepared as described above (without em-bryonic cDNA). Serial dilutions of the target cDNA template (1:2) were performed in water containing 10 ng/µl of plasmidial DNA (with no insert) as carrier. The amount of target cDNA added to each PCR (Ti) varied
from 25.6 x 10-r to 0.1 x 10-rfmol (r = 2, 4, 5 or 6) while a fixed amount of 1 x 10-r fmol of competitor (Ci) was maintained.
After quantification of PCR products, the logarithm of the ratio between target and competitor peak areas, log(T/C), was plotted on the ordinate axis while the logarithm of the amount of target cDNA added to PCR, log(Ti), was plotted on the abscissa. The equation obtained by linear regression of standard-curves was used to determine the initial number of molecules in embryonic cDNA samples, based on the ratio of target to competitor products in individual PCRs.
Amplification kinetics
In order to compare the target and com-petitor amplification kinetics, equivalent amounts of these molecules were co-ampli-fied at increasing cycle numbers. After sepa-ration by electrophoresis, the measured peak areas of target and competitor products were expressed as logarithms to produce the cor-responding PCR kinetics. These assays al-lowed the determination of the exponential range of PCR and comparison of the relative amplification efficiencies of target and com-petitor templates for each gene.
The model
The mathematical bases of quantitative PCR assays have been discussed by different authors (27-29). The overall accumulation of target and competitor products during PCR can be calculated using the following equations, respectively:
T = Ti (1 + ET)n (Eq. 1)
C = Ci (1 + EC)n (Eq. 2)
effi-ciency of target amplification, EC =
effi-ciency of competitor amplification, and n = total number of PCR cycles.
The log-transformed ratio between equa-tions 1 and 2 was:
log(T/C) = log(Ti/Ci) + n x log(1 + ET)/(1 + EC)
(Eq. 3)
Y = ax + b (Eq. 4) Thus, Equations 3 and 4 predict that when log(T/C) is related to log(Ti), as done in our assays and in previous descriptions of the method (30,31), standard-curves must pro-duce a straight line with slope a = 1 and intercept b = n x log(1 + ET)/(1 + EC). If the
amplification efficiencies of the target (ET)
and competitor (EC) are identical, the
inter-cept value equals zero; otherwise, it is pos-sible to estimate a value of relative effi-ciency for competitor (or target) for a fixed number of cycles. In the context of this pa-per, the term relative amplification efficiency refers to the overall PCR efficiency esti-mated across the total number of cycles. This calculation was performed assuming ET to
have the theoretical value 1 and using the expression EC = (2 x 10-b/n) - 1.
Sample normalization
MRFs and ß-actin mRNA were meas-ured in the same RT reactions to correct for variations due to RNA preparation and RT efficiency. The amount of specific transcripts in each sample is presented as molecules of
mRNA per 104 ß-actin transcripts (e.g., 50
MyoD/104 ß-actin).
Results
Specificity and sensitivity of competitive RT-PCR
PCR products of the four MRFs and
ß-actin showed the predicted size for target
and competitor molecules. The identity of the sequences under study was confirmed by sequencing. Since some of the cloned frag-ments presented small deletions at the 5´- or 3´-ends, particular attention was paid to the integrity of these regions. It is very important that target and competitor templates have the same sequences at the priming regions since amplification efficiency is mainly determined by these sequences (13,30). In fact, a single base deletion observed at the annealing site of the forward primer of an MyoD competi-tor reduced its amplification efficiency by roughly 10-fold in comparison to the target template (data not shown). Thus, templates carrying alterations at the annealing primer sites cannot be used in quantitative assays since most of them will present severe changes in amplification efficiency.
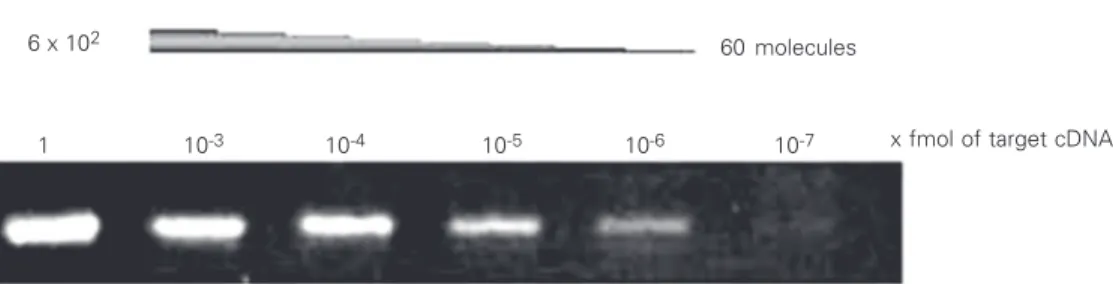
To determine the approximate number of molecules that each specific primer pair was able to amplify, decreasing amounts (1:10 serial dilutions) of target template were am-plified in single reactions for 35 cycles (Fig-ure 2). The smallest number of molecules that produced a visible band on agarose gels was considered to be the lowest limit of
Figure 2. Determination of the sensitivity of specific primer pairs. PCR products of reactions containing 1 and 10-3 to 10-7 fmol (1:10 serial dilution) of tar-get MyoD after 35 cycles. Bands were visualized on 2% agarose gels stained with ethidium bro-mide. The presence of a band established the lowest limit of detection. The number of mol-ecules was calculated using Avogadro’s number.
60 molecules
x fmol of target cDNA
1 10-3 10-4 10-5 10-6 10-7
detection for each primer set. MyoD and
Myf-5 primers were the most sensitive, being
able to detect about 60 molecules per reac-tion. MRF4 and Myogenin primers displayed intermediate sensitivity, detecting about 600 molecules. Although the Myogenin and
MRF4 primers were less sensitive than those of MyoD and Myf-5, the sensitivity of the assay was sufficient to detect basal levels of transcription in HH1 to HH10 embryos (data not shown), making further optimization unnecessary. ß-actin primers were copied with the lowest sensitivity, and approximately 60,000 molecules were necessary to pro-duce a visible band on agarose gel. How-ever, since the normal content of ß-actin
transcripts in cDNA samples was nearly 100 times more than this value, PCR assays did not require additional optimization.
Target and competitor PCR kinetics
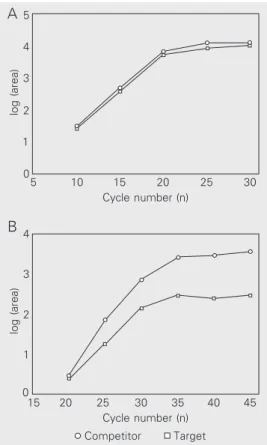
Before constructing standard-curves for the competitive PCR assays, amplification kinetics of target and competitor molecules were compared for each gene under study. This was done in order to determine the exponential range of PCR so that quantifica-tion of synthesized products could be per-formed before the plateau. Thus, the number of PCR cycles used to amplify standard-curve dilutions as well as cDNAs from em-bryos were established based on kinetic anal-ysis. In addition, the kinetics of the PCR permitted a preliminary comparison of tar-get and competitor amplification efficiency. The study of ß-actin amplification kinet-ics produced closely similar results for target and competitor molecules, indicating that both templates were amplified with similar efficiency during the PCR (Figure 3A). An intermediary situation was observed for
MyoD and Myogenin whose competitors were slightly more efficient than the target templates (data not shown). The amplifica-tion kinetics for target and competitor MRF4
templates were distinct, revealing that these
log (area)
5
4
3
2
1
0
log (area)
4
3
2
1
0
5 10 15 20 25 30
Cycle number (n)
15 20 25 30 35 40
Cycle number (n)
45
Competitor Target
Figure 3. Amplification kinetics of target and competitor cDNAs.
A, ß-actin kinetics showing that,
as PCR progresses, the curves of the target and competitor overlap, indicating similar ampli-fication efficiencies. B, MRF4
kinetics revealing that the com-petitor is amplified more effi-ciently during PCR than target cDNA. Equal amounts of target and competitor cDNAs were co-amplified for increasing num-bers of cycles to obtain kinetic data. After quantification of syn-thesized products, values of peak areas were expressed as logarithm and plotted against the cycle number. Note that PCR products accumulate at a linear rate until the plateau phase is reached.
molecules differ in relative efficiency of amplification (Figure 3B). Similar results were obtained for Myf-5 kinetics (data not shown).
Quantification of gene expression
As the first step to gene expression quan-tification in embryos, it was necessary to establish the amount of competitor that should be added to the PCR for each gene. Titration experiments were conducted by co-amplify-ing decreasco-amplify-ing amounts of competitor (1:10 serial dilution) with a constant volume (2 µl) of embryonic cDNAs. In this way, it was possible to establish for each gene and de-velopmental stage the approximate equiva-lent point between the endogenous target mRNA and competitor added to the reac-tions. The equivalent point is identified when bands produced for the target and competi-tor templates show roughly the same inten-sity on agarose gel.
A
Based on these preliminary titration ex-periments, standard-curves were prepared at different concentrations. Since the expres-sion levels of MyoD and Myogenin showed wide variation among embryos from differ-ent developmdiffer-ental stages, standard-curves were constructed at three concentrations (10-6,
10-5 and 10-4 fmol). On the other hand, the
expression levels of Myf-5 and MRF4 were always close to 10-6 fmol and therefore
stan-dard-curves were constructed at this single concentration. Standard-curves for ß-actin
were prepared at the concentration of 10-2
fmol.
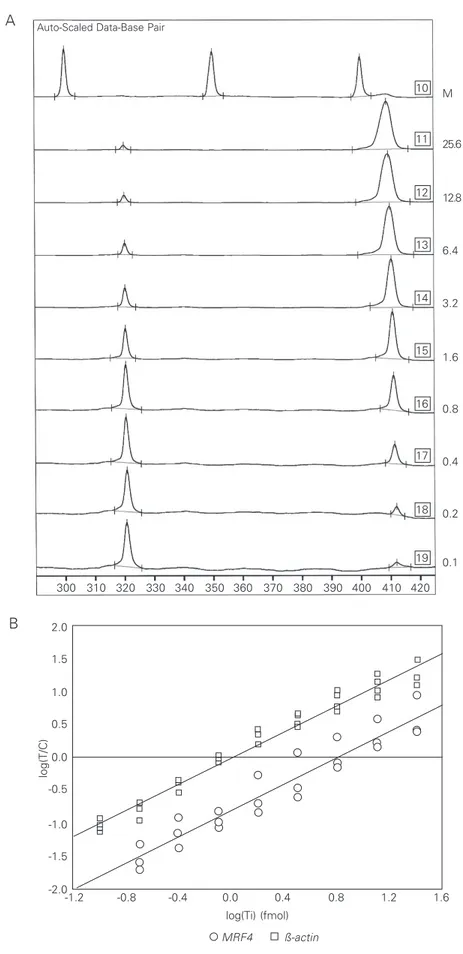
To construct the standard-curves, target cDNA was serially diluted (1:2) while the amount of competitor was kept constant in all PCR assays. Amplification products were separated on an automated DNA sequencer that measured the light emitted by the for-ward fluorescent primer and recorded it as peaks. Since peak areas are proportional to the amount of PCR products and are not related to the size of the amplified fragment, size correction was unnecessary. A typical electropherogram obtained for standard-curves is presented in Figure 4A.
Graphic representation of standard-curves was obtained by plotting the logarithm of the ratio of target to competitor peak areas [log(T/ C)] as a function of the amount of target
Figure 4. Construction of standard-curves of quantita-tive RT-PCR assays. A, The ß-actin standard-curve peaks after separation on a denaturing acrylamide gel. Note that areas of peaks of the competitor template gradually increased while the peaks of the target de-creased. Quantities ranging from 25.6 to 0.1 x 10⁻² fmol (serial dilution 1:2) of target cDNA were co-ampli-fied with 1 x 10⁻² fmol of competitor. Target and com-petitor templates were labelled with fluorescein. The number of boxes indicates the position of the line. Lane 10 shows the fluorescent 50-bp DNA molecular size marker (M). B, Graphic representation of ß-actin
and MRF4 standard-curves. The reactions were pre-pared at the concentration of 10-2 and 10-6 fmol, re-spectively. PCR products of ß-actin and MRF4 were separated and quantified after 15 and 35 PCR cycles. General linear equations: Y = 0.99x - 0.003 (ß-actin); Y = 1.00x - 0.805 (MRF4).
M
300 310 320 330 340 350 360 370 380 390 400 410 420 10
11
12
13
14
15
16
17
18
19 A Auto-Scaled Data-Base Pair
25.6
12.8
6.4
3.2
1.6
0.8
0.4
0.2
0.1
log(T/C)
2.0
1.5
1.0
0.5
0.0
-0.5
-1.0
-1.5
-2.0
-1.2 -0.8 -0.4 0.0 0.4 0.8 1.2 1.6
log(Ti) (fmol) B
cDNA initially added to the PCR [log(Ti)]. The equations from which the number of transcripts was calculated were determined by linear regression. As can be observed in Figure 4B, standard-curves form a straight line with slope close to 1 and intercepts varying for different curves. The intercept values of ß-actin standard-curves were al-ways close to zero, indicating that the rela-tive efficiencies of target and competitor templates were equivalent (Figure 4B). In contrast, the intercepts of MRF4 standard-curves showed a clear deviation from zero although the slopes remained close to 1 (Fig-ure 4B). The relative efficiency of all com-petitors (EC) used in the present study was
calculated based on intercept values obtained from standard-curves and assuming a theo-retical value equal to 1 for ET. The EC values
obtained for MyoD, Myf-5, MRF4 and
Myogenin indicate that competitors were
usually amplified more efficiently than the corresponding targets (Table 2).
The final step for MRF transcript quanti-fication in embryo cDNAs was the co-ampli-fication of each sample with a known amount of competitor. The gene expression values [log(Ti)] were obtained by replacing the Y
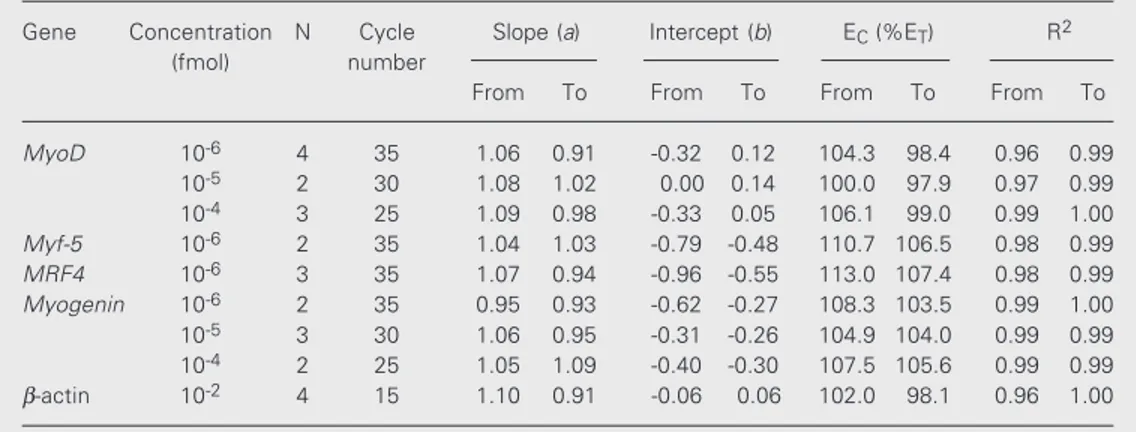
Table 2. Comparison of EC, slopes and intercepts obtained from standard-curves.
Gene Concentration N Cycle Slope (a) Intercept (b) EC (%ET) R2
(fmol) number
From To From To From To From To
MyoD 10-6 4 35 1.06 0.91 -0.32 0.12 104.3 98.4 0.96 0.99
10-5 2 30 1.08 1.02 0.00 0.14 100.0 97.9 0.97 0.99
10-4 3 25 1.09 0.98 -0.33 0.05 106.1 99.0 0.99 1.00
Myf-5 10-6 2 35 1.04 1.03 -0.79 -0.48 110.7 106.5 0.98 0.99
MRF4 10-6 3 35 1.07 0.94 -0.96 -0.55 113.0 107.4 0.98 0.99
Myogenin 10-6 2 35 0.95 0.93 -0.62 -0.27 108.3 103.5 0.99 1.00
10-5 3 30 1.06 0.95 -0.31 -0.26 104.9 104.0 0.99 0.99
10-4 2 25 1.05 1.09 -0.40 -0.30 107.5 105.6 0.99 0.99
β-actin 10-2 4 15 1.10 0.91 -0.06 0.06 102.0 98.1 0.96 1.00
The integration of peak areas provided the log(T/C) necessary to calculate standard-curve equations. The number of PCR cycles used to amplify serial dilutions of standard-curves as well as cDNAs samples are indicated. At least two independent standard-curves were prepared for each gene. N = number of independ-ent standard-curves. EC = efficiency of competitor amplification; ET = efficiency of target amplification; R2 = correlation coefficient.
Table 3. Quantification of MRF transcripts in whole chicken embryos.
*Expression level
Embryos MyoD Myf-5 MRF4 Myogenin
HH12 1 1.76 0.04 0.64 0.09
2 0.72 0.14 0.91 0.02
3 0.54 0.05 0.66 0.01
4 0.86 0.02 0.68 0.01
HH18 1 3.65 5.59 13.12 4.01
2 2.61 3.81 7.71 3.11
3 2.13 3.73 8.42 4.19
4 7.32 2.45 4.00 3.70
HH28 1 32.34 1.32 6.51 85.96
2 30.41 7.04 10.26 59.22 3 33.59 7.16 8.67 84.30 4 41.67 9.45 6.16 54.76
*Results were normalized and reported as mol-ecules of specific transcripts per 104ß-actin tran-scripts.
value of standard-curve equations with the logarithmic ratio of target to competitor peak areas [log(T/C)]. The level of transcripts for the different MRFs was determined in em-bryos from stages HH12, HH18 and HH28 (Table 3). All values were normalized for
ß-actin content, allowing correction for
The intra-assay variability of competi-tive RT-PCR experiments was evaluated by making replicate measurements of single RNA samples in independent assays (6 to 9 replicates). The coefficient of variation esti-mated for ß-actin, MyoD/Myogenin and Myf-5/MRF4 was roughly 6, 10 and 19%, respec-tively. The higher level of intra-assay varia-bility observed for Myf-5 and MRF4 was probably related to the low concentration of these transcripts in the cDNA samples ana-lyzed.
Discussion
In this paper we describe a competitive RT-PCR assay based on the use of standard-curves to quantify MRF transcripts in chicken embryos. Standard-curves consist of a set of reference reactions containing serial dilu-tions of the target template, which are co-amplified with a constant amount of com-petitor (31). In contrast, for most RT-PCR procedures that require three to five PCR assays for each measurement, the use of standard-curves permits transcript quantifi-cation in a single reaction containing known amounts of competitor template. After am-plification, the initial number of target mol-ecules in the sample is calculated from the ratio between target and competitor PCR products using linear equations obtained for each gene. Therefore, it is possible to quan-tify multiple transcripts in a single cDNA sample. Although other investigators have previously reported the use of competitive RT-PCR with standard-curves to quantify gene expression (30,31), the present paper is the first that provides a detailed mathemati-cal description of the method. Furthermore, there is no report of the application of this methodology to the simultaneous quantifi-cation of MRFs in cDNAs of single embryos. Standard-curves are obtained by relating the ratio between the amounts of synthesized products [log(T/C)] to the initial amount of target template [log(Ti)] in the sample. A
mathematical description of competitive PCR predicts that such curves must form a straight line defined by Y = ax + b. As deduced from Equation 3, another basic assumption to vali-date standard-curves is a slope value equal to one. Intercept b is defined as [n x log(1 + ET)/
(1 + EC)] and thus its value is related to the
relative amplification efficiency of target and competitor templates. If the relative amplifi-cation efficiency of target to competitor tem-plates is identical, the ratio [log(1 + ET)/(1 +
EC)] is equal to one and the intercept is equal
to zero. On the other hand, if EC differs from
ET there will be a preferential accumulation
of one particular PCR product and conse-quently the intercept value will deviate from zero. This means that equal amounts of com-petitor and target cDNAs in the sample will not result in products of equal intensity on the gel.
The relative amplification efficiency of the five target templates and the correspond-ing competitors employed in our quantita-tive assays was calculated (Table 2). Al-though the amplification efficiency of target and competitor templates is mainly deter-mined by the anchorage sites for primers (13), the fact that both templates share these sequences does not assure identical amplifi-cation rates. In fact, our experience and that of others (28,32) have shown that relative amplification efficiency may differ even when the competitor is closely similar to the target molecule. Since our competitors are smaller than the target templates, it is pos-sible that they have a relatively simpler ter-tiary structure that could result in a slightly faster denaturation during PCR. This could explain why the amplification efficiency of competitors in most of the genes under study was higher in comparison to those of target templates. Despite this fact, we used these competitors in our competitive RT-PCR as-says. This was possible because the EC value
essential requirement for measurement of gene expression using standard-curves. Ob-viously, this is an important advantage of the standard-curve method in comparison to more traditional competitive RT-PCR assays that require equal amplification efficiency for target and competitor (27,28,31).
Accurate quantification of mRNAs with standard-curves demands the selection of competitor concentration so that the target to be tested is within the range of values as-sayed in standard-curves. However, based on [log(Ti/Ci)], it can be seen that the con-centration range of target and competitor templates does not affect the standard-curve slopes, since the dilution values cancel each other. In our assays we observed that, as expected, the curves constructed for differ-ent concdiffer-entrations (e.g., 10-4, 10-5 and 10-6
fmol) were parallel to each other and sepa-rated on the X-axis by a distance of 1 (data not shown).
Careful control of the initial amount of RNA as well as RT efficiency is a critical step to assure the correct quantification of transcripts by RT-PCR. In fact, RT is the major source of variation in quantitative as-says since the efficiency of this process var-ies greatly between different samples (1,3). Several studies have reported the use of RNA molecules as competitors to correct samples for variations in RT efficiency (13,33-35). However, the instability of RNA makes it difficult to manage multiple RNA competitors that must be incorporated into single RT reactions in very precise quantities. Thus, we adopted the use of cDNA molecules as competitors in our competitive RT-PCR to simplify the laboratory work and to reduce the chance of erroneous quantifications due to degradation of RNA competitors. Varia-tions in RT efficiency and quantity of total RNA added to the RT reactions were nor-malized by measuring transcripts of the housekeeping ß-actin gene in the same cDNA samples in which MRFs were quantified.
To measure PCR products we used an
automatic sequencer, which allowed target and competitor products to be separated and subsequently quantified with the same equip-ment. Since target and competitor products were separated from each other on a dena-turing gel (as single-strand molecules), the formation of heteroduplexes was not ob-served despite the structural similarity be-tween competitor and target templates. The formation of heteroduplexes after several cycles of PCR can complicate the interpreta-tion of the competitive RT-PCR results (8,9). As also reported by Cammarota et al. (36), we observed that a higher input of PCR products resulted in underestimation of sig-nals, probably as a consequence of the fluo-rescent signal being above the capacity of the photodetectors. Thus, it is very important to dilute samples in the presence of overload signals. In fact, we observed that signal over-load caused the standard-curves to deviate from the predicted value of 1, precluding their use in quantitative assays.
Although MRFs are the main regulators of skeletal muscle development, acting on the determination and differentiation of muscle precursor cells, quantitative analyses of their expression are rare (37), probably due to the low level of transcripts and small size of biological samples. In the present paper we presented competitive RT-PCR assays developed for quantification of MyoD,
Myf-5, Myogenin and MRF4 transcripts in
whole chicken embryos. Due to its high sen-sitivity, competitive RT-PCR was able to measure even the reduced level of MRF
References
1. Freeman WM, Walker SJ & Vrana KE (1999). Quantitative RT-PCR: pitfalls and potential. Biotechniques, 26: 112-125.
2. Liu W & Saint DA (2002). A new quantitative method of real time reverse transcription polymerase chain reaction assay based on simulation of polymerase chain reaction kinetics. Analytical
Bio-chemistry,302: 52-59.
3. Foley KP, Leonard MW & Engel JD (1993). Quantification of RNA using the polymerase chain reaction. Trends in Genetics, 9: 380-385.
4. Price T, Aitken J & Simpson ER (1992). Relative expression of aromatase cytochrome P450 in human fetal tissues as determined by competitive polymerase chain reaction amplification. Journal of
Clinical Endocrinology and Metabolism, 74: 879-883.
5. Strehlau J, Pavlakis M, Lipman M, Shapiro M, Vasconcellos L, Harmon W & Strom TB (1997). Quantitative detection of immune activation transcripts as a diagnostic tool in kidney transplantation.
Proceedings of the National Academy of Sciences, USA, 94:
695-700.
6. Zhang J, Desai M, Ozanne SE, Doherty C, Hales CN & Byrne CD (1997). Two variants of quantitative reverse transcriptase PCR used to show differential expression of alpha-, beta- and gamma-fibrino-gen gamma-fibrino-genes in rat liver lobes. Biochemical Journal, 321: 769-775. 7. Steuerwald N, Cohen J, Herrera RJ & Brenner CA (1999). Analysis
of gene expression in single oocytes and embryos by real-time rapid cycle fluorescence monitored RT-PCR. Molecular Human
Repro-duction, 5: 1034-1039.
8. Gilliland G, Perrin S, Blanchard K & Bunn HF (1990). Analysis of cytokine mRNA and DNA: detection and quantification by competi-tive polymerase chain reaction. Proceedings of the National
Acade-my of Sciences, USA,87: 2725-2729.
9. Chelly J, Kaplan JC, Maire P, Gautron S & Kahn A (1988). Transcrip-tion of the dystrophin gene in human muscle and non-muscle tissue. Nature,333: 858-860.
10. Noonan KE, Beck C, Holzmayer TA et al. (1990). Quantitative analy-sis of MDR1 (multidrug reanaly-sistance) gene expression in human tu-mors by polymerase chain reaction. Proceedings of the National
Academy of Sciences, USA,87: 7160-7164.
11. Murphy LD, Herzog CE, Rudick JB, Fojo AT & Bates SE (1990). Use of the polymerase chain reaction in the quantification of mdr-1 gene expression. Biochemistry, 29: 10351-10356.
12. Gaudette MF & Crain WR (1991). A simple method for quantifying specific mRNAs in small numbers of early mouse embryos. Nucleic
Acids Research, 19: 1879-1884.
13. Wang AM, Doyle MV & Mark DF (1989). Quantification of mRNA by polymerase chain reaction. Proceedings of the National Academy of
Sciences, USA, 86: 9717-9721.
14. Becker-Andre M & Hahlbrock K (1989). Absolute mRNA quantifica-tion using the polymerase chain reacquantifica-tion (PCR): A novel approach by a PCR aided transcript titration assay (PATTY). Nucleic Acids
Research, 17: 9437-9446.
15. Heid CA, Stevens J, Livak KJ & Williams PM (1996). Real time quantitative PCR. Genome Research, 6: 986-994.
16. Gibson UE, Heid CA & Williams PM (1996). A novel method for real time quantitative RT-PCR. Genome Research, 6: 995-1001. 17. Arnold HH & Braun T (2000). Genetics of muscle determination and
development. Current Topics in Developmental Biology, 48: 129-164.
18. Stockdale FE, Nikovits Jr W & Christ B (2000). Molecular and cellular biology of avian somite development. Developmental
Dy-namics, 219: 304-321.
19. Perry RL & Rudnick M (2000). Molecular mechanisms regulating myogenic determination and differentiation. Frontiers in Bioscience, 5: D750-D767.
20. Hamburger V & Hamilton HL (1951). A series of normal stages in the development of the chick embryo. Journal of Morphology, 88: 49-92.
21. Lin ZY, Dechesne CA, Eldridge J & Paterson BM (1989). An avian muscle factor related to MyoD1 activates muscle-specific promot-ers in nonmuscle cells of different germ-layer origin and in BrdU-treated myoblasts. Genes and Development, 3: 986-996.
22. Saitoh O, Fujisawa-Sehara A, Nabeshima Y & Periasamy M (1993). Expression of myogenic factors in denervated chicken breast muscle: isolation of the chicken Myf5 gene. Nucleic Acids
Re-search, 21: 2503-2509.
23. Fujisawa-Sehara A, Nabeshima Y, Komiya T, Uetsuki J, Asakura A & Nabeshima Y (1992). Differential trans-activation of muscle-specific regulatory elements including the myosin light chain box by chicken MyoD, myogenin, and MRF4. Journal of Biological Chemistry, 267: 10031-10038.
24. Fujisawa-Sehara A, Nabeshima Y, Hosoda Y, Obinata T & Nabeshima Y (1990). Myogenin contains two domains conserved among myogenic factors. Journal of Biological Chemistry, 265: 15219-15223.
25. Kost TA, Theodorakis N & Hughes SH (1983). The nucleotide se-quence of the chick cytoplasmic beta-actin gene. Nucleic Acids
Research, 11: 8287-8301.
26. Lin-Jones J & Hauschka S (1996). Myogenic determination factor expression in the developing avian limb bud: an RT-PCR analysis.
Developmental Biology, 174: 407-422.
27. Raeymaekers L (1993). Quantitative PCR: theoretical considerations with practical implications. Analytical Biochemistry, 214: 582-585. 28. Connolly AR, Cleland LG & Kirkham BW (1995). Mathematical
con-siderations of competitive polymerase chain reaction. Journal of
Immunological Methods, 187: 201-211.
29. Kotake S, Schumacher Jr HR & Wilder RL (1996). A simple nested RT-PCR method for quantification of the relative amounts of mul-tiple cytokine mRNAs in small tissue samples. Journal of
Immuno-logical Methods, 199: 193-203.
30. Zhao J, Araki N & Nishimoto SK (1995). Quantification of matrix Gla protein mRNA by competitive polymerase chain reaction using glyceraldehydes-3-phosphate dehydrogenase as an internal control.
Gene, 155: 159-165.
31. Tsai SJ & Wiltbank MC (1996). Quantification of mRNA using com-petitive RT-PCR with standard-curve methodology. Biotechniques, 21: 862-866.
32. Volkenandt M, Dicker AP, Banerjee D, Fanin R, Schweitzer B, Horikoshi T, Danenberg K, Danenberg P & Bertino JR (1992). Quan-tification of gene copy number and mRNA using the polymerase chain reaction. Proceedings of the Society for Experimental Biology
and Medicine, 200: 1-6.
33. Grassi G, Zentilin L, Tafuro S, Diviacco S, Ventura A, Falaschi A & Giacca M (1994). A rapid procedure for the quantification of low abundance RNAs by competitive reverse transcription-polymerase chain reaction. Nucleic Acids Research, 22: 4547-4549.
34. Mularoni A, Adessi GL, Arbez-Gindre F, Agnani G & Nicollier M (1996). Competitive RT-PCR to quantify CFTR mRNA in human endometrium. Clinical Chemistry, 42: 1765-1769.
multiple human cytochrome P450 mRNA molecules using competi-tive reverse transcriptase-PCR. DNA and Cell Biology, 17: 231-238. 36. Cammarota G, Da Prato L, Nicoletti E, Matteucci D, Bendinelli M & Pistello M (1996). Quantification of feline immunodeficiency provi-ruses in doubly infected cats using competitive PCR and a
fluores-cence-based RFLP. Journal of Virological Methods, 62: 21-31. 37. Kraus B & Pette D (1997). Quantification of MyoD, myogenin, MRF4