CLIMATE CHANGE AND “HISTORICAL RESPONSIBILITIES”
JOSÉ GOLDEMBERG1
PATRICIA MARIA GUARDABASSI2
Introduction
The United Nations Framework Convention on Climate Change (UNFCCC) commonly referred as Convention on Climate Change was adopted on May 9th 1992,
at the United Nations Headquarters, in New York, by the Intergovernmental Negotiating Committee (INC) and was opened for signature in June 1992 at the Rio de Janeiro Earth Summit. It was signed by Heads of State and other senior representatives from 154 countries (and the European Community) and entered into force on March 21st 1994.
One could then consider 1992 as the year at which a decision was taken by the signatories to achieve “stabilization of greenhouse gas concentrations at a level that would prevent dangerous anthropogenic interference with the climate system” (article 2 of the Convention).
A number of commitments were adopted in the Convention binding “all Parties, taking into account their common but differentiated responsibilities and their specific national and regional development priorities, objectives and circumstances” (article 4 of the Convention).
The developed countries (listed in the Annex I of the Convention) where committed to take actions “with the aim of returning individually or jointly to their 1990 levels these anthropogenic emissions of carbon dioxide and other greenhouse gas” (article 4 of the Convention) which, as is well known, didn’t occur.
The Convention determined also that the burden of the actions and assistance to developing country Parties should fall in the countries listed in Annex II (developed countries).
The Convention strengthened these commitments in 1997 through the Kyoto Protocol which established quantitative levels of reduction of at least 5% below the
1 Professor do Instituto de Eletrotécnica e Energia da Universidade de São Paulo. Av. Prof. Luciano Gualberto, 1289
Butantã CEP 05508-010 - São Paulo, SP - Brasil. (Instituto de Eletrotécnica e Energia da Universidade de São Paulo, SP - Brasil)
2 Pesquisadora do Centro Nacional de Referência em Biomassa. Av. Prof. Luciano Gualberto, 1289 - Cidade
1990 level, between 2008 and 2012, for the countries listed in Annex I of the Convention (developed countries and economies in transaction). Non-Annex I countries (developing countries were exempted from any mandatory reductions).
The year 1990 is the reference year in the Convention after which no country could argue ignorance of the adverse effects of the increased concentration of greenhouse gases in the atmosphere.
The rational for these decisions is stated in the preamble of the Convention which took note “that the largest share of historical and current global emissions of greenhouse gases has originated in the developed countries, that per capita emissions in developing countries are still relatively low and that the share of global emissions originating in developing countries will grow to meet their social and development needs”.
This is the only place in the Convention where mention is made of “historical emissions” which was largely used by developing countries, particularly China, to avoid taking actions to reduce their emissions or to reduce the rate of growth of such emissions. As a consequence, emissions from Annex I countries have grown at an approximate rate of 4.7% per year while emissions from Annex I remained relatively stable (Figure 1).
Figure 1: World Fossil-Fuel CO2 Emissions (1990 - 2005). Source: CDIAC, 2010
What we will do here is to analyze the significance of “historical emissions” in the last few decades as they relate to the objectives of the Climate Convention.
The evolution of the emissions of developing countries
We analyzed the total contribution of the CO2 emissions of Annex I and Non-Annex I (CO2 emissions represent approximately 70% of all greenhouse gases emissions).
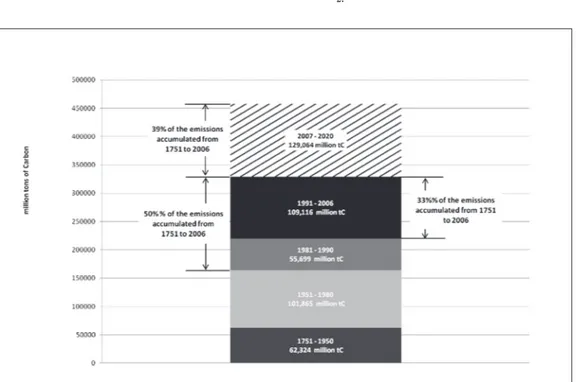
Figure 2 indicates such contribution in different intervals of time.
Figure 2: Cumulative emissions of CO2. Source: CDIAC, 2010
As can be seen the amount of CO2 emissions from 1750 up to 1980 doubled in the period 1980-2007.
If we extrapolate present CO2 emissions to 2020 one notices that emissions will double in the period 1990-2020 compared to emissions from 1750-1990.
What this means is that what happened in the past, until 1990, has not contributed overwhelmingly to total emissions since 1750.
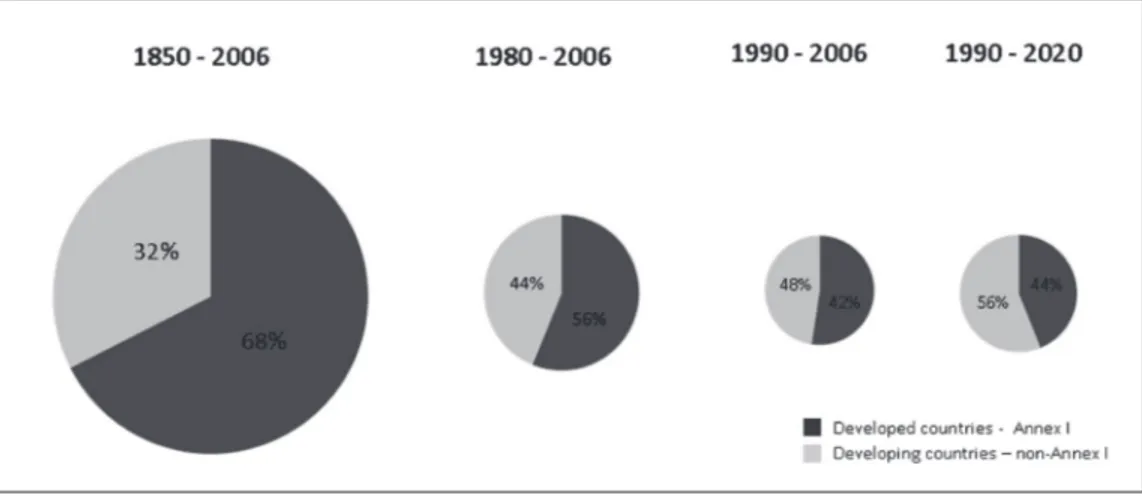
Figure 3: GHG Cumulative Emission. Source: CAIT, 2010
Conclusions
It is evident the growing importance of the share of the contribution of non-Annex I countries to CO2 emissions; therefore any “blame” such countries could put in Annex I countries as the main polluters of the past is very rapidly turning against them.
The “guilt” attributed to Annex I countries before 1990 anyway has a very shaky legal foundation because since ancient antiquity one cannot punish anyone before the nature of the violation is clearly established (Muller et al, 2007). As far as climate change is concerned, the year 1990 is the reference before which one really didn’t have a clear idea of the problems related to climate change and the role of anthropogenic activities.
The “historical responsibilities” argument has been used – somewhat perversely – to justify the lack of effort of non-Annex I Countries to follow a low carbon trajectory. The argument is that Annex I countries based their development on the unrestricted use of fossil fuels and that restrictions imposed now on their use by non- Annex I countries would hurt their efforts to develop. This is a distorted view of the reality. With new technologies in existence now – which were not available many decades ago – non-Annex I countries can develop “leapfrogging” many steps followed in the past by Annex I countries when they industrialized, incorporating clean low carbon technologies early in their process of development.
the low-lying island in the Pacific). In contrast “guilt” resulting in increasing greenhouse gas emissions – and one knows now quite well their consequences due to the work of IPCC – can still be reduced by serious mitigation actions in both Annex I and non-Annex I countries.
The Copenhagen Accord adopted in December 2009 has no mention of historical responsibilities.
References
CAIT (Climate Analysis Indicators Tools) 2010. Available at: http://cait.wri.org/. Access on February 22nd 2010.
CDIAC (Carbon Dioxide Information Analysis Center) 2010. Available at: http:// cdiac.ornl.gov/trends/emis/meth_reg.html. Access on February 23rd 2010.
MULLER, B.; HOHNE, N.; ELLERMANN, C. “Differentiating (Historic) Responsibilities for Climate Change” – Summary report. Oxford Institute for Energy Studies. 2007. Available at: http://www.oxfordclimatepolicy.org/publications/ DifferentiatingResponsibility.pdf
Copenhagen Accord (Decision-/CP.15), 2009. Available at: http://unfccc.int/files/ meetings/cop_15/application/pdf/cop15_cph_auv.pdf
United Nations Framework Convention on Climate Change, 1992. Available at: http:/ /unfccc.int/resource/docs/convkp/conveng.pdf
Abstract: The historical responsibility of countries listed in the Annex I of the Convention on Climate Change has been used extensively as a justification for the lack of action of countries not included in Annex I to reduce their greenhouse gas emissions. We analyzed the contribution of non-Annex I countries to the CO2 emissions in the period 1850 – 2006 to assess their relative contribution to total CO2 emissions. In the period 1980 – 2006 non-Annex I countries represented 44% of the total but this contribution increased in the period 1990 – 2006 to 48%. If we extrapolate present trends to 2020 they will represent 56% in the period 1990 – 2020. The “historical responsibility” of Annex I countries is therefore decreasing. If we take 1990 as the starting year in which the Climate Convention recognized clearly that greenhouse gases are interfering dangerously with the climate system, it becomes very difficult to attribute “blame” and “guilt” to Annex I for their historical contributions. It becomes also quite clear the need of non-Annex I countries to engage with Annex I countries in the effort to reduce emissions. The Copenhagen Accord has no mention of “historical responsibilities”.
Keywords: historical responsibilities, Copenhagen Accord, non-Annex I CO2 emissions.
Resumo: As responsabilidades históricas dos países do Anexo I da Convenção do Clima têm sido
utilizadas extensivamente pelos países que não fazem parte deste Anexo como justificativa para sua falta de ação a respeito da redução das emissões de gases de efeito estufa. Analisou-se aqui a contribuição de tais países nas emissões totais de CO2, no período 1850-2006, visando mensurar sua contribuição relativa. No período 1980-2006, os países que não são parte do Anexo I representaram 44% do total, mas esta contribuição aumentou, no período 1990-2006, para 48%. Extrapolando as tendências atuais para o ano 2020, tais emissões representarão 56% no período 1990-2020. Portanto, a “responsabilidade histórica” dos países do Anexo I está diminuindo. Ao considerarmos 1990 como o ano em que a Convenção do Clima reconheceu claramente que os gases de efeito estufa estão interferindo perigosamente com o sistema climático, se torna muito difícil atribuir “responsabilidade” e “culpa” aos países do Anexo I por sua contribuição histórica. Torna-se clara também a necessidade de engajamento dos países que não fazem parte do Anexo I, conjuntamente aos países do Anexo I, nos esforços de redução das emissões. O Acordo de Copenhague não faz menção a “responsabilidades históricas”.
CLIMATE CHANGE AND “HISTORICAL RESPONSIBILITIES”
JOSÉ GOLDEMBERG1