DOI: 10.5935/2359-4802.20170031
Introduction
The population older than 60 years is progressively increasing in our country and it is believed that by 2020 it will exceed 30 million individuals.1 This aging process entails numerous physiological and functional changes in the human body, hindering elderly individuals more susceptible to the development of chronic diseases, especially cardiovascular ones.2
Hypertension is one of the main clinical conditions harming the health of elderly individuals, and in
hypertensive elderly individuals, the cardiovascular risk is higher than that in normotensive ones of similar age.3 Genetic and environmental factors are associated with the chronic maintenance of elevated blood pressure (BP) levels, and this correlation in the hypertensive population is 30% and 70%, respectively.4 Hypertension may be considered a polygenic clinical condition in which changes in multiple genes interact with each other and with various other risk factors.5
The angiotensin-converting enzyme (ACE), a key component of the renin-angiotensin system
ORIGINAL ARTICLE
Mailing Address: Alanna Fernandes Paraiso
Rua dos Estudantes, 96 – Apt 305. Postal Code: 39401-082, Vila Santa Maria, Montes Claros, MG – Brazil E-mail: [email protected]; [email protected]
Hierarchical Analysis of Hypertension with the Polymorphic Variant of the ACE Gene
and Other Risk Factors in the Elderly
Breno Barreto Ribeiro,1 Pedro Eleutério dos Santos Neto,2 Jairo Evangelista Nascimento,1 João Marcus Oliveira
Andrade,1 Alanna Fernandes Paraíso,3 Sérgio Henrique Sousa Santos,4 Marise Fagundes Silveira,1 Andréa Maria
Eleutério de Barros Lima Martins1
Universidade Estadual de Montes Claros;1 Faculdades Unidas do Norte de Minas;2 Faculdades Santo Agostinho,3 Montes Claros, MG; Universidade
Federal de Minas Gerais,4 Belo Horizonte, MG – Brazil
Mnauscript received July 13, 2016, revised manuscript January 09, 2017, accepted Jaunary 25, 2017.
Abstract
Background: Hypertension is a clinical condition of multifactorial etiology that imposes serious harm to the health of elderly individuals. Despite the fact that cardiovascular disorders influence the development of hypertension in this age group, several other genetic and environmental factors have been described in the literature, including the polymorphic variant of the angiotensin-converting enzyme (ACE) gene and the distribution of body fat.
Objective: To assess the prevalence of hypertension among elderly individuals and its possible correlation with the I/D polymorphic variant of the ACE gene and other associated risk factors.
Methods: Population-based study using a hierarchical model and including 387 elderly individuals residing in the urban area of Ibiaí (Minas Gerais, Brazil).
Results: On statistical analysis, the polymorphic variant of the ACE gene was not associated with hypertension (p = 0.316). On the other hand, there was a significant association between hypertension and the variables female sex, absence of a partner, consumption of more than one portion of salt per day, and changes in body mass index and waist-to-hip ratio.
Conclusion: Although the polymorphic variant of the ACE gene showed no influence on the prevalence of hypertension in elderly individuals, some variables such as individual, socioeconomic, metabolic, and behavioral habits were associated with this condition.(Int J Cardiovasc Sci. 2017;30(1):52-60)
(RAS), converts the decapeptide angiotensin I into the octapeptide angiotensin II, the most powerful circulating vasoconstrictor in the human body. This way, ACE plays a fundamental role in BP control.6 Intraindividual serological levels of ACE remain stable, but its interindividual variation is high and is attributed to polymorphic ACE gene variants (DD > DI > II).7 It should be pointed out the lack of recent studies evaluating the association of these polymorphic variants with hypertension exclusively in elderly individuals.8
In addition to genetic factors, other factors have been reported as being a risk for hypertension: age above 60 years, gender (postmenopausal women), ethnicity (non-white skin color), diet, sedentary lifestyle, obesity, alcoholism, and smoking, among others.9 The interaction of these various factors over time contributes to the development and worsening of hypertension, and the greater the number of risk factors to which individuals are exposed, the higher their chance of becoming hypertensive.10
Therefore, the objective of this study was to assess the prevalence of hypertension among elderly individuals, and its possible correlation with the polymorphic variant I/D of the ACE gene and with other associated risk factors.
Methods
Study design
This was an epidemiological, cross-sectional, and population study including elderly individuals aged 60 years or more, resident and domiciled in the municipality of Ibiaí, north of Minas Gerais (MG), Brazil.
Procedure and instrument for data collection
The data collection was carried out between 2011 and 2012. The elderly individuals were evaluated by health professionals who were trained and calibrated (kappa = 0.63) to the demographic, socioeconomic, b e h a v i o r a l , a n t h r o p o m e t r i c , a n d l a b o r a t o r y characteristics, and genotypic variant of the polymorphic ACE. According to the 2010 census, a total of 505 elderly individuals aged 60 or more years were registered in the Primary Care Information System. Of the 479 names obtained from the Family Health Strategy (FHS) list, 449 (93.74%) were found. The registration also included 27 elderly people whose names were not listed, but who were nonetheless also added, yielding a total of
476 elderly individuals. Of these, 387 (84.31%) answered the questions and/or were assessed in regards to the main variable of interest in this study (hypertension).
The measurement of BP levels was conducted by the auscultatory technique with a calibrated sphygmomanometer. The BP measurements were performed with the individual seated and after a 5-minute rest. The individuals were questioned about being with an empty bladder, having avoided physical activity, food, smoking, ingestion of alcoholic beverages or coffee (at least 30 minutes before the measurement) and if they had taken drugs that could interfere with the mechanisms of BP regulation.11 A total of three BP measurements were obtained; the first was discarded and the mean of the second and third measurements was considered. The patients were instructed about the procedure beforehand, with an explanation of its steps and objectives. The diagnosis of hypertension was established in the presence of a mean diastolic BP ≥ 90 mmHg and/ or mean systolic BP ≥ 140 mmHg and/or use of systemic antihypertensive medication.11
To achieve the objective of the study, the variables were grouped into individual, socioeconomic, behavioral, metabolic, and health-related, as described below:
Individual: age (60 to 69 years and ≥ 70 years), sex (male and female), self-declared skin color (White/ Yellow and Brown/Black), I/D polymorphic variant (rs 4646994) of the ACE gene (II, DI, and DD). Socioeconomic: marital status (with a partner [married and stable union] and without a partner [single, widowed/divorced]), education (≥ 4 years and 0 to 3 years), household crowding (less than one person/room and more than one person/room), material goods (at least one material goods [house and/or automotive] or lack of material goods), work status (yes [employed, self-employed, informal work, retired/employed] and no [retired/without work, does not work/never worked, and unemployed]), and income (assessed by the monthly individual income in Brazilian real).
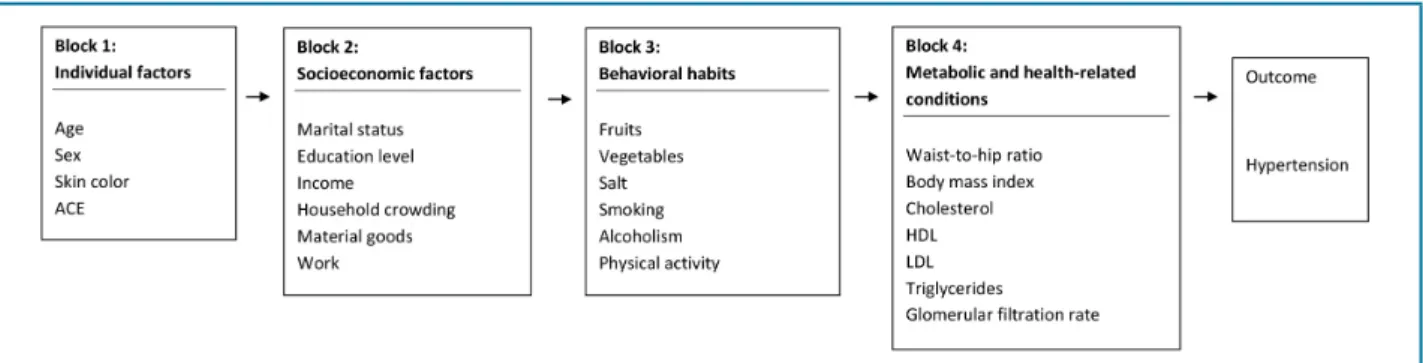
Figure 1 – Hierarchical model of variables analyzed in elderly individuals in Ibiaí municipality, MG. ACE: angiotensin-converting enzyme; HDL: high-density lipoprotein; LDL: low-density lipoprotein.
Metabolic and health-related: optimal total cholesterol (< 200 mg/dL), optimal high-density lipoprotein (HDL; women ≥ 50 mg/dL and men ≥ 40 mg/dL), optimal low-density lipoprotein (LDL; < 130 mg/dL), optimal triglycerides (< 150 mg/dL), and optimal waist-to-hip ratio (WHR; women < 0.85 and men < 0.95). We evaluated the glomerular filtration rate (GFR) using the Cockcroft-Gault formula: [GFR (mL/min) = (140 - age) x weight (kg)/72 x serum creatinine (multiply by 0.85 for female individuals)], in which values < 60 mL/min/1.73 m² are considered abnormal and ≥ 60 mL/min/1.73 m² are considered normal.13 The anthropometric variables weight and height were used to calculate the body mass index (BMI), with results < 25 kg/m2 considered as optimal.
ACE polymorphism evaluation – polymerase chain
reaction
In order to investigate the genotypic frequencies of the polymorphic variant I/D (rs 4646994) of the ACE gene (II, DI, and DD), saliva samples were obtained. Gene samples were obtained with a swab from buccal mucosa smears, which was stored at a temperature of -20 ºC in test tubes with Krebs solution. The samples were isolated with silica particles, which absorb the DNA. Subsequently, the DNA was washed to remove impurities and suspended with TE buffer. The genomic DNA was amplified with the polymerase chain reaction (PCR) technique.
Statistical analysis
All data were tabulated and analyzed using the program Statistical Package for the Social Sciences for
Windows, version 20.0. The variables investigated were described as distributions of frequencies. In the univariate analysis, we estimated the crude odds ratios values with 95% confidence intervals. The variables with descriptive level p ≤ 0.20 were selected for the multivariate analysis. In the multivariate analysis, we adopted the model of hierarchical logistic regression, and the order of entry of the blocks was determined from a theoretical model and involved known factors associated with hypertension.11 For the hierarchical analysis in this study, we followed the diagram shown in Figure 1, which guided the order of entry of the variables blocks in the model. The block “individual factors” was the first to be included in the model and remained as a factor of adjustment for the other variables. We then included “socioeconomic factors”, and only those presenting a descriptive level p < 0.05 remained in the model after adjustment for the variables in the “individual factors” block. After that, we included the “behavioral habits” block and maintained in the model only those variables with descriptive level p < 0.05 after adjustment for “individual factors” and “socioeconomic factors”. For inclusion of the remaining blocks, we adopted the same procedure of the previous blocks.
Ethical aspects
Results
The prevalence of hypertension among the 387 elderly individuals evaluated was 76%. As for the individual characteristics, the following ones prevailed: age range of 60-69 years (n = 131, 78.7%), females (n = 184, 80.7%), skin color brown/black (n = 252, 77.3%), and genotype II (n = 67, 82.7%). Most subjects lived without a partner (n = 155, 82%), had a low education level (n = 231, 76.2%), lived in households with little crowding (n = 251, 75.8%), had at least one material goods (n = 269, 75.8%), did not work (n = 212, 77.4%), and had an average income of R$ 531.97 ± 219.86 (Table 1).
As for behavioral habits, low consumption of vegetables (n = 225, 76.5%) stood out, whereas the consumption of salt was within the level considered as ideal (n = 206, 80.2%). Most participants did not consume alcohol (n = 173, 77.6%) and were not smokers (n = 178, 78.8%). Among metabolic and health-related conditions, most subjects showed change in BMI (n = 134, 81.2%), WHR (n = 209, 80.1%), and GFR (n = 143, 76.9%) (Table 2).
In the univariate analysis, the age range of 60-69 years showed a positive association with hypertension, with women having a greater chance of hypertension when compared with men. Elderly individuals without a partner also showed this association, as well as those who had altered BMI and WHR (Tables 1 and 2). In this study, the distribution of the polymorphic variant I/D of the ACE gene showed no association with hypertension (p = 0.316).
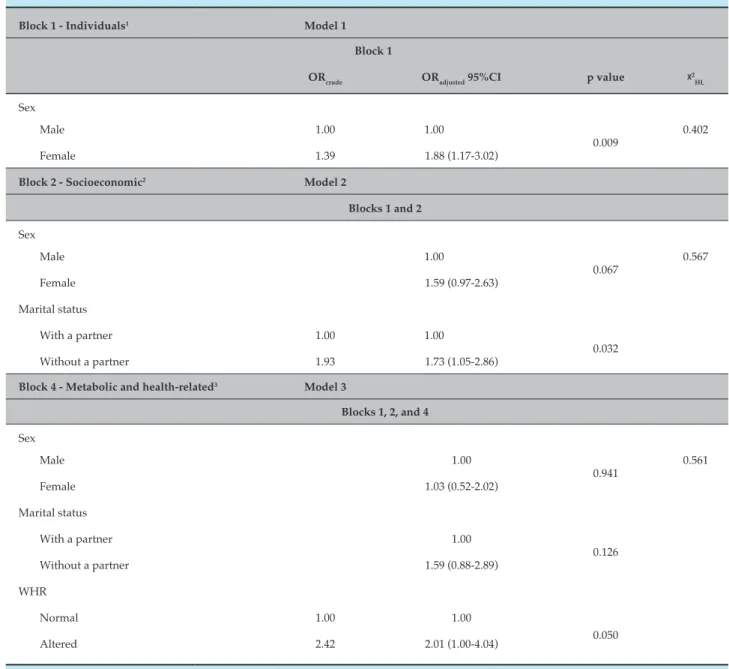
In the multiple logistic regression analysis after hierarchical adjustment, the following variables were maintained in the model after presenting statistically significant differences: gender, marital status, and WHR. The remaining variables lost the effect after this adjustment (Table 3).
Discussion
The hierarchical approach is an alternative applicable to epidemiological studies with a large number of variables. This study attempted to establish an interrelationship between several risk factors and at various levels, evaluating the importance of each block on hypertension. The main findings of this study indicate a prevalence of 76% of hypertensive elderly patients in the
population studied, with a significant association with greater involvement of the disease in elderly individuals who were female, had no partner, consumed more than one portion of salt per day, and with changes in the WHR and BMI indices.
The present study found no association between hypertension and the I/D polymorphic variant of the ACE gene. Studies assessing the association of this polymorphic variant with hypertension in elderly individuals are scarce and show no relationship; in this sense, this study corroborated the results of this literature suggesting, perhaps, a slight genetic influence of this variant in increased BP in this age range.14
Our findings corroborate those of another Brazilian epidemiological study that showed a prevalence of hypertension of approximately 65% in the elderly, with a higher prevalence among women older than 75 years, potentially reaching 80%.15 In the present research, this clinical condition was similar to that observed in other population studies.9,16
The greatest chance of presenting hypertension was observed in women (p = 0.009). The literature highlights a greater prevalence of hypertension among elder women when compared with men at the same age.9 A previous study had already demonstrated this greater probability of association with hypertension.17 Up until menopause, women are hemodynamically younger than men at the same age and, thus, less vulnerable to BP increases. However, after menopause and due to weight gain and hormonal changes, women become more vulnerable to increased BP.18
Table 1 – Distribution of non-hypertensive and hypertensive elderly individuals according to individual and socioeconomic factors (Ibiaí, MG)
Non-hypertensive Hypertensive Total ORcrude 95%CI p value
n % n %
Individual factors
Age
60-69 years 44 21.3 163 78.7 207 1.00
0.171
≥ 70 years 49 27.2 131 71.8 180 1.39 (0.87-2.21)
Sex
Male 49 30.8 110 69.2 159 1.00
0.009
Female 44 19.3 184 80.7 228 1.86 (1.16-2.98)
Skin color
White/Yellow 19 31.1 42 68.9 61 1.00
0.156
Brown/Black 74 22.7 252 77.3 326 1.54 (0.84-2.80)
ACE*
II 14 17.3 67 82.7 81 1.00
0.316
DI 31 24.8 94 75.2 125 0.63 (0.31-1.28)
DD 35 25.9 100 74.1 135 0.60 (0.30-1.19)
Socioeconomic factors
Marital status
With a partner 59 29.8 139 70.2 198 1.00
0.007
Without a partner 34 18.0 155 82.0 189 1.93 (1.20-3.13)
Education*
≥ 4 years 19 26.4 53 73.6 72 1.00
0.640
0-3 years 72 23.8 231 76.2 303 1.15 (0.64-2.07)
Home crowding*
< 1 person/room 80 24.2 251 75.8 331 1.00
0.839
≥ 1 person/room 12 25.5 35 74.5 47 0.93 (0.46-1.88)
Material goods*
Has 86 24.2 269 75.8 355 1.00
0.840
Does not have 6 26.1 17 73.9 23 0.90 (0.35-2.37)
Work*
Works 30 29.1 73 70.9 103 1.00
0.191
Does not work 62 22.6 212 77.4 274 1.40 (0.84-2.34)
Income (mean ± SD) 511.73±506.42 531.97±219.86 1,00 0.597
1.00 (0,99-1.00)
Table 2 – Distribution of non-hypertensive and hypertensive elderly individuals according to behavioral, metabolic, and health-related factors (Ibiaí, MG)
Non-hypertensive Hypertensive Total ORcrude 95%CI p value
n % n %
Behavioral habits
Fruit*
More than 3x/day 11 22.0 39 78.0 50 1.00
0.756
Less than 3x/day 73 24.0 231 76.0 304 0.89 (0.43-1.83)
Vegetables*
More than 3x/day 15 25.0 45 75.0 60 1.00
0.800
Less than 3x/day 69 23.5 225 76.5 294 1.09 (0.57-2.07)
Salt intake*
One portion/day 51 19.8 206 80.2 257 1.00
0.004
More than one portion/day 33 34.4 63 65.6 96 0.47 (0.28-0.80)
Alcoholism*
Does not drink alcohol 50 22.4 173 77.6 223 1.00
0.099
Drinks alcohol 15 34.1 29 65.9 44 0.56 (0.28-1.12)
Smoking*
Non-smokers 48 21.2 178 78.8 226 1.00
0.126
Smokers 44 28.0 113 72.0 157 0.69 (0.43-1.11)
Physical activity*
Active 22 24.2 69 75.8 91 1.00
0.995
Inactive 69 24.2 216 75.8 285 1.00 (0.57-1.73)
Metabolic and health-related conditions
WHR*
Normal 41 37.6 68 62.4 109 1.00
0.000
Altered 52 19.9 209 80.1 261 2.42 (1.48-3.96)
BMI*
Normal 55 29.6 131 70.4 186 1.00
0.019
Altered 31 18.8 134 81.2 165 1.81 (1.10-3.00)
Cholesterol*
Optimal 42 25.5 123 74.5 165 1.00
0.807
Risk 40 26.7 110 73.3 150 0.94 (0.57-1.55)
HDL*
Optimal 35 31.0 78 69.0 113 1.00
0.156
Risk 44 23.5 143 76.5 187 1.46 (0.86-2.46)
LDL*
Optimal 40 26.1 113 73.9 153 1.00
0.939
Risk 39 26.5 108 73.5 147 0.98 (0.59-1.64)
Triglycerides*
Optimal 38 30.4 87 69.6 125 1.00
0.151
Risk 43 23.1 143 76.9 186 1.45 (0.87-2.42)
GFR*
Normal 38 30.4 87 69.6 125 1.00
0.151
Altered 43 23.1 143 76.9 186 1.45 (0.87-2.42)
Table 3 – Results of the hierarchical logistic multiple regression analysis (Ibiaí, MG)
Block 1 - Individuals1 Model 1
Block 1
ORcrude ORadjusted 95%CI p value ᵡ 2
HL
Sex
Male 1.00 1.00
0.009
0.402
Female 1.39 1.88 (1.17-3.02)
Block 2 - Socioeconomic2 Model 2
Blocks 1 and 2
Sex
Male 1.00
0.067
0.567
Female 1.59 (0.97-2.63)
Marital status
With a partner 1.00 1.00
0.032
Without a partner 1.93 1.73 (1.05-2.86)
Block 4 - Metabolic and health-related3 Model 3
Blocks 1, 2, and 4
Sex
Male 1.00
0.941
0.561
Female 1.03 (0.52-2.02)
Marital status
With a partner 1.00
0.126
Without a partner 1.59 (0.88-2.89)
WHR
Normal 1.00 1.00
0.050
Altered 2.42 2.01 (1.00-4.04)
OR: odds ratio; CI: confidence interval; ᵡ2
HL: Hosmer-Lemeshow test; WHR: waist-to-hip ratio.
1Adjusted by individual variables among each other; 2Set by individual factors; 3Adjusted by personal and socioeconomic factors.
After control for socioeconomic factors, the variable gender lost the strength of its association (p = 0.067), while marital status (p = 0.032) was shown to be statistically significant. There are few studies specifically correlating marital status with hypertension.21,22 In the present study, elderly individuals without a partner had a greater chance of hypertension and one of the possible explanations may be the fact that the elderly living alone has a greater probability of having emotional
disturbances, influencing the BP increase.23 However, it is worth noting that in another study, the greatest risk of hypertension was observed among married individuals or among those living with a partner.17
individuals is still a reality, especially among women.26 Munaretti et al.24 published the first population-based and domici liar study verifying an association between hypertension and anthropometric indicators of fat (corporal and abdominal) in elderly Brazilians. In that study, fat anthropometric indicators (corporal and abdominal) were associated with hypertension, corroborating the results of other studies conducted with individuals from different po pulations and age groups, which found that excess fat, regardless of the anthropometric indicator used, is one of the main risk factors for hypertension.27-29 Although no consensus exists on an adequate criteria and values to define obesity among the elderly, BMI is the indicator most often used in epi demiological studies at this age range.28 However, some authors have suggested that BMI alone is unable to identify the association between body fat and hypertension.30
Similarly, in a study conducted with 9,936 men and 12,154 women aged 45 to 79 years, the indicators WHR and BMI showed an association with hypertension.28 Such fact can probably be explained by the physiological changes that occur in obese individuals, such as the activation of the sympathetic nervous system, the SRA, endothelial dysfunction, and insulin resistance (increasing tubular sodium reabsorption).28 It should be emphasized that the predominance of obesity tends to be higher in lower socioeconomic classes, as was the case in the population investigated.30
The fact that the other study variables showed no association strength with hypertension may be due to the sample size and the possibilities of selection biases and/or information involving confounding factors and occasional findings from the analysis, which constitute limitations of observational studies in general.
Conclusion
Although the polymorphic ACE variant did not influence the prevalence of hypertension in elderly individuals, this condition was associated with risk
factors such as female gender and marital status (absence of a partner), and modifiable risk factors such as excessive salt consumption and alterations in WHR and body weight. The study proposes the adoption of a healthy lifestyle to prevent the disease, since modifiable factors correlated significantly with hypertension. In addition, studies addressing this issue in population groups at greatest risk are fundamental in improving the knowledge of genetic polymorphisms in the etiology of the disease.
Author contributions
Conception and design of the research: Ribeiro BB, Santos Neto PE, Nascimento JE, Santos SHS, Martins AMEBL; Acquisition of data: Ribeiro BB, Santos Neto PE, Nascimento JE, Andrade JMO, Paraíso AF, Silveira MF, Martins AMEBL; Analysis and interpretation of the data: Ribeiro BB, Santos Neto PE, Nascimento JE, Andrade JMO, Paraíso AF, Santos SHS, Silveira MF, Martins AMEBL; Statistical analysis: Ribeiro BB, Nascimento JE, Martins AMEBL; Writing of the manuscript: Ribeiro BB, Santos Neto PE, Andrade JMO, Paraíso AF, Martins AMEBL; Critical revision of the manuscript for intellectual contente: Ribeiro BB, Santos Neto PE, Andrade JMO, Paraíso AF, Santos SHS, Silveira MF, Martins AMEBL.
Potential Conflict of Interest
No potential conflict of interest relevant to this article was reported.
Sources of Funding
There were no external funding sources for this study.
Study Association
1. Instituto Brasileiro de Geografia e Estatística. (IBGE). Censo demográfico 2010: famílias e domicílios (resultados da amostra). Rio de Janeiro; 2011. [Acesso em 2014 dez 16]. Disponível em: http:// censo2010.ibge.gov.br
2. Silva ST, Ribeiro RC. Leading causes of the elderlies hospitalization
due to cardiocascular diseases into the UCOR. Arq Ciênc Saúde. 2012;19(3):65-70.
3. Franco R, Habermann F. Revisão/atualização em hipertensão arterial:
hipertensão arterial na terceira idade–importância clínica, diagnóstico e tratamento. J Bras Nefrol. 1997;19(1):84-8.
4. Rondinelli E, Moura Neto RS. Future perspectives: the paper of genetics
in the boarding of a hypertensive person. Rev SOCERJ. 2003;16(1):77-83.
5. van Rijn MJ, Schut AF, Aulchenko YS, Deinum J, Sayed-Tabatabaei
FA, Yazdanpanah M, et al. Heritability of blood pressure traits and the genetic contribution to blood pressure variance explained by four blood-pressure-related genes. J Hypertens. 2007;25(3):565-70.
6. Hubert C, Houot AM, Corvol P, Soubrier F. Structure of the
angiotensin I-converting enzyme gene. Two alternate promoters correspond to evolutionary steps of a duplicated gene. J Biol Chem. 1991;266(23):15377-83.
7. Rigat B, Hubert C, Alhenc-Gelas F, Cambien F, Corvol P, Soubrier F.
An insertion/deletion polymorphism in the angiotensin I-converting enzyme gene accounting for half the variance of serum enzyme levels. J Clin Invest. 1990;86(4):1343-6.
8. Almada BV, Braun V, Nassur BA, Ferreira TS, Paula F, Morelato
RL. Association of hypertension with polymorphism of angiotensin converting enzyme in elderly persons. Rev Bras Clin Med. 2010;8(4):320-2.
9. Zaitune MP, Barros MB, Cesar CL, Carandina L, Goldbaum M.
[Arterial hypertension in the elderly: prevalence, associated factors, and control practices in Campinas, São Paulo, Brazil]. Cad Saúde Pública. 2006;22(2):285-94.
10. Cipullo J, Martin JF, Ciorlia LA, Godoy MR, Cação JC, Loureiro AA,
et al. [Hypertension prevalence and risk factors in a Brazilian urban population]. Arq Bras Cardiol. 2010;94(4):519-26.
11. Petersen LC, Chinazzo H, Saldanha C, Basso M, Garcia P, Bartyholomay E, et al. Cardiovascular risk factors and comorbidities in cardiology outpatient in the metropolitan region of Porto Alegre, RS. Revista da AMRIGS (Porto Alegre). 2011;55(3):217-23.
12. Vinholes DB, Assunção MC, Neutzling MB. [Frequency of healthy
eating habits measured by the 10 Steps to Healthy Eating score proposed by the Ministry of Health: Pelotas, Rio Grande do Sul State, Brazil]. Cad Saude Publica. 2009;25(4):791-9.
13. Firmo JO, Uchoa E, Lima-Costa MF. [The Bambui Health and Aging
Study (BHAS): factors associated with awareness of hypertension among older adults]. Cad Saude Publica. 2004;20(2):512-21.
14. Cooper RS, Wolf-Maier K, Luke A, Adeyemo A, Banegas JR, Forrester T et al. An international comparative study of blood pressure in populations of European vs African descedent. BMC Med. 2005;3:2.
15. Muraro AP, dos Santos DF, Rodrigues PR, Braga JU. [Factors associated
with self-reported systemic arterial hypertension according to VIGITEL in 26 Brazilian capitals and the Federal District in 2008]. Cien Saude Colet. 2013;18(5):1387-98.
16. Andrade C. Estrutura genética e desequilíbrio de ligação em africanos,
ameríndios e remanescentes de quilombos brasileiros estimados por novos STRs-X. [Tese]. São Paulo: Faculdade de Medicina de Ribeirão Preto. Universidade de São Paulo; 2013.
17. Pena SD, Di Pietro G, Fuchshuber-Moraes M, Genro JP, Hutz MH,
Kehdy Fde S, et al. The genomic ancestry of individuals from different geographical regions of Brazil is more uniform than expected. Plos One. 2011;6(2):e17063.
18. Tobe SW, Kiss A, Szalai JP, Perkins N, Tsigoulis M, Baker B. Impact of
job and marital strain on ambulatory blood pressure results from the double exposure study. Am J Hypertens. 2005;18(8):1046-51.
19. Lipowicz A, Lopuszanska M. Marital differences in blood pressure
and the risk of hypertension among Polish men. Eur J Epidemiol. 2005;20(5):421-7.
20. Lindeman S, Hamalainem J, Isometsa E, Kaprio J, Poikolainen K,
Heikkinen M, et al. The 12-month prevalence and risk factors for major depressive episode in Finland: representative sample of 5,993 adults. Acta Psychiatr Scand. 2000;102(3):178-84.
21. Gryglewska B, Grodzicki T, Kocemba J. Obesity and blood pressure in
the elderly free-living population. J Hum Hypertens. 1998;12(9):645-7.
22. Redón J, Cea-Calvo L, Moreno B, Monereo S, Gil-Guillén V, Lozano JV,
et al; investigators of the PREV-ICTUS Study. Independent impact of obesity and fat distribution in hypertension prevalence and control in the elderly. J Hypertens. 2008;26(9):1757-64.
23. Stevens J. Impact of age on association between weight and mortality.
Nutr Rev. 2000;58(5):129-37.
24. Munaretti DB, Barbosa AR, Marucci MF, Lebrão ML. Hipertensão
arterial referida e indicadores antropométricos de gordura em idosos. Rev Assoc Med Bras. 2011;57(1):25-30.
25. Sarno F, Monteiro CA. [Relative importance of body mass index and
waist circumference for hypertension in adults]. Rev Saude Publica. 2007;41(5):788-96.
26. Redón J, Cea-Calvo L, Moreno B, Monereo S, Gil-Guillén V, Lozano JV,
et al; investigators of the PREV-ICTUS Study. Independent impact of obesity and fat distribution in hypertension prevalence and control in the elderly. J Hypertens. 2008;26(9):1757-64.
27. Björntorp P. Body fat distribution, insulin resistance, and metabolic
diseases. Nutrition. 1997;13(9):795-803.
28. Canoy D, Luben R, Welch A, Bingham S, Wareham N, Day N, et al. Fat distribution, body mass index and blood pressure in 22 090 men and women in the Norfolk cohort of the European Prospective Investigation into Cancer and Nutrition (EPIC-Norfolk) study. J Hypertens. 2004;22(11):2067-74.
29. Rahmouni K, Correia ML, Haynes WG, Mark AL. Obesity-associated
hypertension: new insights into mechanisms. Hypertension. 2005;45(1):9-14.
30. Organización Panamericana de la Salud. (OPS/OMS). La obesidad en
la pobreza: um nuevo reto para la salud pública – Washington DC; 2000. (Publicación Científica nº 576).