439
Abstract
The clustering of discontinuity sets is not always a trivial task, especially when only the pole density diagram is used, the classical method. This process is extremely subjective since the size of the counting circle, the pole overlapping, and the presence of outliers between families make it difficult to define their characteristics. In these cases, it is useful to apply numerical and classical methods together. For that, this article pro-poses an algorithm based on the Fuzzy K-means method that allows the clustering of the discontinuities without the influence of these factors. The algorithm had its results compared to two fracture sets studied in literature and it has proved its efficiency.
Keywords: Discontinuity families; Fuzzy K-means; Clustering analysis
Resumo
O agrupamento de descontinuidades em famílias nem sempre é uma tarefa tri-vial, particularmente quando se utiliza apenas o diagrama de densidade de polos, método clássico. Este é extremamente subjetivo, uma vez que o tamanho da área da célula de contagem, a sobreposição de polos e a presença de outliers entre as famí-lias dificultam a definição de suas características. Nesses casos, é útil a aplicação de métodos numéricos em consonância com o método clássico. Para isso, esse traba-lho propõe um algoritmo baseado no Método Fuzzy K-means, que permite reunir as descontinuidades em famílias sem a influência desses fatores. O algoritmo teve seus resultados comparados com dois conjuntos de fraturas estudados na literatura e demonstrou-se eficiente.
Palavras-chave:famílias de descontinuidades; Fuzzy K-means; análise de
agrupa-mentos.
André Monteiro Klen
Mestre em Engenharia Mineral e Doutorando em Geotecnia Instituto Federal de Ouro Preto [email protected]
Milene Sabino Lana
Doutora em Tecnologia Mineral Universidade Federal de Ouro Preto [email protected]
Fuzzy Algorithm
of discontinuity sets
Algoritmo Fuzzy para agrupamento numérico
de descontinuidades em famílias
Mining
Mineração
1. Introduction
The grouping of discontinuities in sets and the identification of their aver-age orientation value are important tasks in geotechnical engineering, since the discontinuity sets define the system that controls the mechanical and hydraulical behavior of rock masses.
In general, the definition of discon-tinuity sets or families involves the visual interpretation of pole density diagrams, the classical method, which is achieved from the geotechnical mapping of rock mass and the characterization of discon-tinuity orientations.
The recognition of discontinuity families applying pole density diagrams is widely employed. It involves the interpre-tation of density contour plots computed by counting the number of poles that fall inside a counting circle used to calculate the pole frequency. However, this method is very subjective and leads to different clustering of the discontinuities (HAM-MAH & CURRAN, 1998).
The subjectivity is directly related to the procedure used in the classical method as well as to the visual interpretation of pole density diagrams. The main factors
that influence the procedure in classical method are the size of counting circle, the overlapping between families and the outliers.
When defining discontinuity family sets, it is necessary to define whether an observation is considered as an outlier and if it must be removed from the data set for better efficiency of the method (LANA et al., 2009). In case of the definition of dis-continuity family sets outliers are not only associated to orientation measurement and codification mistakes, but they may indicate discontinuities with random dis-tribution, which do not belong completely to any of the families, due to a tectonic processes that originated in the rock mass.
The wrong allocation of the dis-continuities that are in the overlapping zone and the outliers in the families may influence the definition of the average ori-entation values, since they tend to distort the shape, size and density of the clusters (JAIN, 2010).
Moreover, the inherent subjectiv-ity due to overlapping and the outliers is worsened by the size of counting circle used to calculate pole frequency in con-tour plots. Usually the counting circle size used is 1% of the hemispheric projection. However, this is an arbitrary size and in many cases leads to a wrong separation of families.
As a rule, the size of the counting circle depends on the number of the
dis-continuities measured in the rock mass. The bigger the number of the observa-tions, and the smaller the size of counting circle, which results in a better visualiza-tion of families.
To try to solve this problem, FLINN (1958) proposed the relation 100/N to the counting circle size, where N is the number of discontinuities of the data set. However this relationship, although right, in many situations does not ensure the correct identification of families.
Therefore, the classical method is not entirely satisfactory in some cases, and it has led to the development of numerical techniques for the automatic identification of families without influence of the factor’s subjectivity (XU et al. 2012).
Among numerical techniques, cer-tainly the cluster analysis is the most suitable tool. It applies to multivariate elements and its goal is to divide the data set in clusters or families formed by simi-lar elements.
In order for the discontinuity sets to be part of families, it is necessarily a partitional algorithm, and the most indicated for cluster analysis is the Fuzzy K-means, since authors like HAMMAH & CURRAN (1998), JIMENEZ & SI-TAR (2006) and XU et al. (2012) have
proven this, confirming its efficacy in this particular case.
The choice of Fuzzy K-means is justi-fied because it clusters the discontinuities into families, and minimizes and allows the analysis of the factors of subjectivity from the classical method. The algorithm is linked with these factors in the follow-ing way:
• Overlapping between families:
the Fuzzy K-means algorithm accounts for the uncertainty of a discontinuity that at the same time belongs to more than one family.
• Size of counting circle: This
factor does not influence the results of the algorithm.
• Outliers: the algorithm applies
rules to identify these observations. Besides that, the algorithm does not need to know a priori the number of dis-continuity families, because it provides va-lidity indices that help identify this value.
Therefore, this work proposes an al-gorithm for discontinuity cluster analysis based on the Fuzzy K-means method that allows to identify the correct structure and number of families, their average orienta-tion values, the discontinuities that are in the overlapping zone, and the observations classified as outliers.
2. The fuzzy k-means method
The Fuzzy K-means method is the most important partitional algorithm and nowadays it is widely applied in many scientific fields. Easily imple-mentable, simple, efficient, and empiri-cally successful are the main reasons for its popularity.
This algorithm assigns, for each
ob-servation in data set, degrees of member-ship in the different clusters, which pro-vide information about the uncertainty of clustering. Thus, when an observation belongs to a cluster, it tends to have a high degree of membership to it and a low degree in the remaining clusters.
The degree of membership can be
regarded as a probability, and it gives values between zero and one to each ob-servation, from a function that depends on the distance between the observa-tion and the cluster centroid. Thus, the smaller the distance, the closer to one is the value of degree of membership and vice and versa.
Parameters of the fuzzy k-means method for the definition of discontinuity families.
The influence of five parameters on the proposed algorithm is discussed: the definition of the number of families; computation of their average orientations; the initialization method; the distance measure; and identification of the outliers; and the overlapping zone.
To this end, consider the dada set with N discontinuity orientations, origi-nally given, for example, in the format
Dip/Dip Direction and converted to di-rection cosines. Therefore, each resulting vector can be represented by Xi=(xi,yi,zi). Where xi,yi,zi are the direction cosines.
To this end, it is necessary to con-sider the originally given data set with Ndiscontinuity orientations, for example, in the format of Dip/Dip Direction, where they are converted into directional cosines, and where each resulting vector can be
represented by Xi=(xi,yi,zi).,whereby xi,yi,zi are the direction cosines.
The aim of the Fuzzy K-means method is to divide the discontinuity sets in K families through the minimization of the distance from the discontinuities and the center of the groups, seeking for regions with a high density of elements. To that end, the algorithm uses the following objective function:
(1)
The term d2(X
i, Vj) is the distance
between the discontinuity Xito the
cen-ter (average orientation) Vj of the family j. The degree of membership of
discon-tinuity i in the family j is given by uijm.
441 (2)
Distance measure
According to KLOSE et al. (2005), the choice of the distance measure is the key factor for the success of cluster anal-ysis, since it is responsible for assigning each discontinuity in the families.
For this reason, the distance is determined by the space in which
variables lie. As the discontinuities are represented on the surface of a unit sphere, this distance must measure the angle between them and the center of the families.
The algorithm employs the sine squared distance measure, Equation
3. It was proposed by HAMMAH & CURRAN (1998) and it is normally used by many researchers for the
analy-sis of orientation data, such as KLOSE
et al. (2005), JIMENEZ & SITAR (2006) and XU et al. (2012).
(3)
Where: Xi∙Vj): is the dot product of vec-tors Xi and Vj.
This measure is based on the acute
angle between vectors and it does not require reversal of signs in the calcula-tions in some particular situacalcula-tions,
its range is [0, 1] and the distance between two discontinuities never exceeds 90º.
Calculation of the families’ average orientations
During each iteration of the Fuzzy K-means method, the discontinuities are exchanged between families and the new group centers are then computed
according to the current cluster results. Moreover, the degree of membership is updated.
The calculation of the average
ori-entations is done using the eigenanalysis of the orientation matrix Sj (HAM-MAH & CURRAN, 1998).
(4)
In this way, the eigenvector ξj3 asso-ciated with the maximum eigenvalues of the Sj (τj1<τj2<τj3) is an excellent estimator
of Vj, and it will be the mean vector of the family j.
Besides that, the eigenanalysis avoids
the reversal of signs in the calculation of average orientations.
Validity indices
of fuzzification that controls the over-lapping between clusters; the bigger its value, the bigger is the intersection
between families.
Researchers such as HAMMAH & CURRAN (1998) and XU et al.
(2012) propose m=2.
The degree of membership is com-puted from Equation 2.
The Fuzzy K-means requires a priori information about the number of families so that the sets can be partitioned. How-ever, in many cases the information is little or does not exist. This problem is on the biggest challenges in the cluster analysis, and the appropriated solution is using the clusters validity indices. These indices seek for partitions with low variability and the maxim distance between their
clusters centers.
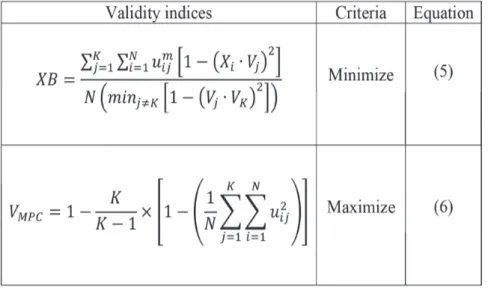
In order to select the correct number of clusters, the algorithm should be com-puted for different values of K and for each run, the validity indices are calculated. Thus the indices are presented graphically and the best K is defined from the criteria of optimization and comparison at the same time of all validity indices.
According to ZHANG et al. (2007),
Table 1 Validity indices
Identification of the outliers and the overlapping zone
As the sum of all membership de-grees of an observation is always equal to one, an outlier can be identified by having a membership value for all families close to 1/K. The observations in the overlapping zone have a membership degree close to 1/KI, where KI is the number of families
that share the same region and, therefore, the same observations.
The algorithm identifies and re-moves the outliers and the discontinuities in the overlapping zones to calculate the average orientations, establishing a mini-mum limit for inclusion of the
discontinu-ity in a family based on the membership degree. Reasonable values are included in the range [0.6; 0.7] because according to ZHANG et al. (2008), observations with a membership degrees greater than or equal to 0.6 are strongly associated with the family.
The initialization and the run of the Algorithm
The Fuzzy K-means method is highly influenced by the initial centers, because different choices of them can lead to different partition of the same data set. This is because the algorithm may or may not converge to a global minimum of the objective function. In addition, this problem is more pro-nounced in cases where the boundaries between clusters are unclear (HAM-MAH & CURRAN, 1998).
However, according to JA I N (2010), this problem can be solved by using an adaptive initialization method. Some of the most popular methods take into account the random generation of the initial centers far apart from each
other. Thus the proposed algorithm, for each run, generates one hundred sets with K initial vectors (centers) each, from the Fisher distribution for spheri-cal data with the mean (0, 0, 1) and concentration parameter equal to one.
In the next step, the algorithm seeks between the initial sets that which has the biggest minimum distance between their vectors and this set is selected to represent the initial centers of the families. Thus, after this param-eter explanation, the algorithm can be summarized into the following steps:
Thus, after the explanation of all of the parameters, the algorithm can be summarized into the following steps:
1. R a n d o m l y g e n e r a t e t h e initial centers.
2. Measure the distance between each discontinuity to the centers of the families, Equation (3).
3. Calculate the membership de-gree, Equation (2).
4. Identify the outliers and the discontinuities in the overlapping zone.
5. Update the family centers, Equation (4).
6. Repeat steps 2,3,4 and 5, until the maximum difference between the same centers in two consecutive runs are not less than 1º.
7. Calculate the validity indices, Equations (5, 6).
3. Results and discussions
The results of the algorithm are compared to two fracture sets described in the literature. The outliers and the
poles in the overlapping zone are rep-resented by red squares and the average orientations by the red circles. The
mini-mum degree of membership to include a discontinuity in a family in the two cases is 0.6.
Urban Slope: Curral Hill
These fracture sets are part of the studies of LANA et al. (2009) about an urban slope in the historical city of
Ouro Preto, Minas Gerais.
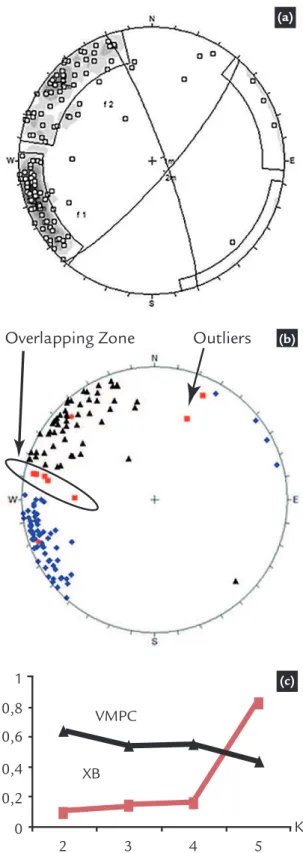
Figure 1 shows the pole density diagrams and the two established fami-lies using the classical method and the algorithm results.
When the Figures 1-a and 1-b are
compared, it is possible to note that the algorithm defines the families in the same way as LANA et al. (2009) do. In addition, Figure 1-c represents the behavior of the validity indices for five partitions and demonstrates that these correctly show K=2 is the best result.
Table 2 compares the average ori-entation values of the methods.
Observe that there is divergence
443 Figure 1
Clustering results: (a) Classical Method. (b) Algorithm results. (c) Validity indices.
When the Figures 1-a and 1-b are compared, it is possible to note that the algorithm defines the families in the same way as LANA et al. (2009) do. In addition, Figure 1-c represents the behavior of the validity indices for five
partitions and demonstrates that these correctly show K=2 is the best result.
Table 2 compares the average ori-entation values of the methods.
Observe that there is divergence
between the two methods only in the
Family 2, and this is because of the exclusion of discontinuities of the overlapping zone and the inclusion of nine others for the algorithm, which leads to a change in the calculation of average orientations.
Table 2: Clustering results of average orientations – Curral Hill
(a)
(b)
(c)
Overlapping Zone
Outliers
VMPC
XB
K 1
0,8
0,6
0,4
0,2
0
2 3 4 5
Families Classical Method Algorithm 1- 82/70
2-Figura 2:
Clustering results.
(a) SHANLEY & MAHTAB Method. (b) Algorithm results.
(c) Validity indices.
Table 3 compares the results of the proposed algorithm for the average
orientations with the results of SHAN-LEY & MAHTAB method (1978). It is
important to emphasize that the exclusion of observations influences the calculation
(c)
San manual cooper mine
In this case, the proposed algo-rithm is applied to a data set of fracture measurements from San Manual, a cooper mine in Arizona, USA, presented by SHANLEY & MAHTAB (1978). This data set is used as a benchmark for several clustering algorithms. The authors have considered partitions with
K=3 discontinuity sets (JIMENEZ & SITAR 2006).
Figure 2 compares the algorithm results with the results of the algorithms proposed by SHANLEY & MAHTAB (1978) because it is one of the first algorithms for clustering discontinuity
and is widely used today, KLOSE et al.
(2005).
The partitioning of the proposed algorithm suggests the presence of three families and classifies 71 observations as outliers or belonging the overlapping zone. It can be observed in Figure 2-c that validity indices correctly refer to three families.
(a)
(b)
VMPC
XB
K 0,5
0,4
0,3
0,2
0,1
0
445
Received: 6 September 2014 - Accepted: 25 October 2014.
FLINN, D. On tests of significance of preferred orientation in three-dimensional fa -bric diagrams. Journal of Geology, n.66, p. 526-539, 1958
HAMMAH, R.E., CURRAN, J.H. Fuzzy cluster algorithm for the automatic identi-fication of joint sets. International Journal of Rock Mechanics & Mining Sciences. V.35, n7, p. 889-905, 1998.
JAIN, A. K. Data clustering: 50 years beyond K-means. Pattern Recognition Letters. n.31, p. 651-666, 2010
JIMENEZ, R. R., SITAR N. A spectral method for clustering of rock discontinuity sets. International Journal of Rock Mechanics & Mining Sciences. n. 43, p. 1052-1061, 2006.
KLOSE, C.D., SEO, S., OBERMAYER, K. A new clustering approach for partitioning
directional data. International Journalof Rock Mechanics & Mining Sciences. n. 42,p. 315-321, 2005.
LANA, M.S., LEITE L.F., CABRAL I.E.Aplicação de métodos de agrupamento para definição de famílias de descontinuidades. Revista Brasileira de Geociências.v. 39, n. 4, p. 665-667, 2009.
SHANLEY, R. J., MAHTAB, M. A. Delineation and analysis of cluster orientation data. Mathematical Geology. v. 8, n. 1, p. 9-16, 1976.
XU, L.M., CHEN, J.P.,WANG, Q., ZHOU, F.J. Fuzzy C-means cluster analysis based
on mutative scale chaos optimization algorithm for the grouping of discontinuity sets. Rock mechanics and Rock Engineering. 2012 (Technical note).
ZHANG, Y., WANG, W., ZHANG, X., LI, Y. A cluster validity for fuzzy clustering. Information Sciences. n.178, p.1205-1218, 2007.
Due to the difficulties and uncer-tainness in the identification of the dis-continuity families using the pole density diagrams, it is necessary to use numerical methods to facilitate the diagrams inter-pretations and to minimize the factors of subjectivity, especially in cases where over-lapping and outliers are very noticeable.
Thus, this study proposes an al-gorithm based on the Fuzzy K-means method, that allows the automatic
clus-tering of the discontinuities into families, the identification of the outliers and the observations in the overlapping zone. Furthermore, the algorithm uses the valid-ity indices to assist the researcher in the definition of the number of clusters.
The results of the algorithm were compared to two fracture sets well defined in literature and it was shown to be coher-ent in the definition of: number, structure and average orientations of the families,
outliers and the overlapping zone. Therefore, the proposed algorithm is an important tool to assist the clustering of the discontinuities in families and to improve the understanding of the behav-ior of rock masses. The algorithm results should be in accordance with the geotech-nical surveys of the area, which means, the results should always be verified and validated by the structures observed in the field.
4. References
Families
SHANLEY & MAHATAB1Algorithm
82/70
80/132
303/81
303/73
77/135
82/70
2-
1-3- +
Table 3:
Clustering results of average orientations - San Manual
1Values reproduced
from KLOSE et al. (2005). of average orientations, Table 3, and that
this changes the layout of families, as
can be seen in Figure 2-b. The observa-tion of Figure 2 shows that the proposed