BGD
12, 13767–13791, 2015
Climate-driven shifts in continental net primary production
W. Buermann et al.
Title Page
Abstract Introduction
Conclusions References
Tables Figures
◭ ◮
◭ ◮
Back Close
Full Screen / Esc
Printer-friendly Version Interactive Discussion
Discussion
P
a
per
|
Discussion
P
a
per
|
Discussion
P
a
per
|
Discussion
P
a
per
|
Biogeosciences Discuss., 12, 13767–13791, 2015 www.biogeosciences-discuss.net/12/13767/2015/ doi:10.5194/bgd-12-13767-2015
© Author(s) 2015. CC Attribution 3.0 License.
This discussion paper is/has been under review for the journal Biogeosciences (BG). Please refer to the corresponding final paper in BG if available.
Climate-driven shifts in continental net
primary production implicated as a
driver of a recent abrupt increase
in the land carbon sink
W. Buermann1, C. Beaulieu2, B. Parida3, D. Medvigy4, G. J. Collatz5, J. Sheffield6, and J. L. Sarmiento4
1
Institute for Climate and Atmospheric Science, School of Earth and Environment, University of Leeds, Leeds LS2 9JT, UK
2
Ocean and Earth Science, National Oceanography Centre Southampton University of Southampton, Southampton SO14 3ZH, UK
3
Civil Engineering Department, Shiv Nadar University, Dadri, 203207 UP, India
4
Atmospheric and Oceanic Sciences Program, Princeton University, 08540 Princeton, New Jersey, USA
5
National Aeronautics and Space Administration, Goddard Space Flight Center, 20771 Greenbelt, Maryland, USA
6
BGD
12, 13767–13791, 2015
Climate-driven shifts in continental net primary production
W. Buermann et al.
Title Page
Abstract Introduction
Conclusions References
Tables Figures
◭ ◮
◭ ◮
Back Close
Full Screen / Esc
Printer-friendly Version Interactive Discussion
Discussion
P
a
per
|
Discussion
P
a
per
|
Discussion
P
a
per
|
Discussion
P
a
per
Received: 6 August 2015 – Accepted: 14 August 2015 – Published: 25 August 2015 Correspondence to: W. Buermann ([email protected])
BGD
12, 13767–13791, 2015
Climate-driven shifts in continental net primary production
W. Buermann et al.
Title Page
Abstract Introduction
Conclusions References
Tables Figures
◭ ◮
◭ ◮
Back Close
Full Screen / Esc
Printer-friendly Version Interactive Discussion
Discussion
P
a
per
|
Discussion
P
a
per
|
Discussion
P
a
per
|
Discussion
P
a
per
|
Abstract
The World’s ocean and land ecosystems act as sinks for anthropogenic CO2, and
over the last half century their combined sink strength grew steadily with increasing CO2emissions. Recent analyses of the global carbon budget, however, uncovered an abrupt, substantial (∼1 PgC yr−1) and sustained increase in the land sink in the late
5
1980s whose origin remains unclear. In the absence of this prominent shift in the land sink, increases in atmospheric CO2 concentrations since the late 1980s would have been∼30 % larger than observed (or∼12 ppm above current levels). Global data
anal-yses are limited in regards to attributing causes to changes in the land sink because different regions are likely responding to different drivers. Here, we address this
chal-10
lenge by using terrestrial biosphere models constrained by observations to determine if there is independent evidence for the abrupt strengthening of the land sink. We find that net primary production has significantly increased in the late 1980s (more so than heterotrophic respiration) consistent with the inferred increase in the global land sink, and that large-scale climate anomalies are responsible for this shift. We identify two
15
key regions in which climatic constraints on plant growth have eased: northern Eurasia experienced warming, and northern Africa received increased precipitation. Whether these changes in continental climates are connected is uncertain, but North Atlantic climate variability is important. Our findings suggest that improved understanding of climate variability in the North Atlantic may be essential for more credible projections
20
of the land sink under climate change.
1 Introduction
The world’s land ecosystems act as a major sink in the contemporary global carbon cy-cle and, hence, alleviate the rise of atmospheric CO2 concentrations from global CO2
emissions and as a consequence climate change (IPCC, 2013). Yet, while critical for
25
BGD
12, 13767–13791, 2015
Climate-driven shifts in continental net primary production
W. Buermann et al.
Title Page
Abstract Introduction
Conclusions References
Tables Figures
◭ ◮
◭ ◮
Back Close
Full Screen / Esc
Printer-friendly Version Interactive Discussion
Discussion
P
a
per
|
Discussion
P
a
per
|
Discussion
P
a
per
|
Discussion
P
a
per
change is still severely limited (Le Quéré et al., 2009). This is in part because multi-ple commulti-plex mechanisms can influence the carbon balance of terrestrial ecosystems, including changes in climate and land-use pattern (forest regrowth, fire suppression etc.), nitrogen deposition, and CO2 fertilization (Ciais et al., 2013). In this regard, it has been well documented that the land carbon sink (typically inferred as the
“resid-5
ual” in the global carbon mass balance of fossil fuel and net land use change (LUC) emissions, the atmospheric CO2 growth rate and oceanic uptake) is quite variable at decadal time scales (Denman et al., 2007). But, in recent global carbon budget studies with longer (∼last 5 decades) and annually resolved records a rather abrupt,
substan-tial (∼1 PgC yr−1) and sustained strengthening of the “residual” land carbon sink in the
10
late 1980s has been identified (Sarmiento et al., 2010; Beaulieu et al., 2012). Our over-all confidence in this prominent shift, however, is somewhat limited since the “residual” land sink is the most uncertain term in the global carbon budget. This is because un-certainties embedded in the individual budget terms (e.g. LUC emissions and oceanic uptake) propagate into estimates of the “residual” land carbon sink (Le Quéré et al.,
15
2013).
Here, we explore if there is further independent evidence for a late 1980s regime shift in the land carbon sink through analyzing carbon fluxes from biospheric models of various complexity and observational constraints. Our emphasis is on global pattern of net primary production (NPP) since this key carbon flux is known to be a robust driver
20
of carbon sink variability (Luyssaert et al., 2007; Zhao and Running, 2010). A particular focus is in identifying which land regions may have contributed to the potential shift and what underlying mechanisms may have caused it. Specifically, we analyze data-driven NPP fields based on an established satellite-constrained biogeochemical model as well as process-based NPP data from nine terrestrial biosphere models that participated
25
BGD
12, 13767–13791, 2015
Climate-driven shifts in continental net primary production
W. Buermann et al.
Title Page
Abstract Introduction
Conclusions References
Tables Figures
◭ ◮
◭ ◮
Back Close
Full Screen / Esc
Printer-friendly Version Interactive Discussion
Discussion
P
a
per
|
Discussion
P
a
per
|
Discussion
P
a
per
|
Discussion
P
a
per
|
2 Methods
2.1 Data and models
We analyze temporal patterns in various metrics of the terrestrial carbon cycle based on three independent data sources. First, we analyze data-driven NPP data based on simulations with the satellite-constrained biogeochemical
Carnegie-Ames-Stanford-5
Approach (CASA) model (van der Werf et al., 2006) for the period of available satellite vegetation data 1982–2011 (Zhu et al., 2013). This updated and extensively validated model runs at a 0.5◦ spatial resolution on a monthly time step. NPP is a measure
of the amount of carbon fixed by plants during photosynthesis and accumulated as biomass. The CASA model is conceptually relatively simple and a number of
poten-10
tially important processes and mechanisms, such as related to nutrients (e.g., carbon and nitrogen) are not considered explicitly (van der Werf et al., 2006). However, factors that influence vegetation productivity may be indirectly captured through the satellite-based fraction of available photosynthetically active radiation absorbed by plants (fA-PAR), a key driver in the NPP CASA light use efficiency parameterization (van der
15
Werf et al., 2006). This is demonstrated by a new study showing that trends in satellite-based vegetation cover are consistent with expectations of growth enhancement via the CO2fertilization effect (Donohue et al., 2013). Temporally varying driver data used for the CASA simulations include in addition to satellite-based fAPAR (fAPAR3g; Zhu et al., 2013) also land surface temperature (CRU TS3.21; Harris et al., 2014) as well
20
as precipitation and surface solar radiation. We pay particular attention to uncertainties in these observational-based datasets and corresponding effects on NPP estimates. While land surface temperature data are considered to be relatively robust, a substan-tial limitation is that presently only one consistent satellite fAPAR dataset exists that covers the last 3 decades (Zhu et al., 2013) which we consider a minimum record
25
BGD
12, 13767–13791, 2015
Climate-driven shifts in continental net primary production
W. Buermann et al.
Title Page
Abstract Introduction
Conclusions References
Tables Figures
◭ ◮
◭ ◮
Back Close
Full Screen / Esc
Printer-friendly Version Interactive Discussion
Discussion
P
a
per
|
Discussion
P
a
per
|
Discussion
P
a
per
|
Discussion
P
a
per
Greve et al., 2014; see Supplement Methods in the Supplement). Based on a final selection of driver datasets (1 fAPAR, 1 temperature, 3 precipitation and 3 solar radia-tion; see Table S3 in the Supplement) we performed multiple CASA simulations with all possible input combinations (a total of 9 simulations) and analyzed the NPP ensemble mean with our change point methodology. We used the spread in these simulations as
5
a measure of “observational-based” uncertainty. In a complementary analysis, we also analyzed the heterotrophic respiration (Rh) ensemble mean from these sets of CASA simulations. To ensure that the carbon pools are at steady state, the CASA model was spun up for 250 years using a driver climatology based on the early 80s (1982–1986). Second, we analyze a global carbon budget for the period 1959–2011 and
consist-10
ing of CO2 emissions from fossil fuel burning and cement production as well as net LUC emissions, atmospheric CO2 growth rates and oceanic uptake (Le Quéré et al.,
2013). Uncertainties in these budget terms are also provided and utilized to estimate uncertainties in net land uptake and the residual land sink (through the sum of squared errors).
15
Third, we analyze process-based NPP data based on ensembles of nine single ter-restrial biosphere models that participated in the recent TRENDY model intercompar-ison project (Sitch et al., 2015). Compared to CASA, the TRENDY models are sub-stantially more complex and also run at significantly shorter time steps to resolve the diurnal cycle needed when coupled within Earth system climate models (Sitch et al.,
20
2015). An important distinction is that in the TRENDY models vegetation characteris-tics (e.g. fAPAR) are simulated prognostically (unlike in CASA where such information is inferred from satellite observations). In the TRENDY experiments (Sitch et al., 2015) the models were driven with observed climate and atmospheric CO2data (S2) as well
as with observed atmospheric CO2 data only (S1) and in order to isolate the
variabil-25
BGD
12, 13767–13791, 2015
Climate-driven shifts in continental net primary production
W. Buermann et al.
Title Page
Abstract Introduction
Conclusions References
Tables Figures
◭ ◮
◭ ◮
Back Close
Full Screen / Esc
Printer-friendly Version Interactive Discussion
Discussion
P
a
per
|
Discussion
P
a
per
|
Discussion
P
a
per
|
Discussion
P
a
per
|
for model details see Sitch et al., 2015) and used the spread among them as a mea-sure of “model-based” uncertainty in our change point framework. Based on a recent comprehensive evaluation against observations, it was found that most of the TRENDY models are capable of simulating the short- and long-term first-order dynamics of the terrestrial carbon cycle (Piao et al., 2013).
5
2.2 Statistical methodology
We apply a consistent change point methodology on the various metrics of the terres-trial carbon cycle to identify pattern of regime shifts (characterized as abrupt, substan-tial and sustained changes) and to contrast them to patterns showing either no or more gradual changes. We thus determine in a first step the statistical model that best fits
10
the time series under investigation based on three options: (1) a constant mean, (2) a shift in the mean and 3) a linear trend. While there are numerous alternative statisti-cal models (e.g. shifting trends as seen in satellite vegetation data at lostatisti-cal to regional scales; Piao et al., 2011), our choice of these three models is based on our primary objective to identify large-scale pattern in global NPP fields that would be consistent
15
with the recently observed regime shift in the land carbon sink (Sarmiento et al., 2010; Beaulieu et al., 2012).
In the “shift in the mean” model the shift is located through a change point detection algorithm that includes discrimination against a trend and the background autocorre-lation (red noise) by considering all positions in a time series as a potential change
20
point from 5 to n-5, with n being the record length (Beaulieu et al. 2012b). In a previous study, we found that by restricting the search for change points in this manner detec-tion of spurious shifts at the beginning or end of a series can be avoided (Beaulieu et al. 2012a). In the change point method applied here, we also further developed the Beaulieu et al. (2012b) methodology to account for known explicit uncertainties in
25
BGD
12, 13767–13791, 2015
Climate-driven shifts in continental net primary production
W. Buermann et al.
Title Page
Abstract Introduction
Conclusions References
Tables Figures
◭ ◮
◭ ◮
Back Close
Full Screen / Esc
Printer-friendly Version Interactive Discussion
Discussion
P
a
per
|
Discussion
P
a
per
|
Discussion
P
a
per
|
Discussion
P
a
per
Adding additional parameters could in principle provide more information on the nature of the shift (e.g., smooth versus abrupt) but this would also make the model prone to overfitting given the rather short time series in this study.
The most likely model among the three statistical models fitted is determined based on the Schwarz Information Criterion (SIC), which compares their likelihoods with a
5
penalty for the number of parameters fitted. If the “shift in the mean” model seems the most likely, we calculate in a second step the direction and magnitude of the shifts (subtracting means prior and after the shift) and the correspondingP value by
integrat-ing the full uncertainty of the data usintegrat-ing Monte Carlo simulations. To perform the Monte Carlo simulation, we draw 1000 normally distributed synthetic series having the same
10
statistical properties as the time series of interest. A new feature is that the series are simulated with uncertainty additivity: the squared variance of each data point is added to the overall time series squared variance and the square root of this sum provides the synthetic series variance. This therefore takes into account the explicit uncertainties in the various time series under investigation. The change point method is applied to the
15
synthetic time series and a SIC difference between the model with a shift in the mean and no shift is calculated for each time series. This provides a distribution for the SIC difference under the hypothesis of no shift in the mean. The P value is the estimated
probability to find a SIC difference at least as extreme as the one observed, under the hypothesis of no change. This methodology assumes that the errors of the model are
20
independent and normally distributed with a constant variance. We test normality of the residuals using the Lilliefors test, the independence is verified using the Durbin-Watson test and the constant variance is verified using a Fisher test. All tests are available and performed using MATLAB. If independence is not respected, we generate synthetic se-ries with the same first-order autocorrelation as observed in the respective time sese-ries
25
BGD
12, 13767–13791, 2015
Climate-driven shifts in continental net primary production
W. Buermann et al.
Title Page
Abstract Introduction
Conclusions References
Tables Figures
◭ ◮
◭ ◮
Back Close
Full Screen / Esc
Printer-friendly Version Interactive Discussion
Discussion
P
a
per
|
Discussion
P
a
per
|
Discussion
P
a
per
|
Discussion
P
a
per
|
3 Results
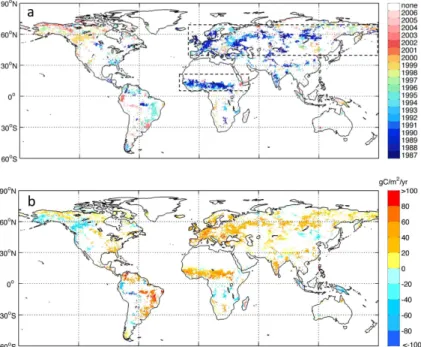
Applying our change point methodology (Sect. 2) on data-driven global NPP fields re-veals a marked spatial clustering of abrupt and sustained increases in NPP across northern Eurasia and northern Africa in the late 1980s (Fig. 1). At more regional levels, the impact of severe disturbance events such as the mountain pine beetle outbreak in
5
the late 1990s in the temperate and boreal forests of western North America (Kurz et al., 2008) is also disclosed (via rapid and sustained decreases in NPP). A similar anal-ysis without constraining to only statistically significant results at the grid point level implies that the coherent pattern of abrupt and sustained NPP shifts across northern Eurasia and northern Africa are spatially even more extensive (Fig. S1 in the
Supple-10
ment).
This point is further illustrated when we apply our change point framework on data-driven NPP time series representative of large land regions and highlights the important role of the northern extratropics (∼0.7 PgC yr−1), and the northern Eurasian continent
(∼0.5 PgC yr−1) in particular, in the regime shift in carbon uptake by terrestrial plants in
15
the late 1980s (Table 1). While the northern African region also exhibits a robust albeit smaller increase in data-driven NPP (∼0.2 PgC yr−1) in the late 1980s, no
correspond-ing NPP shifts are discernable for tropical/southern and global land areas (Table 1). It is well known that factors like ENSO (van der Werf et al., 2004) and volcanic aerosols (Lucht et al., 2002) have a large influence on variability in the carbon balance of
terres-20
trial ecosystems (particularly at interannual time scales) and these phenomena may have also played a role in the prominent late 1980s NPP regime shifts. An analysis that explicitly accounts for such effects however suggests that these two factors are not the causes of the shift, but indicates that a shift in data-driven NPP in the late 1980s emerges also for tropical/southern and global land regions albeit with limited statistical
25
car-BGD
12, 13767–13791, 2015
Climate-driven shifts in continental net primary production
W. Buermann et al.
Title Page
Abstract Introduction
Conclusions References
Tables Figures
◭ ◮
◭ ◮
Back Close
Full Screen / Esc
Printer-friendly Version Interactive Discussion
Discussion
P
a
per
|
Discussion
P
a
per
|
Discussion
P
a
per
|
Discussion
P
a
per
bon budget for the period 1959-2011 (Le Quéré et al., 2013) with our change point methodology that also accounts for explicit uncertainties in the individual budget terms (Sect. 2). Results confirm the presence of a regime shift in the global “residual” land sink (∼1-1.3 PgC yr−1depending on statistical treatment) in the late 1980s (Table 1 and
Fig. S2). Taken together, the good agreement in the timing of regime shifts in the global
5
“residual” land carbon sink and continental data-driven NPP may suggest that the latter is a significant driver of the increased terrestrial carbon uptake in the late 1980s.
In order to unravel the mechanisms leading to the continental shifts in data-driven NPP, we focus on the two target regions of northern Eurasia and northern Africa that predominantly contributed to this shift (see Fig. 1a). A factorial analysis for specific
10
seasons shows that the northern Eurasian continent experienced a marked increase in spring temperatures and spring satellite vegetation activity (fAPAR) in the late 1980s that together drove a substantial increase in spring NPP (Fig. 2a). This relatively sud-den springtime warming was also associated with a marked earlier spring onset (∼5 days; Fig. S3) and the enhanced productivity in the early part of the growing
sea-15
son appears to have also benefited plant productivity in subsequent summers (Fig. 2a and S3). Increased plant productivity in both of these seasons contributed predomi-nantly to the pronounced and sustained increases in annual NPP in the late 1980s (Fig. 2a). Over northern Africa including the dry Sahel, marked increases in data-driven NPP during wet and dry seasons that are driven by both increases in rainfall as well
20
as satellite fAPAR triggered a pronounced increase in annual NPP in the late 1980s (Fig. 2b). A closer inspection shows that in the period after this shift rainfall increased specifically during the later portion of the rainy season, which effectively lengthened the active growing season (Fig. S3).
The biogeochemical model (CASA) that we used for data-driven NPP simulations
25
ac-BGD
12, 13767–13791, 2015
Climate-driven shifts in continental net primary production
W. Buermann et al.
Title Page
Abstract Introduction
Conclusions References
Tables Figures
◭ ◮
◭ ◮
Back Close
Full Screen / Esc
Printer-friendly Version Interactive Discussion
Discussion
P
a
per
|
Discussion
P
a
per
|
Discussion
P
a
per
|
Discussion
P
a
per
|
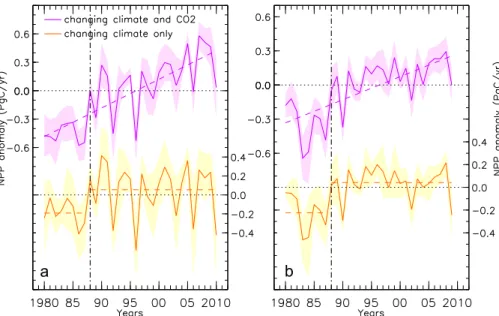
counted for in our NPP simulations (Sect. 2). We thus explored if process-based terres-trial biosphere models driven by climate and atmospheric CO2observations also show
evidence of a marked shift in NPP in the late 1980s. Results based on the TRENDY model ensembles (Sect. 2) show that for the satellite period (∼last 3 decades) a NPP
shift in the late 1980s emerges as a prominent feature, but only in experiments that
5
capture variability due to climate exclusively (Fig. 3 and Table S2). Regional attributions associated with the shift are very similar as in the case for data-driven NPP, but diff er-ences in NPP sensitivities to climate (inferred from differences in the magnitude of the shifts) are evident (Table 1 and S2). The TRENDY simulations are not restricted to the satellite period allowing us to assess whether the identified late 1980s NPP shifts also
10
emerge as dominant pattern when the study period is extended to the last 5 decades (to be consistent with the time frame of the global carbon budget). Results show that the late 1980s shift over northern Eurasia is a stable pattern. For northern Africa, how-ever, an even more prominent shift is identified in the late 1960s (Table S2). This may suggest that this region by itself is not important enough to influence the global land
15
sink (since there is no evidence for a corresponding shift in the global residual land sink; see Table 1). Further, in TRENDY model experiments in which atmospheric CO2 and climate drivers are varied, the shift appears to be masked by an increasing trend in NPP associated largely with the CO2fertilization effect (Fig. 3 and Table S2). In fact,
the high NPP sensitivity to changes in atmospheric CO2concentrations in many of the
20
current generation of terrestrial biosphere models (Arora et al., 2013) and the poten-tial role of nutrient limitation in mitigating this sensitivity (Zaehle, 2013) is presently a subject of intense research.
4 Discussion
The extent to which the identified climate-driven regime shifts in NPP in the late 1980s
25
BGD
12, 13767–13791, 2015
Climate-driven shifts in continental net primary production
W. Buermann et al.
Title Page
Abstract Introduction
Conclusions References
Tables Figures
◭ ◮
◭ ◮
Back Close
Full Screen / Esc
Printer-friendly Version Interactive Discussion
Discussion
P
a
per
|
Discussion
P
a
per
|
Discussion
P
a
per
|
Discussion
P
a
per
loss fluxes such as heterotrophic respiration (Rh), which (apart from its dependence on
substrate supply from NPP) often depends on climatic factors in a similar fashion as NPP (Lucht et al., 2002).
A limitation, however, is that currently no data-driven analog forRhestimation exists
and one has to revert to more uncertain process-based simulations. Nevertheless to
5
estimate the degree at which shifts in data-driven NPP may be potentially offset by corresponding shifts inRhwe apply our change point framework also on theRhfields
from our CASA simulations (see Sect. 2). Results show that for the large land regions of interest regime shifts in NPP are accompanied by substantial shifts inRh(Table 1)
often with 1–2 year lags (seen most clearly when ENSO and volcanic influences are
10
accounted for). For example, in the case of the two focal regions northern Eurasia and northern Africa, shifts in data-driven NPP are offset by corresponding shifts in Rh
at levels of 64–66 and 80–90 % (depending on statistical treatment), respectively. At global scale, and after accounting for influences of ENSO and volcanic aerosols, the late 1980s NPP shift of ∼1.1 PgC yr−1 appears to be offset by a corresponding Rh
15
shift of 0.8 PgC yr−1implying a corresponding shift in net ecosystem production (NEP;
estimated as NPP – Rh) of about 0.3 PgC yr−1 or roughly 25–30 % of the observed
shift in the residual land carbon sink (Table 1). These model-based NEP fluxes are uncertain (see above) and are likely a lower bound estimate as a new study suggests that process-based models have a tendency to transfer carbon too quickly through the
20
plant-soil systems because of severe biases in simulated soil carbon and/or too high
Rhsensitivities to climate (Carvalhais et al., 2014).
In addition, the observed climate shifts in the late 1980s may also substantially influ-ence fire regimes, but the paucity of data on burned area and related carbon emissions extending back to the early 80s severely limits estimating corresponding impacts. For
25
BGD
12, 13767–13791, 2015
Climate-driven shifts in continental net primary production
W. Buermann et al.
Title Page
Abstract Introduction
Conclusions References
Tables Figures
◭ ◮
◭ ◮
Back Close
Full Screen / Esc
Printer-friendly Version Interactive Discussion
Discussion
P
a
per
|
Discussion
P
a
per
|
Discussion
P
a
per
|
Discussion
P
a
per
|
the season (van der Werf et al., 2006). For northern Africa, changes in fire regimes associated with the late 1980s shift towards wetter conditions may have a substantial influence on net carbon balance albeit with uncertain direction since a shift towards wetter conditions may increase (more fuel load) or reduce (shortening the dry season) fire emissions (Andela and van der Werf, 2014). However, models that can potentially
5
quantify this influence are still in their early phase of development. While much uncer-tainty remains in estimating the contribution of climate-driven changes in the major land carbon fluxes to the late 1980s regime shift in the land carbon sink, our regional NPP attributions are consistent with a reported decrease in the interhemispheric gradient in atmospheric CO2in the 1990s relative to the 1980s that is attributed to an increase in
10
the northern carbon sink (Wang et al., 2013).
Other factors not related to climate may have also played a role in the late 1980s regime shift of the land carbon sink. A potential large contribution in this regard may be from land-use and land cover changes across northern Eurasia through agricul-tural abandonment and rapid changes in forest management in the aftermath of the
15
late 1980s post-Soviet collapse. While such processes are accounted for in net LUC emission estimates compiled in the global carbon budget (and therefore included in our analysis; see Table 1) corresponding effects may not be fully captured due to a lack of robust data especially in the period prior the Soviet collapse (Achard et al., 2006). However, at least in the case of agricultural abandonment newly available
esti-20
mates (Schierhorn et al., 2013) of associated carbon sinks for the post-Soviet period 1990–2009 suggest a minor contribution (∼0.03 PgC yr−1).
A remarkable finding is that two key climatic constraints on plant growth (tempera-ture and precipitation) have shifted in the late 1980s in a way as to facilitate an abrupt and sustained increase in continental-scale terrestrial NPP. This bears the question
25
cli-BGD
12, 13767–13791, 2015
Climate-driven shifts in continental net primary production
W. Buermann et al.
Title Page
Abstract Introduction
Conclusions References
Tables Figures
◭ ◮
◭ ◮
Back Close
Full Screen / Esc
Printer-friendly Version Interactive Discussion
Discussion
P
a
per
|
Discussion
P
a
per
|
Discussion
P
a
per
|
Discussion
P
a
per
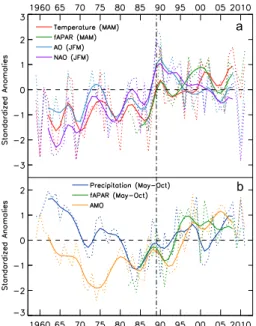
mate and satellite vegetation greenness data. Consistent with these results, we find that over the satellite period 1982–2011 the winter AO is tightly correlated with north-ern Eurasian spring temperatures (r=0.60, P < 0.001) and spring fAPAR (r =0.40, P =0.03), respectively (see Fig. 4). In the late 1980s, the AO together with its regional
manifestation the North Atlantic Oscillation (NAO; Hurrell, 1995) underwent an extreme
5
shift into their respective positive phases, thereby moving North Atlantic winter storm tracks northward and enabling advection of mild maritime air deep into the northern Eurasian land mass (Thompson and Wallace, 1998). Our results show that the north-ern Eurasian biomes responded rapidly to the associated substantial spring warm-ing as evidenced through synchronous increases in satellite-based vegetation activity
10
(Fig. 4a). In the aftermath of this shift, however, spring temperatures and vegetation activity stayed at elevated levels (causing a sustained impact on plant carbon uptake; see Fig. 2a) while the AO/NAO exhibited a negative trend, a fact that may be explained by a more gradual warming response to greenhouse gas forcing that is superimposed on the more oscillatory influence of the AO/NAO.
15
Northern African wet season rainfall pattern are strongly influenced by Atlantic sea surface temperature (SST) variability (Hoerling et al., 2006). In this regard, the warming of the North Atlantic relative to the South Atlantic that resumed in the late 1980s to mid 1990s caused a northward displacement of the Atlantic intertropical convergence zone (ITCZ) and increased rainfall rates across northern Africa, which led to a recovery
20
from earlier severe drought conditions (Hoerling et al., 2006). This increased moisture supply also led to rapid increases in satellite fAPAR (Fig. 4b). An open question is to what extent AO/NAO and Atlantic SST forcings may have interacted (Xie and Carton, 2004) in the wake of the apparent coordinated regional climate shifts over northern Eurasia and northern Africa in the late 1980s. It is well established that ENSO (van der
25
BGD
12, 13767–13791, 2015
Climate-driven shifts in continental net primary production
W. Buermann et al.
Title Page
Abstract Introduction
Conclusions References
Tables Figures
◭ ◮
◭ ◮
Back Close
Full Screen / Esc
Printer-friendly Version Interactive Discussion
Discussion
P
a
per
|
Discussion
P
a
per
|
Discussion
P
a
per
|
Discussion
P
a
per
|
adjacent vast land masses may be more important in regards to abrupt, substantial and more sustained shifts in the terrestrial carbon cycle.
5 Conclusions
Our results point to a mechanism whereby North Atlantic climate variability modulates the global terrestrial carbon cycle. New research suggests that a large portion of the
5
variability in the North Atlantic may be externally forced by anthropogenic aerosols (Booth et al., 2012) and the pronounced warming trend in the Arctic regions, known as Arctic amplification (Cohen et al., 2014). Arctic amplification specifically is thought to intensify under climate change (Deser et al., 2010) and this may drive the AO/NAO more into their respective negative phases (Cohen et al., 2014) which, based on our
10
results, would substantially reduce carbon uptake by terrestrial plants and weaken the land carbon sink. This illustrates the pressing need for improved knowledge of North Atlantic climate variability and associated forcing mechanisms in order to more credibly project the evolution of the land carbon sink and carbon cycle climate feedbacks under climate change.
15
The Supplement related to this article is available online at doi:10.5194/bgd-12-13767-2015-supplement.
Author contributions. W. Buermann, C. Beaulieu, B. Parida and G. J. Collatz designed the
anal-yses. W. Buermann, C. Beaulieu and B. Parida conducted the analanal-yses. All authors contributed to the writing of the manuscript.
20
Acknowledgements. We gratefully acknowledge support for this study from the National
Aero-nautics and Space Administration Carbon Cycle Science Program (grant NNX11AD45G). We also thank Emanuel Gloor, Stephen Sitch, and John Chiang for constructive comments that improved the manuscript. Finally, we thank the TRENDY modelling group for making their data available. The authors declare no competing financial interests.
BGD
12, 13767–13791, 2015
Climate-driven shifts in continental net primary production
W. Buermann et al.
Title Page
Abstract Introduction
Conclusions References
Tables Figures
◭ ◮
◭ ◮
Back Close
Full Screen / Esc
Printer-friendly Version Interactive Discussion
Discussion
P
a
per
|
Discussion
P
a
per
|
Discussion
P
a
per
|
Discussion
P
a
per
References
Achard, F., Mollicone, D., Stibig, H. J., Aksenov, D., Laestadius, L., Li, Z., Popatov, P., and Yaroshenko, A.: Areas of rapid forest cover change in boreal Eurasia, For. Ecol. Manag., 237, 322–334, 2006.
Andela, N. and van der Werf, G. R.: Recent trends in African fires driven by cropland expansion
5
and El Nino to La Nina transition, Nature CC, 4, 791–795, 2014.
Arora, V. K., Boer, G. J., Friedlingstein, P., Eby, M., Jones, C. D., Christian, J. R., Bonan, G., Bopp, L., Brovkin, V., Cadule, P., Hajima, T., Ilyina, T., Lindsay, K., Tjiputra, J. F., and Wu, T.: Carbon-concentration and carbon-climate feedbacks in CMIP5 earth system models, J. Climate, 26, 5289–5314, 2013.
10
Beaulieu, C., Sarmiento, J. L., MikaloffFletcher, S., Chen, J., and Medvigy, D.: Identification and characterization of abrupt changes in the land uptake of carbon, Glob. Biogeochem. Cy., 26, GB1007, doi:10.1029/2010GB004024, 2012a.
Beaulieu, C., Chen, J., and Sarmiento, J. L.: Change-point analysis as a tool to detect abrupt climate variations, in special issue: Climate predictions: the influence of nonlinearity and
15
randomness, Philos. T. R. Soc. A, 370, 1228–1249, 2012b.
Booth, B. B. B., Dunstone, N. J., Halloran, P. R., Andrews, T., and Bellouin, N, Aerosols impli-cated as a prime driver of twentieth-century North Atlantic climate variability, Nature, 484, 228–232, 2012.
Anderson, B., Tucker, C. J., Dickinson, R. E., Lucht, W., Potter, C. S., and Myneni, R. B.:
20
Interannual covariability in Northern Hemisphere air temperatures and greenness associ-ated with El Niño-Southern Oscillation and the Arctic Oscillation, J. Geophys. Res., 108, doi:10.1029/2002JD002630, 2003.
Carvalhais, N., Forkel, M., Khomik, M., Bellarby, J., Jung, M., Migliavacca, M., Mu, M., Saatchi, S., Santoro, M., Thurner, M., Weber, U., Ahrens, B., Beer, C., Cescatti, A., Randerson, J.
25
T., and Reichstein, M.: Global covariation of carbon turnover times with climate in terrestrial ecosystems, Nature, 514, 213–217, 2014.
Ciais, P., Sabine, C., Bala, G., Bopp, L., Brovkin, V., Canadell, J., Chhabra, A., DeFries, R., Galloway, J., Heimann, M., Jones, C., Le Quéré, C., Myneni, R. B., Piao, S., and Thornton, P: in: IPCC Climate Change 2013: The Physical Science Basis, edited by: Stocker, T. F., Qin,
30
BGD
12, 13767–13791, 2015
Climate-driven shifts in continental net primary production
W. Buermann et al.
Title Page
Abstract Introduction
Conclusions References
Tables Figures
◭ ◮
◭ ◮
Back Close
Full Screen / Esc
Printer-friendly Version Interactive Discussion
Discussion
P
a
per
|
Discussion
P
a
per
|
Discussion
P
a
per
|
Discussion
P
a
per
|
Cohen, J., Screen, J. A., Furtado, J. C., Barlow, M., Whittleston, D., Coumou, D., Francis, J., Dethloff, K., Entekhabi, D., Overland J., and Jones, J.: Recent Arctic amplification and ex-treme mid-latitude weather, Nat. Geosci., 7, 627–637, 2014.
Cox, P. M., Pearson, D., Booth, B. B., Friedlingstein, P., Huntingford, C., Jones, C. D., and Luke, C. M.: Sensitivity of tropical carbon to climate change constrained by carbon dioxide
5
variability, Nature, 494, 341–344, 2013.
Denman, K. L., Brasseur, G., Chidthaisong, A., Ciais, P., Cox, P. M., Dickinson, R. E., Hauglus-taine, D., Heinze, C., Holland, E., Jacob, D., Lohmann, U., Ramachandran, S., da Silva Dias, P. L., Wofsy, S. C., and Zhang, X.: in: IPCC Climate Change 2007: The Physical Science Basis, edited by: Solomon, S., Qin, D., Manning, M., Chen, Z., Marquis, M., Averyt, K. B.,
10
Tignor, M., and Miller, H. L., Cambridge University Press, Cambridge, 499–587, 2007. Deser, C., Tomas, R., Alexander, M. , and Lawrence, D.: The seasonal atmospheric response
to projected Arctic sea ice loss in the late twenty-first century, J. Climate, 23, 333–351, 2010. Donohue, R. J., Roderick, M. L., McVicar, T. R., and Farquhar, G. D.: CO2 fertilisation has
increased maximum foliage cover across the globe’s warm, arid environments, Geophys.
15
Res. Lett., 40, 3031–3035, 2013.
Enfield, D. B., Mestas-Nunez, A. M., and Trimble, P. J.: The Atlantic Multidecadal Oscillation and its relationship to rainfall and river flows in the continental U.S., Geophys. Res. Lett., 28, 2077–2080, 2001.
Greve, P., Orlowsky, B., Mueller, B., Sheffield, J., Reichstein, M., and Seneviratne, S. I.:
20
Global assessment of trends in wetting and drying over land, Nat. Geosci., 7, 716–721, doi:10.1038/ngeo2247, 2014.
Hoerling, M. J., Hurrell, J., Eischeid, J., and Phillips, A.: Detection and attribution of 20th century Northern and Southern African rainfall change, J. Climate, 19, 3989–4008, 2006.
Harris, I., Jones, P. D., Osborna, T. J., and Lister, D. H.: Updated high-resolution grids of monthly
25
climate observations – the CRU TS3.10 dataset, Int. J. Climatol., 34, 623–642, 2014. Hurrell, J. W.: Decadal trends in the North Atlantic oscillation regional temperatures and
pre-cipitation, Science, 269, 676–679, 1995.
IPCC: Climate Change 2013: The Physical Science Basis: Summary for Policymakers, edited by: Stocker, T. F. Qin, D., Plattner, G.-K., Tignor, M., Allen, S. K., Boschung, J., Nauels, A.,
30
BGD
12, 13767–13791, 2015
Climate-driven shifts in continental net primary production
W. Buermann et al.
Title Page
Abstract Introduction
Conclusions References
Tables Figures
◭ ◮
◭ ◮
Back Close
Full Screen / Esc
Printer-friendly Version Interactive Discussion
Discussion
P
a
per
|
Discussion
P
a
per
|
Discussion
P
a
per
|
Discussion
P
a
per
Kurz, W. A., Dymond, C. C., Stinson, G., Rampley, G. J., Neilson, E. T., Carroll, A. L., Ebata, T., and Safranyik, L.: Mountain pine beetle and forest carbon feedback to climate change, Nature, 452, 987–990, 2008.
Le Quéré , C., Raupach M. R., Canadell, J. G., Marland, G., Bopp, L., Ciais, P., Conway, T. J., Doney, S. C., Feely, R. A., Foster P, Friedlingstein, P., Gurney, K., Houghton, R. A., House,
5
J. I., Huntingford, C., Levy, P. E., Lomas, M. R., Majkut, J., Metzl, N., Ometto, J. P., Peters, G. P., Prentice, I. C., Randerson, J. T., Running, S. W., Sarmiento, J. L., Schuster, U., Sitch, S., Takahashi, T., Viovy, N., van der Werf , G. R., and Woodward, F. I.: Trends in the sources and sinks of carbon dioxide, Nat. Geosci., 2, 831–836, 2009.
Le Quéré, C., Andres, R. J., Boden, T., Conway, T., Houghton, R. A., House, J. I., Marland, G.,
10
Peters, G. P., van der Werf, G. R., Ahlström, A., Andrew, R. M., Bopp, L., Canadell, J. G., Ciais, P., Doney, S. C., Enright, C., Friedlingstein, P., Huntingford, C., Jain, A. K., Jourdain, C., Kato, E., Keeling, R. F., Klein Goldewijk, K., Levis, S., Levy, P., Lomas, M., Poulter, B., Raupach, M. R., Schwinger, J., Sitch, S., Stocker, B. D., Viovy, N., Zaehle, S., and Zeng, N.: The global carbon budget 1959–2011, Earth Syst. Sci. Data, 5, 165–185,
doi:10.5194/essd-15
5-165-2013, 2013.
Los, S. O., Collatz, G. J., Bounoua, L., Sellers, P. J., and Tucker, C. J.: Global interannual variations in sea surface temperature and land surface vegetation, air temperature, and pre-cipitation, J. Climate, 14, 1535–1550, 2001.
Lucht, W., Prentice, I. C., Myneni, R. B., Sitch, S., Friedlingstein, P., Cramer, W., Bousquet, P.,
20
Buermann, W., and Smith, B.: Climatic control of the high-latitude vegetation greening trend and Pinatubo effect, Science, 296, 1687–1688, 2002.
Luyssaert, S., Inglima, I., Jung, M., Reichstein, M., Papale, D., Piao, S., Schulze, E.-D., Wingate, L., Matteucci, G., Aubinet, M., Beer, C., Bernhofer, C., Black, K. G., Bonal, D., Chambers, J., Ciais, P., Davis, K. J., Delucia, E. H., Dolman, A., Don, A., Gielen, B., Grace, J., Granier,
25
A., Grelle, A., Griffis, T., Grnwald, T., Guidolotti, G., Hanson, P., Harding, R., Hollinger, D., Kolari, P., Kruijt, B., Kutsch, W., Lagergren, F., Laurila, T., Law, B., Le Maire, G., Lindroth, A., Magnani, F., Marek, M., Mateus, J., Migliavacca, M., Misson, L., Montagnani, L., Moncrieff, J., Moors, E., Munger, J. W., Nikinmaa, E., Loustau, D., Pita, G., Rebmann, C., Richardson, A. D., Roupsard, O., Saigusa, N., Sanz, M., Seufert, G., Soerensen, L., Tang, J., Valentini,
30
BGD
12, 13767–13791, 2015
Climate-driven shifts in continental net primary production
W. Buermann et al.
Title Page
Abstract Introduction
Conclusions References
Tables Figures
◭ ◮
◭ ◮
Back Close
Full Screen / Esc
Printer-friendly Version Interactive Discussion
Discussion
P
a
per
|
Discussion
P
a
per
|
Discussion
P
a
per
|
Discussion
P
a
per
|
Piao, S., Wang, X., Ciais, P., Zhu, B., Wang, T., and Liu, J.: Changes in satellite-derived vege-tation growth trend in temperate and boreal Eurasia from 1982 to 2006, Glob. Change Biol., 17, 3228–3239, 2011.
Piao, S., Sitch, S., Ciais, P., Friedlingstein, P., Peylin, P., Wang, X. H., Ahlström, A., Anav, A., Canadell, J. G., Huntingford, C., Jung, M., Levis, S., Levy, P. E., Li, J. S., Lin, X., Lomas, M.
5
R., Lu,M., Luo, Y. Q., Ma, Y. C., Myneni, R. B., Poulter, B., Sun, Z. Z., Wang, T., Viovy, N., Zaehle, S., and Zeng, N.: Evaluation of terrestrial carbon cycle models for their response to climate variability and to CO2trends, Glob. Change Biol., 19, 2117–2132, 2013.
Sarmiento, J. L., Gloor, M., Gruber, N., Beaulieu, C., Jacobson, A. R., MikaloffFletcher, S. E., Pacala, S., and Rodgers, K.: Trends and regional distributions of land and ocean carbon
10
sinks, Biogeosciences, 7, 2351–2367, doi:10.5194/bg-7-2351-2010, 2010.
Schierhorn, F., Müller, D., Beringer, T., Prishchepov, A. V., Kuemmerle, T., and Balmann, A.: Post-Soviet cropland abandonment and carbon sequestration in European Russia, Ukraine, and Belarus, Glob. Biogeochem. Cy., 27, 1175–1185, 2013.
Sitch, S., Friedlingstein, P., Gruber, N., Jones, S. D., Murray-Tortarolo, G., Ahlström, A., Doney,
15
S. C., Graven, H., Heinze, C., Huntingford, C., Levis, S., Levy, P. E., Lomas, M., Poulter, B., Viovy, N., Zaehle, S., Zeng, N., Arneth, A., Bonan, G., Bopp, L., Canadell, J. G., Chevallier, F., Ciais, P., Ellis, R., Gloor, M., Peylin, P., Piao, S. L., Le Quéré, C., Smith, B., Zhu, Z., and Myneni, R.: Recent trends and drivers of regional sources and sinks of carbon dioxide, Biogeosciences, 12, 653–679, doi:10.5194/bg-12-653-2015, 2015.
20
Thompson, D. W. J. and Wallace, J. M.: The Arctic oscillation signature in the wintertime geopo-tential height and temperature fields, Geophys. Res. Lett., 25, 1297–1300, 1998.
van der Werf, G. R., Randerson, J. T., Collatz, G. J., Giglio, L., Kasibhatla, P. S., Arellano Jr., A. F., Olsen, S. C., and Kasischke, E. S.: Continental-scale partitioning of fire emissions during the 1997 to 2001 El Nino/La Nina period, Science, 303, 73–76, 2004.
25
van der Werf, G. R., Randerson, J. T., Giglio, L., Collatz, G. J., Kasibhatla, P. S., and Arellano Jr., A. F.: Interannual variability in global biomass burning emissions from 1997 to 2004, Atmos. Chem. Phys., 6, 3423–3441, doi:10.5194/acp-6-3423-2006, 2006.
Wang, X., Piao, S., Ciais, P., Friedlingstein, P., Myneni, R. B., Cox, P., Heimann, M., Miller, J., Peng, S., Wang, T., Yang, H., and Chen, A.: A two-fold increase of carbon cycle sensitivity to
30
BGD
12, 13767–13791, 2015
Climate-driven shifts in continental net primary production
W. Buermann et al.
Title Page
Abstract Introduction
Conclusions References
Tables Figures
◭ ◮
◭ ◮
Back Close
Full Screen / Esc
Printer-friendly Version Interactive Discussion
Discussion
P
a
per
|
Discussion
P
a
per
|
Discussion
P
a
per
|
Discussion
P
a
per
Wang, Y., Li, M., and Shen, L. Accelerating carbon uptake in the Northern Hemisphere: evi-dence from the interhemispheric difference of atmospheric CO2concentrations, Tellus B, 65, 20334, doi:10.3402/tellusb.v65i0.20344, 2013.
Wild, M.: Global dimming and brightening: A review, J. Geophys. Res., 114, D00D16, doi:10.1029/2008JD011470, 2009.
5
Xie, S. P. and Carton, J. A.: Tropical Atlantic variability: patterns, mechanisms, and impacts, in: Ocean-Atmosphere Interaction and Climate Variability, edited by: Wang, C., Xie, S. P, and Carton, J. A., AGU Press, 2004.
Zaehle, S.: Terrestrial nitrogen–carbon cycle interactions at the global scale, Philos. T. R. Soc. B, 368, 20130125, doi:10.1098/rstb.2013.0125, 2013.
10
Zhao, M. and Running, S. W.: Drought-induced reduction in global terrestrial net primary pro-duction from 2000 through 2009, Science, 329, 940–943, 2010.
Zhu, Z., Bi, J., Pan, Y., Ganguly, S., Anav, A., Xu, L., Samanta, A., Piao, S., Nemani, R. R., and Myneni, R. B.: Global data sets of vegetation Leaf Area Index (LAI) 3g and Fraction Of Photosynthetically Active Radiation (FPAR) 3g derived from Global Inventory Modeling and
15
BGD
12, 13767–13791, 2015
Climate-driven shifts in continental net primary production
W. Buermann et al.
Title Page
Abstract Introduction
Conclusions References
Tables Figures
◭ ◮
◭ ◮
Back Close
Full Screen / Esc
Printer-friendly Version Interactive Discussion
Discussion
P
a
per
|
Discussion
P
a
per
|
Discussion
P
a
per
|
Discussion
P
a
per
|
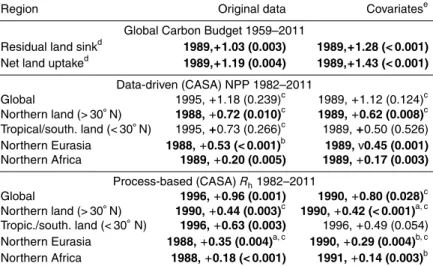
Table 1. Timing and magnitude of abrupt changes in the terrestrial carbon cycle at global and continental scales. Timing of abrupt change (first data entry) as well as corresponding direction and magnitude (second data entry in units of PgC yr−1) andP values (in brackets;
estimated through Monte Carlo simulations) are provided if a “shift in the mean” model fits the respective time series best (see Methods). The timing of a shift indicates the first year of a new regime. Shifts that are statistically significant (P< 0.05) are highlighted in bold. Additional tests
were carried out for assessing the nature and robustness of the shifts including accounting for influences related to ENSO and volcanic eruptions (Covariates), and specifically removing the two years of largest impact of the strong Mt. Pinatubo volcanic eruption in the original time series (Table S1).
Region Original data Covariatese
Global Carbon Budget 1959–2011
Residual land sinkd 1989,+1.03 (0.003) 1989,+1.28 (< 0.001) Net land uptaked 1989,+1.19 (0.004) 1989,+1.43 (< 0.001)
Data-driven (CASA) NPP 1982–2011
Global 1995,+1.18 (0.239)c 1989,+1.12 (0.124)c
Northern land (> 30◦N) 1988,
+0.72 (0.010)c 1989,+0.62 (0.008)c Tropical/south. land (< 30◦N) 1995,+0.73 (0.266)c 1989,+0.50 (0.526) Northern Eurasia 1988,+0.53 (< 0.001)b 1989,v0.45 (0.001)
Northern Africa 1989,+0.20 (0.005) 1989,+0.17 (0.003)
Process-based (CASA)R
h1982–2011
Global 1996,+0.96 (0.001) 1990,+0.80 (0.028)c
Northern land (> 30◦N) 1990,
+0.44 (0.003)c 1990,+0.42 (< 0.001)a, c Tropic./south. land (< 30◦N) 1996,
+0.63 (0.003) 1996,+0.49 (0.054) Northern Eurasia 1988,+0.35 (0.004)a, c 1990,+0.29 (0.004)b, c Northern Africa 1988,+0.18 (< 0.001) 1991,+0.14 (0.003)b
a
BGD
12, 13767–13791, 2015
Climate-driven shifts in continental net primary production
W. Buermann et al.
Title Page
Abstract Introduction
Conclusions References
Tables Figures
◭ ◮
◭ ◮
Back Close
Full Screen / Esc
Printer-friendly Version Interactive Discussion
Discussion
P
a
per
|
Discussion
P
a
per
|
Discussion
P
a
per
|
Discussion
P
a
per
Figure 1.Spatial pattern of abrupt shifts in data-driven NPP. Maps show(a)timing and corre-sponding(b)direction and magnitude of abrupt shifts in data-driven (CASA) annual NPP for the satellite period 1982–2011. All robust NPP shifts shown here have passed the two key statistical criteria: (i) a “shift in the mean” model fits the time series at each grid point best (evaluated trough the Schwarz Information Criterion) and (ii) the shift is also statistically signif-icant (P< 0.05) based on Monte Carlo simulations that take into account explicit uncertainties
(Sect. 2). Maps of shifts that passed only the first criteria are also provided (Fig. S1). In(a), the focus regions northern Eurasia (10◦W–180◦E, 40–70◦N) and northern Africa (20◦W–50◦E, 5–
20◦N) are outlined. The shifts are only assessed for the period 1987–2006, since for robust
BGD
12, 13767–13791, 2015
Climate-driven shifts in continental net primary production
W. Buermann et al.
Title Page
Abstract Introduction
Conclusions References
Tables Figures
◭ ◮
◭ ◮
Back Close
Full Screen / Esc
Printer-friendly Version Interactive Discussion
Discussion
P
a
per
|
Discussion
P
a
per
|
Discussion
P
a
per
|
Discussion
P
a
per
|
a b
BGD
12, 13767–13791, 2015
Climate-driven shifts in continental net primary production
W. Buermann et al.
Title Page
Abstract Introduction
Conclusions References
Tables Figures
◭ ◮
◭ ◮
Back Close
Full Screen / Esc
Printer-friendly Version Interactive Discussion
Discussion
P
a
per
|
Discussion
P
a
per
|
Discussion
P
a
per
|
Discussion
P
a
per
a b
Figure 3.Temporal changes in continental process-based NPP based on nine terrestrial bio-sphere models. Panels show annual NPP anomalies for the(a)northern Eurasian and(b)North African focus regions, based on ensembles of nine biosphere models that participated in the recent TRENDY model intercomparison study (Sitch et al. 2015). Shown are results for two sets of model simulations, one in which climate and CO2as model drivers were varied and another one that only takes into account the effect of climate variations (see Sect. 2). All anomalies are relative to the 1982–2010 overlapping satellite era to facilitate comparisons with the data-driven NPP simulations (see Fig. 2). Mean ensembles were formed based on anomalies in the single TRENDY models to emphasize temporal changes in NPP and to suppress uncertainties arising from model differences in magnitudes. Shaded contours represent 1σuncertainties
BGD
12, 13767–13791, 2015
Climate-driven shifts in continental net primary production
W. Buermann et al.
Title Page
Abstract Introduction
Conclusions References
Tables Figures
◭ ◮
◭ ◮
Back Close
Full Screen / Esc
Printer-friendly Version Interactive Discussion
Discussion
P
a
per
|
Discussion
P
a
per
|
Discussion
P
a
per
|
Discussion
P
a
per
|
a
b