V.K. Dadhwal
National Remote Sensing Centre, ISRO, Hyderabad – 500625, India
KEYWORDS: Carbon,
Vegetation, Atmosphere, GIS, Forestry, Soil, Oceans
ABSTRACT
Improved national carbon assessments are important for UNFCC communications, policy studies and improving the global assessment. Use of EO for land cover dynamics, forest type, cover and phytomass carbon density, productivity and related soil carbon density and regional extrapolation of point flux measurements. A National Carbon Project (NCP) under the Indian Space Research Organisation - Geosphere Biosphere Programme (ISRO – GBP) aims at improving the understanding and quantification of net carbon balance. The NCP has been implemented with three major components – (A) vegetation carbon pools, (B) Soil carbon pools and (C) Soil and Vegetation – Atmosphere Fluxes. A total of 6500 field plot data from forests and trees outside forests have been collected. 1500 field plots have been inventoried for the soil carbon based on the remotely sensed data stratification. A nationwide network of carbon flux towers in different ecosystems for the measurement and modeling of the net carbon flux using eddy covariance techniques is being established and upscaling using satellite remote sensing data and modelling is under process. The amplitude of the diurnal variation in NEE increased with growth of wheat and reached its peak around the pre-anthesis stage. Besides, under NCP, satellite diurnal CO2 have also analyzed the data obtained from AIRS and SCIAMACHY over India and
surrounding oceans and was correlated with surface fluxes. The CASA model simulations over India using NOAA AVHRR NDVI.
1. INTRODUCTION
The annual carbon pools inclusive of the atmosphere to the biosphere become critical in regulating the increasing rate of atmospheric CO2. Monitoring regional carbon storage and its
flux is of paramount importance for improving the state of the biosphere’s health and system for carbon credit trading (Bonan, 1995; Chen et al., 2000).
India is a large country with 329 million hectares of geographical area situated in the tropics between 80 and 380 N
latitude and 660 and 1000 E longitude. The climate of the country varies from monsoonal in the south to temperate in the north. The country has a diverse vegetation cover. Of the total geographic area of the country, forest and agricultural land accounts about 21 and 55%, respectively. Many studies are being carried out to estimate the terrestrial NPP and analyse its spatio-temporal variability over India (Hingane, 1991; Dadhwal and Nayak, 1993; Chhabra and Dadhwal, 2004; Nayak et al., 2009). However, most of these studies could not explain the broad spectrum of NPP seasonal variability over the country; they led to different estimates of seasonal and annual NPP budgets over the country owing to the following limitations: (1) studies are carried out for different years; (2) different methodology and datasets are being used, (3) no attempts are made to describe inter-annual variability of NPP over India. Furthermore, a direct estimation and comprehensive analysis on inter-annual variability of net primary productivity over the country has not been adequately investigated.
Indian terrestrial ecosystem acts as spatially and temporally variant carbon source and sink due to monsoon based climate system; diverse land use and land cover distribution and cultural practices. The agriculture covering around 180 M ha and forests covering 68 M ha contributes largely to terrestrial carbon dynamics in India (Chhabra and Dadhwal 2004, Kaul et al 2009).The diverse cropping patterns, wet land rice ecosystems and temporally variant dry land agriculture makes Indian agriculture carbon fluxes assessment and understanding complex. The diverse forest structure and composition,
phenology, fire regimes, biotic disturbances, extractions and large reservoir of trees outside forests plays larger role in Carbon sequestration and shaping the carbon budget (Bhat and Ravindranath, 2011). Unlike the regular forest inventories, soil inventories are rarely repeated on a regular basis and require chrono sequenced sampling to understand the impacts of different management regimes and land use changes on Carbon dynamics.
Approximately 0.8 Pg C yr-1
is transported to the oceans by the world’s rivers and India has several perennial rivers and long coastline. It is important to properly understand air sea CO2
exchanges and quantify the Carbon estimates due to fresh water and coastal dynamics as it constitutes a redirection of a substantial portion of the net terrestrial sink (Doney and Hood, 2002). The diverse natural and anthropogenic sources of CO2
and long range transport of atmospheric gases across varied topographic gradients as a function of intra and inter annual climatic variations affects sink potential of different categories of land cover. This necessitates regular measurements and monitoring of atmospheric CO2 and its transport modelling.
There has been an increasing trend in assimilating EO data towards understanding of land surface processes, climate measurements and carbon pools and fluxes (IPCC 1995). Estimation of net carbon flux caused by deforestation and afforestation in India (Kaul et al 2009; Subodh et al., 2011) are a few recent studies reported over India using EO data. In order to address the mentioned knowledge gaps, under ISRO Geosphere and Biosphere programme, National Carbon Project (NCP) was undertaken with the following major goals
¾ Assessment of Carbon Pools, Fluxes and Net Carbon
bal-ance for terrestrial biomes in India
¾ To establish an observational network and create remote
sensing-based spatial databases for modeling and period assessment of net carbon balance in India
¾ To provide support to Second National Communication
The National Carbon Project was implemented as a set of three inter-related sub-projects and recent results from different sub projects and challenges ahead of the project are presented in the paper.
2. VEGETATION CARBON POOLS
The vegetation carbon pools assessment was carried out with the following two objectives:
¾ Assessment of terrestrial vegetation biomass in the country
using ground sampling and satellite remote sensing data
¾ To generate geospatial data of the terrestrial phyto mass
Carbon of India along with estimates of uncertainty.
2.1 Vegetation Carbon Pools1 (VCP)
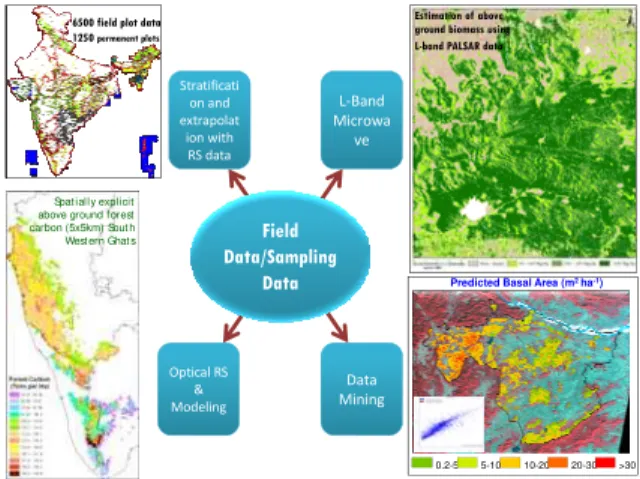
As part of (VCP), an optimal phytomass density observation, modeling and mapping approach for national-scale forest carbon pool assessment was defined. A total of 6500 field plot data from forests and trees outside forests was collected with defined sampling protocols. The forest density, vegetation type map, accessibility (nearness to road), normalized difference vegetation index and district boundary have been used to select sites for sampling. 2,350 permanent sample plots were identified for further monitoring as well as for quality assurance. 753 regional species volume equations and general equations were collated. Specific gravity data of 16,400 species of the Asia has been collected. Specific gravity of 86 fire wood trees and shrub growing in wasteland/degraded sites has been added. A geo-referenced relational database of plot wise forest inventory and biomass density estimates was prepared. Figure 1 shows the various methods of generating spatial biomass map that is being employed as per the regional suitability and availability of data types.
0.2-5 5-10 10-20 20-30 >30 Predicted Basal Area (m2 ha-1)
Field Data/Sampling
Data Stratificati
on and
extrapolat
ion with
RS data
Data Mining L‐Band Microwa
ve
Optical RS
&
Modeling Spat iall y explicit above ground forest carbon (5x5km) Sout h West ern Ghat s 6500 field plot data 1250 permanent plots
Estimation of above ground biomass using L-band PALSAR data
Figure 1: Methods for generating biomass image using various remote sensing sensor data and ground inventory data
Pilot studies in 16 test-sites in different ecological regions in the country have been taken to test the methodology for biomass estimation and spectral modeling using optical and microwave data in forest ecosystem. End-to-end analyses at eight sites have been completed. Interferometric Water Cloud Model (IWCM) has been successfully applied for forest biomass retrieval in Dudhwa National Park (Pandey et al., 2010). Similarly the plot-wise field data from south Gujarat (Patil et al., 2012) was aggregated to MODIS pixel (250 m)
using area weightages of forest/vegetation. The study reports that above ground phytomass varied from 6.13 t/ha to 389.166 t/ha. The contribution of bamboo in AGB has been found very high. The phytomass range obtained by using MODIS data varies from 0.147 t/ha to 182.16 t/ha.
Recent estimates found that conservation policies have resulted in increase of the country’s forest carbon stocks from 6244.8 to 6621.6 Mt with an annual increment of 37.7 Mt of the carbon from 1995 to 2005 (Kishwan et al., 2011). Spatial explicit biomass estimation procedures were also tested to quantify biomass distribution in Orissa state using data mining techniques. The study involved evaluating the relationship between basal area and stand height collected over 17,500 plots and different spatial information on multi temporal spectral data, terrain, climate, forest type and crown density using random forest decision tree algorithm.
2.1.1 Crop NPP (above and below ground) from historical agricultural statistics data:
Vegetation Photosynthesis Model (VPM) based on original Monteith’s growth analysis approach is implemented to derive decadal and annual dry matter productivity over cropland of India. Solar radiation databases over Indian sub-continent were generated using monthly MODIS derived cloud cover using Angstrom & Prescott Model. Spatially explicit fields of time-varying incident Photosynthetically Active Radiation (PAR) and fraction of PAR were derived from remote sensing data. Fraction of absorbed photosynthetically active radiation was computed based on linear scaling of NDVI and chlorophyll related Enhanced Vegetation Index (EVI). Spatial distribution of maximum light use efficiency is derived by adjusting for spatially varying proportion of crop groups such as C3 and C4 crops. Environmental stress scalars for adjusting potential productivity were derived from combination of daily grided climate from IMD and decadal RS based land surface wetness indices. (Patel et al., 2010 and Wani et al., 2010).
2.2 Soil Carbon Pools
Soil Organic Carbon (SOC) is the largest terrestrial carbon pool. Soil can be a source of (CO2, CH4, and N2O) or sink (CO2
and CH4) of greenhouse gases depending on land use and
2.3 Soil and Vegetation – Atmosphere Fluxes:
The tower based flux measurements are reported to provide unbiased regional estimates of CO2 fluxes (Baldocchi et al.,
2001). Initial efforts were made to identify the needs and approach for developing flux net work over India (Sundareshwar et al., 2007). As part of National Carbon Project (NCP) initiative of ISRO-GBP a nationwide network of carbon towers in major forests, croplands and grasslands for the measurement and modeling of the net carbon flux using eddy covariance techniques, satellite remote sensing data and models is planned. Accordingly the Soil and Vegetation – Atmosphere Carbon Flux study is being conducted with the following objectives:
Analysis of atmospheric CO2 patterns to study spatio
– temporal Carbon source-sink relations over India. Establishment of flux towers and measurement of
ed-dy covariance and meteorological parameters to stued-dy the exchanges of carbon dioxide (CO2), water vapour
and energy balance between terrestrial ecosystems and the atmosphere.
Measurement and spatial modeling of soil CO2 fluxes
Integration of observations and component – wise modelling for conducting full carbon balance ac-counting of India and estimation of net carbon bal-ance.
Figure 2: showing Flux tower in Mangrove with sensors and the approach to the tower
Three towers at forest sites of 15-50 m height at Barkot, Uttaranchal; Haldwani, Uttaranchal and Betul, M.P. were established. A new tower in mangrove forests of Sunderabans (Figure2) has also established where methane flux is also being measured in addition to CO2 and water. The daily peak CH4
flux in the month of March 2012 was around 2 micromol/m2/s. Site specific studies was also conducted for measurement and modeling of soil respiration and emission fluxes using automatic soil CO2 exchange system at Haldwani tower site.
One 3 meter tower at Agriculture site (Meerut) with open Path flux tower has been installed in an agro-ecosystem at Modipuram, Meerut to measure net CO2 exchange between
atmosphere and crop canopy. The biophysical data thus generated is being analysed to understand diurnal, seasonal and
inter annual variation in carbon and water fluxes and NPP modeling using RS based models.
The 10 Hz micrometeorological data are processed inclusive of various corrections to derive half-hourly fluxes of carbon, water vapour and heat fluxes by using various softwares. Field measurements such as leaf area index, soil moisture and chlorophyll content index were measured at weekly interval. Half-hourly photosynthetically active radiation above and below wheat canopy was measured on a weekly basis. Daily GPP and ecosystem respiration was computed from half-hourly NEE after applying gap filling, filtering and nocturnal NEE-temperature relationship. Day-time ecosystem respiration was computed by applying temperature response function to half-hourly temperature data.
Light-response curves and its parameters were derived at different growth stages of wheat by fitting rectangular hyperbolic functions between measured GPP and absorbed photosynthetically active radiation. Diurnal pattern in Net ecosystem exchange (NEE) reveals negative NEE during day-time representing CO2 uptake and positive during night as
release of CO2. The amplitude of the diurnal variation in NEE
increased with growth of wheat and reached its peak around the pre-anthesis stage. The mid-day uptake during this stage was around 1.15 mg CO2 m-2s-1 and night-time release was around
0.15 mg CO2 m-2s-1. Large daily GPP above 30 g CO2 m-2d-1
continued until mid of anthesis stage (15 march) and decline rapidly during maturity stage. (Patel et al., 2010 and Patel et al. 2011).
The Haldwani flux tower is established over mixed plantation and natural forests of Uttaranchal state. The flux tower at Haldwani is equipped with CSAT sonic anemometer, LI-7000 closed path gas analyzer, radiation and soil thermal sensors. Measurements are logged at 10 Hz interval using data logger. Half-hourly CO2 flux measurements corresponding to dry
period (18-28 Jan, 2009) and flush stage (April, 2009) were processed to study the diurnal variation in net ecosystem exchange and its response to environmental variables. Light-response curves were derived for quantifying quantum photosynthetic efficiency. Efficiency worked out to be 0.021
µmol CO2 µmol photon-1 during flush stage.
Respiration-temperature response was also evaluated to derive Q10
coefficients. In order to quantify CO2 fluxes over large region,
initial efforts are made to upscale site-specific data using process based ecosystem models. Figure 3 shows one representative CO2 flux with day time CO2 removal with a
daily peak mean of -3 mg/m2/s and night time CO2 build up due
to respiration alone from the Betul flux tower located in Teak mixed forest from central India.
‐3.5 ‐3 ‐2.5 ‐2 ‐1.5 ‐1 ‐0.5 0 0.5 1 1.5 22/1 0 /1 1 00 :0 6: 30 23/1 0 /1 1 00 :0 6: 30 24/1 0 /1 1 00 :0 6: 30 25/1 0 /1 1 00 :0 6: 30 26/1 0 /1 1 00 :0 6: 30 27/1 0 /1 1 00 :0 6: 30 28/1 0 /1 1 00 :0 6: 30 [M g ][ m o l ‐ 1 ][m ‐ 2]
Figure 3: showing CO2 flux results from eddy covariance
2.4 Scaling of carbon fluxes by Modelling techniques
Carbon dioxide (CO2) is a major greenhouse gas and its rapid
increase in the atmosphere after the pre-industrial time is the cause of recent time global warming and climate change (IPCC reports 1995). Much of the current increasing trend of CO2 is
attributable to the 6-fold increase in human use of fossil fuel, deforestation and other anthropogenic activities. Of the total anthropogenic CO2 emission, only 30 - 40% remains in the
atmosphere and the rest is being absorbed by ocean and terrestrial biosphere (IPCC reports 1995). While anthropogenic release of CO2 is continuously increasing at a rapid rate,
sinking strength of the natural system: terrestrial biosphere and ocean is decreasing (Berthelot et al., 2005). Thus controlling the growth rate of atmospheric CO2 by reducing the
anthropogenic CO2 release and helping natural system for
enhancing uptake capacity of atmospheric CO2 is a major
challenge.
There have been a few studies on assessing
spatial and
temporal patterns of satellite based biophysical parameters and NPP over India. Estimates of monthly net C fixation and net primary productivity over India and its eight regions, using SPOT-VEGETATION 10-day NPP composites, and comparing the monthly patterns of NPP and NDVI was made (Chhabra and Dadhwal, 2004).The total net C fixation of India was estimated as 2.18 PgC, which amounts to area-weighted terrestrial NPP of 6.66 tCha–1 yr–1 for the period June 1998– May 1999. An analysis of monthly fAPAR dataset derived from NOAA–AVHRR data covering the period from July 1981 to May 2001 over the Indian land mass was carried out (Pandya et al., 2004).
2.4.1 Measurement through ground base network over India
For quantitative understanding of regional CO2 transport and its
variations with regional environmental boundary condition different spatial and temporal scales have to be analysed through field measurements. The distributed dense networks of observations would be useful to represent the CO2 changes due
to geographic and local environmental conditions. NCP is making continuous efforts towards multiplying ground based net work across the country by installing sensors for measuring boundary layer atmospheric CO2, flux towers for measuring the
CO2 flux exchanges between selected ecosystems and
atmosphere.
Under this program, Vaisala CARBOCAP GMP343 is installed at six stations and some are under plan. The Vaisala CARBOCAP GMP343 is an accurate and rugged probe type instrument that can measure atmospheric CO2 with acceptable
compromise between size, response time accuracy and stability. Analysis of data obtained from Dehradun station for the year 2009 was done (Sharma et al., 2011) and work is under progress for other stations. The data at Dehradun exhibit distinct diurnal and semi-annual cycles. CO2 decreases during
sunrise to afternoon and increases during afternoon to sunset. It remains higher during the night time. The semi-annual cycle has decreasing phase during Feb-March and July-Sep, and has increasing phase during rest of the period. This observed variability of atmospheric CO2 is mostly driven by local
ecosystem activity.
2.4.2 Analysis of satellite measured atmospheric CO2
Recently several space based observation programs such as Atmospheric Infra Red Sounder (AIRS), SCanning Imaging
Absorption spectro Meter for Atmospheric CartograpHY (SCHIAMACHY), Greenhouse gases Observing SATellite (GOSAT).AIRS can measure CO2 at mid troposphere while
SCHIAMACHY and GOSAT can measure columnar atmospheric CO2. We have analyzed the data obtained from
these satellite observations over India and surrounding oceans and tried to link with surface fluxes (source and sink). Since AIRS provides observations since 2002 till now, this data has been extensively used for analysis (Nayak et al., 2011). An increasing rate mid tropospheric CO2 is 2.14 ppmv yr-1 is
observed, which is almost the same as that of observed CO2 at
Maunaloa.
The annual cycle has larger amplitude over the land than over the oceans. There also exist inter-annual variations in the observation. In order to understand the causes of such variability, we have computed fluxes of CO2 exchanges over
the land (India) and over the oceans through integrating different data bases (remote sensed and observed) in to different models developed in the recent past for the purpose. The description of the modelling approach followed is provided in Nayak et al., 2011. On inter-annual scale, flux exchanges over the tropical north Indian Ocean could play positive role on the control of atmospheric carbon dioxide growth rate (Nayak et al., 2011).
2.4.3 Modeling NPP, NEP and associated parameters related to Carbon Cycle over terrestrial India
The Carnegie–Ames–Stanford Approach (CASA), a terrestrial biosphere model, has been used to investigate spatiotemporal pattern of net primary productivity (NPP) during 2003 over the Indian subcontinent. Sensitivity analysis suggest that the difference could be due to inclusion of variable light use efficiency (LUE) across different land cover types and environment stress scalars as down regulator of NPP in the present CASA model study.(Nayak et al., 2011).
Recently we have also implemented CASA model to simulate NPP, NEP, soil respiration etc. over India at 2x2 min spatial resolution. In the national scale, average annual NPP is estimated to be 1.5 Pg C Yr-1 and is increasing at the rate of 0.005 Pg C Yr-2 during past 25 years from 1981-2006. This trend is equivalent to 8.5% over the country during past 25 years.
This increase is primarily due to the enhancement of productivity over agricultural lands in the country. Variability of precipitation has stronger role on the control of inter-annual variability of NPP. Spatial distribution of NPP trend is different in different places and in different periods. In the recent time (1995 onwards), large decline of NPP over the Indo-Gangetic plane is observed owing to decline of rain over the regions. Estimated NEP budget for the country suggest that, on an average India is the region of net sink of atmospheric CO2 with total annual uptake of 9.5 Tg C yr-1. There exists
strong inter-annual variability of NEP over the country. Except early period (1981-1985), most of the years India is net sink of atmospheric CO2.
2.5 Estimation and modeling of geochemical C-fluxes-weathering, wetland effluxes, sediment erosion and deposition, riverine and coastal C-flows.
characterizing carbon balance. Pilot studies were conducted over representative watersheds in Northern India to collect fresh seasonal stream water sampling during Aug 2006-Feb 2009.
Studies indicated that atmospheric CO2 drawdown would be
about 4.4 billion moles/yr for total area of about 2200 sq km of all three watersheds. Estimated annual dissolved carbon (DC=DIC+DOC, inorganic and organic) flux varies from about 2.5 to 51 t/km2/year. Non monsoonal flux was observed to be
half that of monsoonal flux.
Using RUSLE and MMF models attempt was made to quantify potential soil loss and soil organic carbon loss for entire country with RS based inputs. Annual loss was estimated to be 23.2 and 23.8 t/ha/yr and SOC loss of about 168 and 140 kg/ha/yr. Out of major river basins, Brahmaputra basin was having highest soil erosion (~34 t/ha/yr) and SOC loss (~507 kg/ha/yr avg.) where Ganga basin showed 130 kg/ha/yr SOC loss.
ACKNOWLEDGEMENTS
Thanks are due to ISRO-GBP programme for funding this project and extending all necessary support.
REFERENCES
References from Journals:
Baldocchi, D., Eva, F., Lianhong, G., Richard, O., Hollinger, D., Running, S., Anthoni, P., Bernhofer, Ch., Davis, K., Evans, R., Fuentes, J., Goldstein, A., Katul, G., Law, B., Lee, X., Malhi Y., Meyers, T., Munger, W., Oechel, W., Paw U, K. T., Pilegaard, K., Schmid, H. P., Valentini, R., Verma, S., Vesala, T., Wilson, K., and Wofsy, S., 2001. FLUXNET: A new tool to study the temporal and spatial variability of ecosystem-scale carbon dioxide, water vapor, and energy flux densities. Bull.
Am. Meteorol. Soc. 82, pp. 2415–2434.
Berthelot, M., Friedlingstein, P., Ciais, P., Jean- Louis Dufres-ne, and Monfray, P., 2005. How uncertainties in future climate change predictions translate into future terrestrial carbon fluxes,
Global Change Biol., 11(6), pp. 959 – 970.
Bhat, D. M. and Ravindranath, N. H., 2011. Above – Ground Standing Biomass and Carbon Stock Dynamics under a Varied Degree of Anthropogenic Pressure in Tropical Rain Forests of Uttara Kannada District, Western Ghats, India. Taiwania, 56(2), pp. 85-96.
Bonan, G.B., 1995. Land-atmosphere interactions for climate change system models: coupling biophysical, biogeochemical and ecosystem dynamical processes. Remote Sensing of
Envi-ronment 51: pp. 57–73.
Chen, W.J., Chen, J., Lium, J., Cihlar, J., 2000. Approaches for reducing uncertainties in regional forest carbon balance. Global
Biogeochemical Cycles 14: pp. 827–838.
Chhabra, A., and Dadhwal, V.K., 2004. Estimating terrestrial net primary productivity over India using satellite data. Current
Science, 86(2), pp. 269-271.
Chhabraa A, Palriab S, Dadhwal V.K., 2003. Soil organic carbon pool in Indian forests. Forest Ecology and Management; 173 (1–3), pp. 187–199
Dadhwal, V.K. and Nayak, S.R., 1993. A preliminary estimate of biogeochemical cycle of carbon for India. Science and Cul-ture 59(1): pp. 9–13.
Hingane, L.S., 1991. Some aspect of carbon dioxide exchange between atmosphere and Indian plant biota. Climate Change 18: pp. 425–435.
Kaul, M., Dadhwal, V.K. and Mohren, G.M.J., 2009. Land Use Change and net C flux in Indian forests. Forest Ecology
Management, 258, pp. 100-108.
Kishwan, J., Pandey, R. and Dadhwal, V. K., 2011. Emission Removal Capability of India’s Forest and Tree Cover.
Small-Scale Forestry, DOI: 10.1007/s11842-011-9168-9.
Krishan, G., Srivastav, S.K., Kumar, S., Saha, S.K. and Dadhwal, V.K., 2009. Quantifying the underestimation of soil organic carbon by the Walkley and Black technique – examples from Himalayan and Central Indian soils. Current Science,
96(8): pp. 1133-1136
Lal, R., 1999. Global carbon pools and fluxes and the impact of agricultural intensification and judicious land use. Prevention of land degradation, enhancement of carbon sequestration and conservation of biodiversity through land use change and sustainable land management with a focus on Latin America and the Caribbean. World Soil Resources Report 86, FAO, Rome, Italy, pp. 45-52.
Nayak, R.K., Patel, N.R., and Dadhwal, V.K., 2011. Inter-annual variability of Net Primary Productivity over India,
International Journal of Climatology (in press).
Nayak, R.K., Patel, N. R. and Dadhwal, V. K., 2009. Estimation and analysis of terrestrial net primary productivity over India by remote-sensing-driven terrestrial biosphere model, Journal of Environment Monitoring and Assessment- 10.1007/s10661-009-1226-9.
Pandey, U., Kushwaha, S.P.S, Kachhwaha, T.S., Kunwar, P. and Dadhwal, V.K, 2010. Potential of Envisat ASAR data for woody biomass assessment. Tropical Ecology, 51(1), pp. 117-124.
Pandya M.R., Singh, R.P. and Dadhwal, V.K., 2004. A signal of increased vegetation activity of India from 1981 to 2001 observed using satellite-derived fraction of absorbed photosynthetically active radiation. Current Science 87(8): pp. 1122–1126.
Patel N.R, Dadhwal V.K Saha S.K, Garg A and Sharma N, 2010. Evaluating the potential of MODIS data to infer water stress scalar for estimating cropland NPP. Tropical Ecology, 51(1): pp. 93-105.
Patel, N.R., Dadhwal, V.K. and Saha, S.K., 2011. Measurement and scaling of carbondioxide (CO2) exchanges in wheat using
flux-tower and remote sensing. J. Indian Society of Remote
Sensing 34 ; DOI 10.1007/s12524-011-0107-1.
Patil, P., Singh, S. and Dadhwal, V.K., 2012. Above ground forest phytomass assessment in Southern Gujarat. J. Indian
So-ciety of Remote Sensing 40 (1), pp. 37-46, DOI:
10.1007/s12524-011-0121-3
C.S, Lal S, Michener W.K, Mitra A.P, Morris J.T, Myneni R.R, Naja M, Nemani R, Purvaja R, Raha S, Santhana Vanan S.K, Sharma M, Subramaniam A, Sukumar R, Twilley R.R and Zimmerman P.R, 2007. Environmental Monitoring Network for India. Science 316 (5822), pp. 204 – 205, DOI: 10.1126/science.1137417.
Velmurugan, A., Krishan, G., Dadhwal, V.K., Kumar, S., Swarnam, T.P. and Saha, S.K., 2009. Harmonization of soil organic carbon estimation in historical and current data.
Current Science, 97(4): pp. 554-557.
Wani, N., Velmurugan, A., Dadhwal, V.K., 2010. Assessment of agricultural crop and soil carbon pool in Madhya Pradesh.
Tropical Ecology, 51(1), pp. 11-19.
References from Other Literature:
Doney, S.C. and Hood, M., 2002. A Global Ocean Carbon Observation System, A Background Report, Global Ocean Observing System Report No. 118, UNESCO
Intergovernmental Oceanographic Commission IOC/INF-1173,
55p.
IPCC (1995) – Greenhouse Gas Inventory Reporting Instruc-tions – IPCC Guidelines for National Greenhouse Gas Invento-ries, Vol. 1, 2, 3, IPCC, IEA, OECD, 1995.
Nayak, R. K. and Dadhwal, V.K., 2011a. Variability of atmospheric CO2 over India and Surrounding Oceans and
control by Surface Fluxes, The International Archives of the Photogrammetry, Remote Sensing and Spatial Information
Sciences, Vol. 34, Part XXX.
Nayak, R.K. and Dadhwal, V.K., 2011b. Inter-annual variability of net ecosystem productivity over India. The International Archives of the Photogrammetry, Remote Sensing
and Spatial Information Sciences, Vol. 34, Part XXX.
Sharma N., Nayak, R.K., Dadhwal, V.K., Kant, Y., Ali, M. M., 2011. Diurnal and seasonal variation of measured atmospheric CO2 at Dehradun during 2009ISPRS Archives XXXVIII- 8/W20;
Workshop Proceedings: Earth Observation for Terrestrial