www.ann-geophys.net/26/2597/2008/ © European Geosciences Union 2008
Annales
Geophysicae
High time resolution boundary layer description using combined
remote sensing instruments
C. Gaffard1, J. Nash2, E. Walker2, T. J. Hewison1, J. Jones2, and E. G. Norton3
1Met Office, University of Reading, Meteorology Building 1U20, P.O. Box 243, Earley Gate Reading RG6 6BB, UK 2Met Office, FitzRoy Road, Exeter, Devon EX1 3PB, UK
3University of Manchester, Atmospheric & Environmental Sciences, Simon Building Manchester M13 9PL, UK
Received: 8 October 2007 – Revised: 1 July 2008 – Accepted: 14 July 2008 – Published: 5 September 2008
Abstract. Ground based remote sensing systems for future observation operations will allow continuous monitoring of the lower troposphere at temporal resolutions much better than every 30 min. Observations which may be considered spurious from an individual instrument can be validated or eliminated when considered in conjunction with measure-ments from other instrumeasure-ments observing at the same loca-tion. Thus, improved quality control of atmospheric pro-files from microwave radiometers and wind profilers should be sought by considering the measurements from different systems together rather than individually. In future test bed deployments for future operational observing systems, this should be aided by observations from laser ceilometers and cloud radars. Observations of changes in atmospheric pro-files at high temporal resolution in the lower troposphere are presented from a 12 channel microwave radiometer and 1290 MHz UHF wind profiler deployed in southern England during the CSIP field experiment in July/August 2005. The observations chosen were from days when thunderstorms oc-curred in southern England. Rapid changes near the sur-face in dry layers are considered, both when rain/hail may be falling from above and where the dry air is associated with cold pools behind organised thunderstorms. Also, short term variations in atmospheric profiles and vertical stability are presented on a day with occasional low cloud, when thunder-storms triggered 50 km down wind of the observing site Im-proved quality control of the individual remote sensing sys-tems need to be implemented, examining the basic quality of the underlying observations as well as the final outputs, and so for instance eliminating ground clutter as far as possible from the basic Doppler spectra measurements of the wind profiler. In this study, this was performed manually. The potential of incorporating these types of instruments in fu-ture upper air observational networks leads to the challenge
Correspondence to:C. Gaffard ([email protected])
to improve the observing systems and also to exploit mea-surements at high temporal resolution in numerical weather prediction. These examples are intended to inform potential operational users of the changes in atmospheric structure that can be observed with the new types of observing system. Keywords. Meteorology and atmospheric dynamics (Con-vective processes; Mesoscale meteorology) – Radio science (Remote sensing)
1 Introduction
The aim of the convective storm initiation project (CSIP) in 2005 was to understand the mechanisms responsible for the initiation of precipitating convection in the maritime environ-ment of southern England (Browning et al., 2007). Thunder-storm and rain associated with deep convection are difficult to forecast (Collier, 2007). Such events, responsible for dev-astating flooding and flash flood are often localised in space and time. For instance, in 2004, a localised rain event of 140 mm in 5 h was responsible for a flash flood at Boscas-tle in Cornwall (Golding, 2005). Adequate representation of this event required the use of high resolution models under development to better represent the deep convection (Lean, 2003).
1988; Couvreux et al., 2007). CSIP gave the opportunity of testing how various measurements can be integrated together. CSIP studies were to suggest improved designs and new in-strumentation for future operational observational networks, and also improvements in the methods used to assimilate into numerical weather prediction models. This should then lead to improvements in forecasting severe weather.
This paper focuses on analysis of selected events using measurements from a wind profiler and microwave radiome-ter, collocated at Linkenholt (in central southern England), the UK network of GPS receivers and the UK operational weather radar data. Examples of variations in atmospheric structure at high time resolution, possibly associated with convection are evaluated on 24 and 29 June 2005 and on 25 August 2005. We first present the instrumentation and then show examples of rapid changes in the boundary layer asso-ciated with convection either over the observing site or close to the observing site, or downwind of the observing site. Dis-cussions and conclusions from the case studies analyses will indicate whether the high temporal resolution variations ob-served are significant for future observing requirements. This information will be used in future test bed studies to deter-mine whether the observations can be smoothed over much longer periods with the high temporal resolution measure-ments considered irrelevant for development of operational numerical weather prediction in future.
2 Instrumentation
During the summer of 2005, the Met Office deployed a mi-crowave radiometer, to Manor Farm, Linkenholt (GPS posi-tion: 51.19.05 N 1.28.33 W 185 m, 19 km north of Chilbolton research radar, co-located with the wind profiler of the Uni-versities’ Facility for Atmospheric Measurement (UFAM).
This study uses observations from the Radiomet-rics TP/WVP-3000 microwave radiometer (G¨uldner and Spankuch, 2001), but with a rapid observing cycle to allow the passage of cloud to be resolved for the first time with this type of radiometer in the UK. The radiometer viewed in the zenith direction with very high time resolution (∼12 s). At-mospheric radiances were observed sequentially in 12 chan-nels: seven in the oxygen band 51–59 GHz, which provide information primarily on the temperature profile and five be-tween 22–30 GHz near a water vapor line, which provide cloud and humidity profile information. The radiometer sys-tem included sensors to measure pressure, sys-temperature and humidity at ∼1 m above the surface. The instrument’s in-tegral rain sensor was used to reject periods which may be contaminated by scattering from precipitation, and emission from raindrops on the radome, which may bias the calibra-tion. The radiometer incorporated a recently designed blower to minimize the retention of raindrops on the radome. The radiometer also incorporated a zenith-viewing infrared
ra-diometer (9.6–11.5µm) to provide information on the cloud base temperature.
Water vapour channels were calibrated by hourly tip curves, at 5 angles in the North-South plane, except between 11:00–13:00 UTC, when there was a risk of contamination by the Sun. Oxygen band channels were calibrated with liq-uid nitrogen on 21 June 2005.
All channels also viewed the internal black body target for relative calibration, initially every 5 min. From 23 June to 8 July 2005 a configuration error stopped the internal calibra-tion cycle between 11:00–13:00 UTC and the output from the radiometer became unreliable in this time interval.
Temperature, humidity and liquid profiles were obtained from the microwave brightness temperatures using the man-ufacturer’s neural network retrieval, trained using radiosonde measurements and a radiative transfer model (Solheim, 1998). The accuracy of the retrievals was evaluated against radiosonde measurements (Hewison, 2007), with accuracy decreasing with height from 0.6 K near the surface to 1.5 K at 3.3 km for the temperature profiles and from 0.5 g/m3near the surface to 1.1 g/m3 between 1–2 km for water vapour. Vertical resolution for temperature measurements for this type of radiometer was estimated to be about half the height from the surface in the region 0 to 3 km, e.g. about 500 m at 1 km, whilst for water vapour measurements it was around 500 m from the surface to about 1.5 km, then increasing to about 1 km at 2.5 km (Cimini et al., 2006). In practice this means the radiometer would normally identify the existence of a significant temperature inversion below 1 km but would find difficulty in identifying inversions at heights above 1 km. The wind profiler deployed with the microwave radiome-ter was a 1290 MHz UHF pulse Doppler radar system de-signed by Degreane Horizon. Most of the time, the profiler operated in a single mode, switching sequentially between its 3 beams. The set up of the wind profiler was intended to capture high time resolution events, with a full observation cycle lasting around a minute and a half, much shorter than the cycle used by operational wind profilers in the UK. The wind profiler provided data from 150 m to 3500 m above the ground level with a resolution of 150 m and an overlap be-tween range gates of 50%. Wind measurements in the first 5 range gates were made possible by attenuating the signal to protect the receiver from leakage from the transmitted pulse, so the signal to noise ratio in these first gates is not com-patible with the rest of the range gates. A temporary clutter fence was erected around the wind profiler, but this did not prove very effective at suppressing ground clutter. So, great care has been taken to avoid the use of observations where ground clutter was introducing errors into the wind or signal to noise measurements.
Here again, the system was set up to provide integrated wa-ter amount as often as possible, every fifteen minutes using 15 min centred integration time. Operational plots of GPS water vapour include the positions of cloud to ground light-ning strikes detected by the Met Office operational lightlight-ning detection system, e.g. see the purple rectangles in Fig. 3e and Fig. 6.
The Met Office operates a network of 12 weather radars. They provide composite images of rainfall rate continuously over UK with a 1 km to 5 km grid size resolution depending on the range from the radar. The beam-width is 1◦ and the lowest elevation angle can be 0 or 0.5◦. The data used in this study were produced every 15 min and were taken with a 5 min acquisition time.
Radiosondes used in the study were launched from Larkhill and Chilbolton, situated 38 km south-west and 19 km south of Linkenholt, respectively.
3 Rain evaporation boundary layer cooling
On the 24 June 2005 widespread thunderstorms occurred in southern UK and the Midlands, resulting in a couple of flash floods. The outbreaks were associated with a trough aligned approximately south west to northeast across central southern England, with a cold front located much further to the west over the Irish Sea all day. Early in the morning most of the storms were located in southwest England, and were in the vicinity of Linkenholt from about 06:00 UTC to 14:00 UTC and occurred further east later in the day. Two different conditions will be considered, the first with a very dry layer over Linkenholt, with thunderstorms near but dy-ing out over Linkenholt early in the morndy-ing, and the second with a pool of drier air behind an organised line of thunder-storms passing over Linkenholt at 14:00 UTC.
3.1 High temporal resolution atmospheric structures in a very dry boundary layer
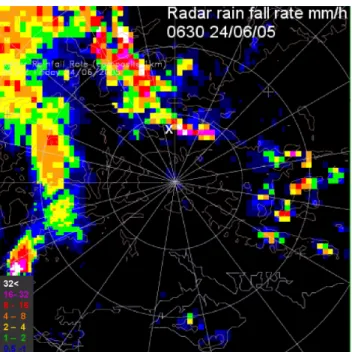
Weather radar samples in the morning between 06:15 UTC and 07:15 UTC are shown, see Fig. 3a to d. Radar samples were a combination from the operational weather radar lo-cated at Chenies at 85 km to the east north east and 155 m above sea level and Warden Hill located about the same dis-tance to the southwest. The lowest layer seen by either radar over Linkenholt at this range would be centred at 900 m above sea level and was 1.5 km deep in the vertical and 1.5 km wide.
One end of a band of lightning activity about 70 km in length moved north-eastwards just to the west of Linken-holt at about 15 ms−1. This band was aligned approximately from north west to south east at 06:00 UTC, see Fig. 3e and the south eastern end passed near Linkenholt between 06:15 and 06:30 UTC. The storms at the eastern end of the band died out shortly after passing Linkenholt. The lightning
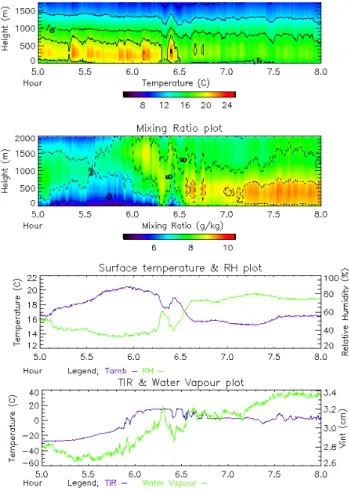
ac-Fig. 1.Microwave radiometer retrieval showing temperature, mass mixing ratio, -height cross sections for 0–2 km height, 24 June 2005, 05:00–08:00 UTC. Time series of surface temperature and relative humidity, integrated water content and infrared temperature are also shown.
tivity was associated with a number of smaller cells rather than a large area of deep convection. In Fig. 3a lightning strikes were observed from small high intensity cells at about 45 km and 70 km to the northwest of Chilbolton (with light-ning strikes also observed from the cell about 75 km to the southwest of Chilbolton). In Fig. 3b the high intensity cell about 25 km slightly west of north from Linkenholt was the final lightning event at the southeast end of the band of activ-ity. One more strike was detected from the cell about 60 km to the southeast of the bulls eye in Fig. 3c and after that no more lightning was detected close to Linkenholt for about 2 h.
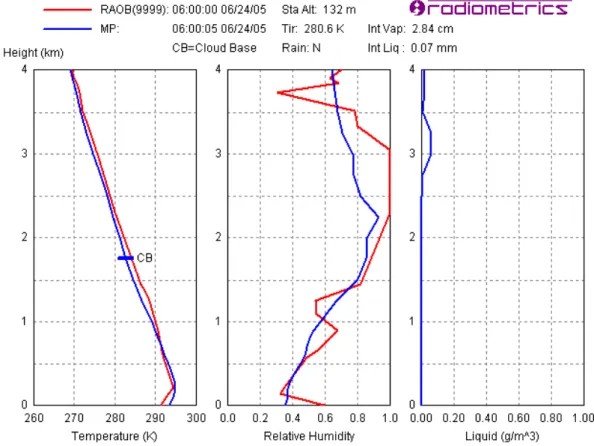
Fig. 2.Atmospheric profiles of temperature, relative humidity and liquid water measured by a radiosonde launched from Larkhill (RAOB, red line) and retrieved by microwave radiometer at Linkenholt (MP, blue line). 6 June 2005, 06:00 UTC.
Figure 1 shows the time height cross section of tempera-ture, mixing ratio profile and surface and infrared measure-ments and integrated water content between 05:00 UTC and 07:00 UTC as produced by the radiometer. At 05:00 UTC there was a temperature inversion of nearly 5◦with the max-imum temperature at 300 m. The maxmax-imum temperature in the inversion showed an upward trend in general up to about 06:10 UTC. After this the temperature dropped significantly and then rose again to a final maximum at about 06:30 UTC. The air in the lowest layers mostly cooled between 06:00 and 06:40 UTC when the inversion became less pronounced.
The radiometer observed dry air near the surface at 05:00 (relative humidity 55%, mixing ratio 6 g/kg. This lowest air became drier with time until 05:50 UTC (35%). At 06:19 UTC, the mixing ratio measured by the radiometer at 100 m increased rapidly to about 8 g/kg and then after 6 min returned to 6 g/kg and then finally increased to 8 g/kg at 06:30 UTC. The microwave radiometer liquid water mea-surements indicated cloud overhead between 1 and 2 km from 06:00 UTC to about 06:40 UTC.
This warm dry air near the surface was also observed by a radiosonde launched at 06:00 UTC at Larkhill about 35 km to the west from Linkenholt. (Fig. 2). At this time the end of the band of lightning activity was about 50 km to the west south west of Larkhill. The radiosonde supports the profiles
re-ported by the radiometer although the temperature inversion was slightly less sharp at Linkenholt that at Larkhill possibly the result of the poorer vertical resolution of the radiome-ter measurement. At 200 m the vertical resolution is at best around 100 m (Cadeddu, 2002). The GPS IWV measure-ments suggested that the dry warm layer was also found at this distance inland from the coast at distances up to 150 km to the east towards London, but not near the south coast.
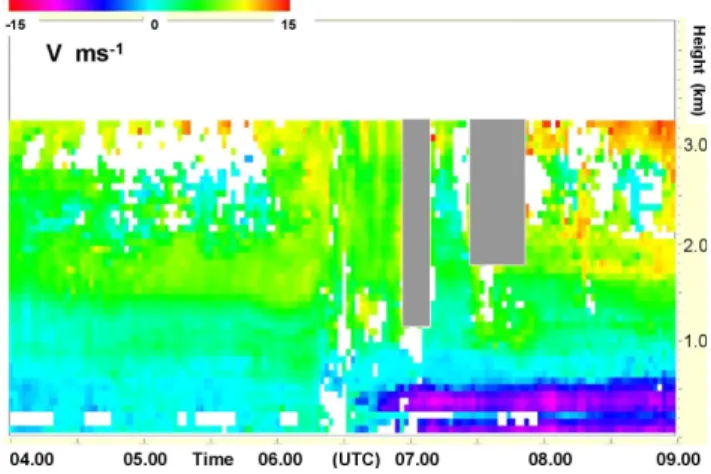
The wind profiler measurements of wind component U
Fig. 3a. Composite weather radar rainfall for the 24 June 2005 at 06:15 UTC. The white cross indicate Linkenholt site. The rain rate/h is indicated by the colour scale on the bottom left. The bulls-eye is centred at the Chilbolton radar with the first and second cir-cles of radius 25 and 50 km.
Fig. 3b. Composite weather radar rainfall for the 24 June 2005 at 06:30 UTC. The white cross indicate Linkenholt site. The rain rate/h is indicated by the colour scale on the bottom left. The bulls-eye is centred at the Chilbolton radar with the first and second cir-cles of radius 25 and 50 km.
Fig. 3c. Composite weather radar rainfall for the 24 June 2005 at 06:45 UTC. The white cross indicate Linkenholt site. The rain rate/h is indicated by the colour scale on the bottom left. The bulls-eye is centred at the Chilbolton radar with the first and second cir-cles of radius 25 and 50 km.
Fig. 3e. GPS integrated water vapour processed by the Met Of-fice/University of Nottingham system, 24 June 2005, 06:00 UTC. Contours for values of IWV in kg m−2. Yellow contour is the limit of air with less than 30 kg m−2in southern England. Black star is location of Larkhill, black ellipse encloses the lightning activity which passed just to the northwest of Linkenholt. During the day the low values in northern England seemed inversely correlated to the thunderstorm activity in southern and central England.
At about 1.2 km above the ground there was strong verti-cal wind shear in theUcomponent between 04:00 UTC and 06:30 UTC and this correlates with a local maximum of sig-nal to noise in the vertical, and could be expected to indicate the layer where there was a relatively strong positive hydro lapse seen in the Larkhill radiosonde at this height.
Before 06:00 UTC, the winds between 2 and 3 km were typically between 13 and 15 ms−1from the southwest, and the band of thunderstorm activity was moving at a similar speed. After 07:00 UTC the westerly component at this level reduced to a slight easterly direction, with this change prob-ably taking place around 06:45 UTC and the southerly com-ponent may have increased a little in the long term. Thus, although the band of lightning activity was being driven by the winds above 2 km, there was a significant change in very low level winds associated with the passage of the organised band of lightning, and this change was associated with the change in atmospheric conditions near the surface.
The approach of the lower cloud associated with the light-ning activity can be seen from the measurements by the in-frared radiometer on the microwave radiometer, see Fig. 1, which indicate a cloud base at around 1.5 km had arrived by 06:10 UTC.
Then the temperature at 1 m above the ground started to decrease slowly by 1◦C in 9 min from 20.6◦C and this was followed at 06:19 UTC, by a sudden drop of temperature (1.8◦ in less than 2 min), associated with a sudden increase in relative humidity of 20 per cent. At the same time the in-tegrated water vapour measured by the microwave radiome-ter increased from 30 to 32 kg m−2 and the microwave ra-diometer indicated that temperatures fell by similar amounts between the surface and 1.25 km. the temperature inversion
weakened, and the humidity profile showed higher relative humidity from the surface to 1 km. 8 min later the surface temperature recovered by about 1.5◦C and the relative hu-midity had reduced by about 17 per cent. After this the tran-sition associated with the change in direction of the lowest winds took place and by 06:33 UTC, surface temperature had dropped to 15.8◦C and relative humidity had risen to near 72%. The rain sensor on the radiometer did not indicate rain reaching the surface, and in fact did not show any increase in voltage, so it is concluded that no rain was reaching the radiometer and corrupting its measurements.
The effect of rain on the wind profiler measurements was checked in detail using the Doppler Spectra. Doppler spec-tra with double peaks indicated either range aliasing in the vertical, heavy rain in the beam or heavy rain in a side lobe to the side of the profiler and radiometer. Double spectra were found for some heights at times between 06:20 and 06:31 UTC, within the times when stronger signals were ob-served above 2 km in Fig. 4c. So the sudden drop in surface temperature occurred just before the precipitation was ob-served at 2 km, i.e. just preceding the active part of the end of the band of lightning.
Figure 4d shows Doppler spectra from the vertical beam of the wind profiler (stacked as a function of height) corre-sponding to the 45 gates of the low mode for 06:23 UTC. The spectra are plotted using a logarithmic scale. The verti-cal speed measured by the wind profiler was heavily contam-inated by ground clutter at this period, probably due to the ex-istence of the dry layer near the surface, with the atmospheric signals very low compared to the ground clutter. The signa-ture of raindrops, falling with a vertical speed of between 2 and 3 ms−1, is quite clear down to 820 m. These average fall
speeds would be associated with relatively weak rainfall. At 595 m it is possible that limited numbers of drops are still contributing to the signal since the spectrum is skewed to-ward positive values.
Above 1420 m, the double structure of the spectra may be due to range aliasing from precipitation at high levels above 7 km (requiring very much stronger signals from heights at around 7 km) or from heavier rain observed in a side lobe. This gives supporting evidence for more intense convection occurring near Linkenholt, but not directly over the wind pro-filer and radiometer, as shown by the weather radar.
Fig. 4a. Wind U component measured by the wind profiler at Linkenholt 24 June 2005, 04:00 to 09:00 UTC from 75 to 3250 m a.g.l.
Fig. 4b. Wind V component measured by the wind profiler at Linkenholt 24 June 2005, 04:00 to 09:00 UTC from 75 to 3250 m a.g.l.
surface temperature dropped permanently and the very dry layer disappeared. This was due to a change in the air be-ing advected over Linkenholt, since the wind direction and speed observed by the wind profiler changed significantly at 06:30 UTC. By 07:15 UTC, the weather radar shows that all the showers in the area (Fig. 4d) had vanished, with no short term convection present any longer. So it can be seen that the microwave radiometer system was able to measure detailed changes in the lowest layers of the boundary layer, associated with the colder pools of air generated by rainfall evaporation into very dry air, as well as with the change of air mass which led to a temporary respite in thunderstorm activity. These variations would not have been taken seriously, without the supporting evidence from the other observing systems.
With respect to deploying observing systems in future for this type of experiment or operation, the problems in iden-tifying range aliasing show that although detailed
measure-Fig. 4c. Range corrected signal to noise ratio in dB measured by the wind profiler at Linkenholt 24 June 2005, 04:00 to 09:00 UTC from 75 to 3250 m a.g.l.
Fig. 4d. Stacked as a function of height of Doppler spectra from the vertical beam corresponding to the 45 gate of the low mode for 06:23 UTC. The height of the gate above the ground level is indi-cated on the y-axis, The Doppler velocity on x-axis. Each spectrum is plotted using a logarithmic scale for the power. Positive velocity is for motion towards the wind profiler.
ments in the boundary layer are a priority it is also necessary to operate the wind profiler with an interleaved high mode that can observe up to 8 km at least, which would allow bet-ter quality control of the low level measurements.
3.2 Characteristics of cold pool associated with an organ-ised line of thunderstorms
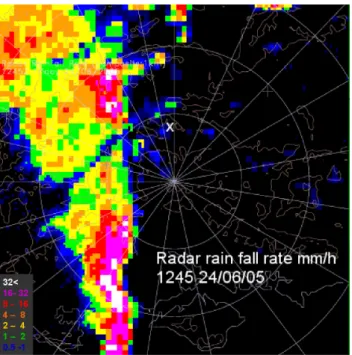
Fig. 5a. Composite weather radar rainfall for the 24 June 2005 at 12:45 UTC. The white cross indicate Linkenholt site. The rain rate/h is indicated by the colour scale on the bottom left. The bulls-eye is centred at the Chilbolton radar with the first and second cir-cles of radius 25 and 50 km.
Fig. 5b. Composite weather radar rainfall for the 24 June 2005 at 10:00 UTC. The white cross indicate Linkenholt site. The rain rate/h is indicated by the colour scale on the bottom left. The bulls-eye is centred at the Chilbolton radar with the first and second cir-cles of radius 25 and 50 km.
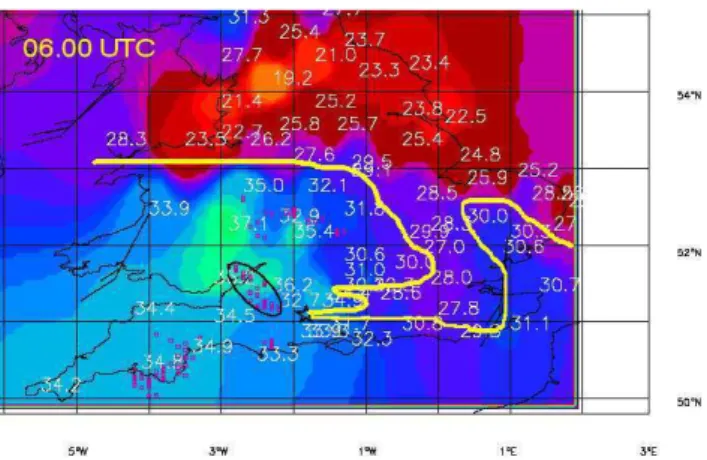
Fig. 6. GPS integrated water vapour processed by the Met Of-fice/University of Nottingham system, 24 June 2005, 14:00 UTC. Contours give values of IWV in kg m−2. Linkenholt is located at the edge of the lightning location at the centre of the 34 kg m−2 con-touring. The yellow band indicates the arc of weather radar echo that seems to be associated with the band of lightning in the south.
area. Figure 5a, b shows radar rain rate at 12:45 UTC and 14:00 UTC on 24 June 2005. At 12:45 UTC lightning strikes were associated with the rainfall cell to the northwest of Linkenholt and mostly with the line of activity stretching out over the sea from about 25 km south of Chilbolton. Here the activity was aligned essentially north south. At 14:00 UTC the area of lightning activity near Linkenholt had moved fur-ther east than in the south over the coast so a line of activ-ity stretched south from east of Chilbolton to the coast and within 15 min the southern half of this line had intensified into a very intense storm. Lightning strikes occurred near Linkenholt both in the intense small low level cells furthest east in Fig. 5b and in the less heavy rain to the east and north east of Linkenholt.
At 14:00 UTC the rain was just clearing above Linkenholt. The IWV calculated by the UK GPS network for the 24 June 2005 at 14:00 UTC is shown in Fig. 6. This shows a pool with lower IWV to the west of the convective storm, with measurements lower than 34 kg m−2, whereas in the part of the storm close to the line of lightning activity the measure-ments were close to 40 kg m−2. The microwave radiometer
showed values of about 40 kg m−2between 13:20 UTC and
13:50 UTC which then dropped very rapidly to 31.8 kg m−2
between 13:20 and 13:40 UTC, the radiometer measurements should not be treated as fully reliable, but the structure fol-lowing 14:00 UTC should be of good quality. The measure-ments from the infrared radiometer, Fig. 7, support the idea that the cloud base during the heavy rain had a temperature close to 21◦C as indicated in the temperature inversion re-ported by the microwave radiometer at about 500 m above the ground, and that this reduced below 20◦C in the dry air behind the rain. The inversion disappeared at 14:40 UTC, when the middle level cloud disappeared, as indicated by the infrared radiometer. Most of the lower troposphere above the inversion cooled with time during this period. Before the storm the surface temperature at Linkenholt was about 19.1◦C, and this fell from 12:40 UTC until it reached 15.4◦C at 14:00 UTC and then gradually recovered back to about 19.6◦C at 15:00 UTC. The radiometer indicated a shallow cool moist layer near the surface from 13:20 UTC onwards again probably due to evaporative cooling into drier air, lead-ing to a temperature inversion at the surface (Fig. 7).
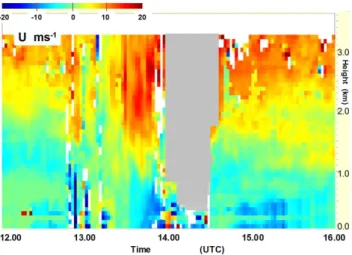
Plots of the winds and signal to noise ratio with time mea-sured by the wind profiler at from 12:00–16:00 UTC are shown in Fig. 8a to c. Before the storm commenced at 12:00 UTC the winds near 500 m at Linkenholt were about 2 m s−1 from the north, whilst at 1 km were about 6 m s−1 from just south of east and at 2 km about 10 m s−1from the south. This layer of easterly winds overlaid by southerly winds was present across much of southern England at this time.
The depth of the layer near the surface with a northerly wind component increased to about 1.5 km at 13:00 UTC and then dropped to about 500 m at 13:40 UTC. During the period from 13:15 UTC onwards the u component above 1.5 km in-creased to about 15 m s−1, which suggested that at this level
the air was moving at a similar speed to the rain cells in the east west direction, whereas after 13:30 UTC the air be-tween the surface and 700 m had an easterly component and was flowing at a relatively fast speed away from the thun-derstorm activity. The driest air behind the storm was lo-cated between 0.8 and 1.8 km according to the radiometer, and the wind measurements between 13:40 and 14:00 UTC suggest that the dry air was being fed northwards into the system by the relative maximum in v component between 1.2 and 2.2 km seen from 13:40 UTC onwards, with the air near the surface being left behind as an outflow from the sys-tem, having been cooled as water evaporated into the dry air at the interface between the dry air and the precipitation. As the dry air interacted with the convection it would have been moistened from above, so the drier air at the end of the pre-cipitation is located at lower than in the dry air behind the system. The presence of the positive wind shear in thev
component suggests that there was a temperature gradient in the east west direction around 1 km with cooler air to the west from 13:40 UTC onwards, but unfortunately how long this persisted into the dry air behind the activity cannot be judged. The signals greyed out after 14:00 UTC were again
Fig. 7. Microwave radiometer retrieval showing temperature, rel-ative humidity and for 0–2 km height, 24 June 2005, 12:00– 16:00 UTC. Radiometer calibration in error from 12:00 to 13:00, and radiometer measurements should be ignored in this period. Time series of scalars are also shown surface temperature and sur-face relative humidity, infrared brightness temperature, and inte-grated water vapour.
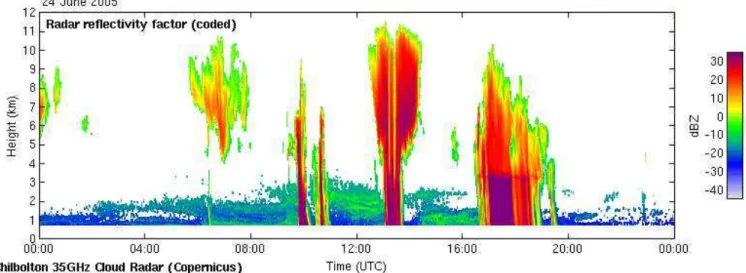
caused by range aliasing with weak signals near the ground being dominated by very strong signals from precipitation from higher up (above 7 km), but being reported between 0–3 km. The range aliasing was readily identified because the winds (horizontal and vertical) reported were far too high to have originated between 0 and 3 km on this day. Confir-mation of large amounts of cloud at upper levels with dry air underneath following the line of storms can be seen from the cloud radar located at Chilbolton (20 km south) at about 14:00 UTC, where the upper cloud extends from 5 to 11 km (Fig. 9).
Fig. 8a. Wind U component measured by the wind profiler at Linkenholt 24 June 2005, 12:00 to 16:00 UTC from 75 to 3250 m a.g.l., doubtful measurements are greyed out.
Fig. 8b. Wind V component measured by the wind profiler at Linkenholt 24 June 2005, 12:00 to 16:00 UTC from 75 to 3250 m a.g.l., doubtful measurements are greyed out.
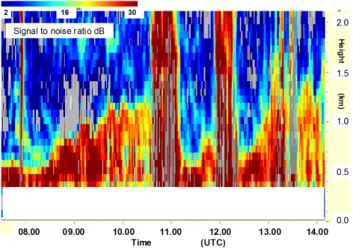
boundary layer is due to less turbulence in the free atmo-sphere, (Bianco, 2002). On this example, the top of the boundary layer is shown by the black line in Fig. 8c. This had collapsed earlier due to the cold pool generated by evap-oration of rain into the dry air behind the thunderstorms. The boundary layer then increased in height from 14:30 UTC on-wards, as the surface warmed by solar heating.
So in the afternoon the dry, cold air behind the storm was organised on a horizontal scale of about 100 km (see the weather radar arc associated with the activity in Fig. 6), which was a little less than the dimensions of the line of thun-derstorms. The supply of drier air appears associated with a downdraught formed via drag and evaporation of the precip-itation in the line of thunderstorms.
Fig. 8c.Range corrected signal to noise ratio measured by the wind profiler at Linkenholt 24 June 2005, 12:00–16:00 UTC. The esti-mated top of the boundary layer is marked with a black line.
Thus it can be seen that the combination of remote sens-ing observsens-ing systems can be used to sense organisation on scales of about 100 km as well as the very detailed informa-tion associated with individual small scale storms. The ac-tual collapse of the boundary layer cannot be clearly seen from the wind profiler measurements in Fig. 8c, because of the range aliasing.
3.3 Characteristics of cold pool associated with a develop-ing thunderstorm
Fig. 9.Time height cross section of reflectivity measured the 35GHz cloud radar at Chilbolton. (from cloudnet website: www.met.rdg.ac. uk/radar/cloudnet/).
seen near Linkenholt in Fig. 10d, the surface temperature cooled to about 11◦C and following the shower the IWV fell very rapidly to 14 kg m−2(maximum values of IWV preced-ing the main part of the shower were about 20 kg m−2, see IWV contours in Fig. 10d). The pool of cold air near the surface (surface temperature lower than 12◦C) was observed by CSIP surface measurements, and seemed to stretch for about 50 km behind the first shower. The cold pool shown in Fig. 10d covered the area where measurements were avail-able. A radiosonde measurement on the south coast near 2◦W showed evidence of cooling of a depth of 250 m at 13:00 UTC, probably following another local shower. In Fig. 10c the microwave radiometer shows that the drier air behind the shower was located between 0.2 and 2 km.
4 Convective thermals
On 29 June isolated thunderstorms occurred about 50 to 80 km north and northeast of Linkenholt, organising into a line to the northeast for just over 20 min from 15:00 UTC. CSIP analyses of the initiation of the thunderstorms this day concluded that the storms started once high level cloud cover moved away from central and southern England. The cloud to ground lightning strike activity started at about 13:45 UTC, with the nearest storm causing a flash flood at Oxford.
Figure 11a shows the time height evolution of the temper-ature profile measured by the radiometer between the sur-face and 1000 m between 13:00 UTC and 19:00 UTC. This period of time is characterised by a succession of unstable then stable condition near the surface, with two typical verti-cal profiles from the start of the period shown in Fig. 12. The unstable profiles (super-adiabatic) are associated with higher surface temperature than the more stable profiles which have
lower dew point and hence mixing ratio. This may be the results of entrainment of air from above the boundary layer, e.g. see Couvreux et al. (2007).
Low cloud, cloud base at about 900 m, moved across Linkenholt from time to time during the afternoon, as shown by the infrared temperature increasing from−40 to +12◦C eight times in the observing period, with the lower surface temperatures often correlated with the presence of low cloud, but not always. Thus shadowing by the cloud would have influenced the surface temperatures, and thus the convec-tive conditions in the boundary layer. The oscillation in the surface temperature shows a periodicity of about 20 min; see Fig. 11d, but the variations in surface temperature stop after 16:30 UTC, when the radiometer measurements indi-cate a change to higher stability in the typical vertical pro-files of temperature and relative humidity. The network of GPS water vapour measurements indicated that air with higher integrated water vapour amounts(originally near the coast) had moved northwards over Linkenholt by 18:30 UTC. The drier air observed between 14:00 and 16:00 UTC, see Fig. 11b, seemed localised to the area near Linkenholt, and with the integrated water vapour increasing with time as the air moved northwards from Linkenholt towards the thunder-storms. Thus, the conditions observed at Linkenholt were too dry for most of the afternoon to trigger deep convection, but the moistening of the boundary layer further north near the river Thames then allowed the deeper convection to initiate.
Fig. 10a. Signal to noise ratio measured by the wind pro-filer at Linkenholt 25 August 2005, 07:30–14:10 UTC from 75 to 2150 m a.g.l.
Fig. 10b. Microwave radiometer retrieval showing) temperature time-height cross sections for 0–2 km height, 25 August 2005, 10:00–13:00 UTC, plus time series of surface temperature, and in-tegrated water vapour. Purple lines indicate regions where the ra-diometer liquid water measurements showed liquid water reaching the surface, the green arrows indicate where IWV first started to fall quickly (indicative of where cooling plus incomplete saturation of dry air caused IWV to fall) and yellow arrow where the driest air was first detected.
15:20 UTC and then between 1.1 to 1.9 km from 15:20 to about 17:00 UTC, after which the top of the boundary layer fell with time. The boundary layer was highest when cloud bases were detected at 900 m by the infrared sensor. Two radiosondes were launched from Larkhill during this period. The first at 12:00 UTC showed the top of boundary layer at about 1200 m, with the mixing ratio of water dropping from greater than 7.9 in the boundary layer to 6.6 g/kg at about 1.5 km. The second at 15:00 UTC, showed the top of the
Fig. 10c.Microwave radiometer retrieval showing temperature, rel-ative humidity and liquid water time-height cross sections for 0– 2 km height, 25 August 2005, 10:00–13:00 UTC.
Fig. 10d.Composite weather radar rainfall for the 25 August 2005 at 12:00 UTC. The white cross indicates the Linkenholt site. The rain rate/h is indicated by the colour scale on the bottom left. The bulls-eye is centred at the Chilbolton radar with the first and second circles of radius 25 and 50 km. Integrated water vapour contours are superimposed in orange at 2 kg m−2intervals. The position of the cold pools of air close to the surface cooler than 12◦C observed by the automatic weather stations deployed for CSIP are indicated by the white contours filled with light purple.
Fig. 11.Microwave radiometer retrieval showing(a)temperature,(b)relative humidity and(c)liquid water time-height cross sections for 0–1 km height, 29 June 2005, 13:10–19:10 UTC. Time series of scalars are also shown in red for(d)surface temperature,(e)surface relative humidity,(f)pressure,(g)infrared brightness temperature,(h)rain sensor,(i)integrated water vapour and(j)integrated liquid.
The succession of strong and low signals between 2 and 3 km does not coincide necessarily with the detection of cloud by the infrared radiometer, but the cloud detection be-tween 13:00 and 16:00 UTC does correspond to the down-drafts in the vertical velocity measured by the wind profiler above 2 km in Fig. 14. The radiosonde measurements sug-gest that the clouds were most likely forming near 3 km. Significant updrafts seem mostly limited to levels between 1 and 2 km. This layer between 1 and 2 km was also the layer in which theuandvwind components were significant, withuabout 6 ms−1above 1.2 km andvabout the same be-tween 13:00 and 16:00 UTC dropping to about 3 or 4 ms−1 by 18:00 UTC. Winds within the boundary layer were lighter than this throughout this period. The updrafts and possible downdrafts observed were mostly located above the bound-ary layer. Ground clutter was a problem in the boundbound-ary layer and seems to have limited the ability to measure vertical ve-locity accurately in the lowest range gates. Apart from the
downward vertical velocity in cloud, vertical velocities above 1 km were mostly updrafts from 13:00 to 15:00 UTC and in-significant after that.
Thus, the variations in signal to noise observed above the convective boundary layer were probably associated with cloud development, which was probably indirectly linked to the thermal activity in the convective boundary, with the variations and depth of the boundary layer falling after 17:30 UTC. Vertical velocities at all levels were small after 17:15 UTC.
10C 20C 800hPa
900hPa
1000hPa
Fig. 12.Tephigram showing profile of temperature (solid line) and dew point (dashed line). Blue and green lines show the profile re-trieved from the radiometer observation at Linkenholt, with a strong lapse rate near the surface at 13:32:42 UTC and more stable but drier conditions in the lowest km at 13:52:18 UTC. The dew point for the blue line corresponds closely to the radiosonde measure-ments at Larkhill at 12:00 and 15:00 UTC.
Fig. 13a. Range corrected signal to noise ratio measured by the wind profiler at Linkenholt 29 June 2005, 13:00–19:00 UTC form 75 to 3000 m a.g.l.
probable that the drier air is a result of entrainment from the layer above the top of the boundary layer.
An exact match with the temperature evolution seen by the radiometer and the wind profiler signal to noise and vertical velocity was not possible since the ground clutter contamina-tion in the vertical beam prevented reliable measurement of the vertical velocity below about 800 m.
On this day the radiometer and wind profiler show part of the vertical profile structures associated with cloud and boundary layer variation, full resolution of the conditions re-quires additional observing systems, such as laser ceilometer and cloud radar.
Fig. 13b. Wind U component measured by the wind profiler at Linkenholt 29 June 2005, 13:00 to 19:00 UTC from 75 to 3250 m a.g.l., doubtful measurements are greyed out.
Fig. 13c. Wind V component measured by the wind profiler at Linkenholt 29 June 2005, 13:00 to 19:00 UTC from 75 to 3250 m a.g.l., doubtful measurements are greyed out.
5 Discussion and conclusion
Ground based remote sensing instruments allow continuous monitoring of the lower troposphere. In this study, the in-struments were used for the first time in preoperational ex-periments at very high time resolution to study short term variations in the boundary layer, given that conventional ra-diosonde observations rarely have a temporal resolution bet-ter than 6 h.
The cooling of dry air in the boundary layer by rain evap-oration plays a very important role in storm development. It can enhance or slow down their activity.
temperature inversion was reduced by 2.5 degree. 5 min later the profile went back to its initial state. Such events can only be captured with high time resolution observing systems. 10 min later, the condition in the boundary layer changed per-manently and convection near Linkenholt died out. In the af-ternoon the dimensions of a cold pool were clearly identified by the GPS network. The microwave radiometer observed changes of vertical structure within the drier air. Again in this case evaporation of rain from the thunderstorms cooled the dry air behind the storm. The effect of the rain evapora-tion cooling on the height of the convective boundary layer can be captured by using the wind profiler signal to noise ra-tio, and this can be used to validate vertical profiles produced by the microwave radiometer.
Modification of temperature inversions and increase of the humidity in the lowest level is quite important in initiation of deep convection. It is quite important to know where the evaporation takes place. If it effectively reduces the cap-ping of the boundary layer, increased convection could oc-cur, but if the evaporation takes place close to the surface or the cooled air descends to this level, it can create a temper-ature inversion, as seen in the afternoon of 24 June after the storms, which might limit the extent of the convection.
Variations in low level thermal structure were captured on 29 June, by the radiometer and surface measurements. This was possible because of the high time resolution of the mi-crowave radiometer. Combining this information with the wind profiler measurements shows that updraft and down-draft were present. However it was not really possible to match the oscillation of the temperature with the vertical mo-tion observed because the vertical beam of this wind profiler was strongly contaminated by ground clutter. Choosing a suitable site for equipment for this type of experiment is crit-ical and needs to be done well in advance.
The combination of weather radar, radiometer, wind pro-filer, GPS sensors allowed us to follow 2 important mecha-nisms: latent heat exchange and thermal mixing. However, care has to be taken when interpreting radiometer results as they have limited vertical resolution. A modification close to the surface might propagate to a higher level because of the limited resolution. So further investigation and verification of this type of observation will be required, possibly using optical lidars to measure the vertical velocity in the bound-ary layer. While the wind profiler provides wind measure-ment very close to the surface, the Doppler spectra need to be checked to eliminate spurious signals, especially in the first 280 m above the surface. In this experiment the wind profiler was heavily contaminated by ground clutter, so the vertical speed was difficult to estimate. But the examina-tion of data at high time resoluexamina-tion does allow us to iden-tify updraft and downdraft between 1 and 2 km. Such mo-tions are not detectable in operational wind profiler modes when a half-hour consensus average is applied to the mea-surements. So, operational implementation of higher resolu-tion measurements will require improved quality control of
Fig. 14.Vertical speed measured by the wind profiler form the verti-cal beam at Linkenholt 29 June 2005, 13:00–19:00 UTC form 75 m to 3000 m a.g.l., the color scale goes from−150 cm/s to +150 cm/s.
the observations, with the quality checking that has been per-formed manually in this study, automated as far as possible.
The combination of all these instruments at high time res-olution is promising. The Met Office is currently in the process of upgrading its upper air observation network to meet some of the needs of high resolution numerical model (1.5 km). In that context test bed experiment are planned in the southern of UK in 2008. More instrumentation will be deployed on one site than used at CSIP, including cloud radar, a ceilometer, possibly a Doppler wind finding lidar, a radiometer and a wind profiler. The collocation of all the in-struments should allow us to produce a fuller characterisation of some of the fundamental processes affecting the boundary layer, and then to optimise affordable operational observing systems for the future. It will also provide a chance to de-velop data assimilation procedures to utilise the information in future.
Acknowledgements. Topical Editor U.-P. Hoppe thanks two anony-mous referees for their help in evaluating this paper.
References
Bevis, M., Businger, S., Herring, T. A., Rocken, C., Anthes, R. A., and Ware, R. H.: GPS meteorology: Remote sensing of at-mospheric water vapor using the global positioning system, J. Geophys. Res., 97, 15 787–15 801, 1992.
Bianco, L. and Wilczak, J. M.: Convective boundary layer mixing depth: Improved measurement by Doppler radar wind profiler using fuzzy logic, J. Atmos. Ocean. Technol., 19, 1745–1758, 2002.
N., Khodayar, S., Kohler, M., Kraut, S., Kunz, M., Ladd, D., Lenfant, J., Marsham, J., McGregor, J., Nicol, J., Norton, E., Parker, D., Perry, F., Ramatschi, M., Ricketts, H., Roberts, N., Russell, A., Schulz, H., Slack, E., Vaughan, G., Waight, J., Wat-son, R., Webb, A., Wieser, A., and Zink, K.: The Convective Storm Initiation Project, B. Am. Meteorol. Soc., 88(12), 1939– 1955, 2007.
Cadeddu, M. P., Peckham, G. E., and Gaffard, C.: The vertical reso-lution of a ground-based microwave radiometer analyzed through a multiresolution wavelet technique, IEEE Trans. Geosci. Rem. Sens., 40(3), 531–540, 2002.
Cimini, D., Hewison, T. J., Martin, L., G¨uldner, J., Gaffard, C., and Marzano, F.: Temperature and humidity profile retrievals from ground based microwave radiometers during TUC, Meteorolo-gische Zeitschrift, 15, 45–56, 2006.
Collier, C. G.: Flash flood forecasting: What are the limits of pre-dictability, Q. J. Roy. Meteorol. Soc, 133, 3–23, 2007.
Couvreux, F., Guichard, F., Masson, V., and Redelsperger, J.-L.: Negative water vapour skewness and dry tongues in the con-vective boundary layer, Observations and large-eddy simulation budget analysis, Bound. Lay. Meteorol., 123, 269–294, 2007.
G¨uldner, J. and Spankuch, D.: Remote sensing of the thermody-namic state of the atmospheric boundary layer by ground-based microwave radiometry, J. Atmos. Ocean. Technol., 75, 151–166, 2001.
Hewison, T. J.: Profiling temperature and humidity by ground based microwave radiometer, PHD, Department of Meteorology, Uni-versity of Reading, UK, 2007.
Klaus, V., Bianco, L., Gaffard, C., Matabuena, M., and Hewison, T. J.: Combining UHF radar wind profiler and microwave radiome-ter for the estimation of atmospheric humidity profiles, Meteo-rologische Zeitschrift, 15, 87–98, 2006.
Lean, H. W. and Clarke, P.: The effect of changing resolution on mesoscale modelling of line convection and slantwise circulation in FASTEX IOP16, Q. J. Roy. Meteorol. Soc., 129, 189–209, 2003.
Solheim, F., Godwin, J., Westwater, E., Han, Y., Keihm, S., Marsh, K., and Ware, R.: Radiometric Profiling of Temperature, Water Vapor, and Cloud Liquid Water using Various Inversion Methods, Radio Sci., 33, 393–404, 1998.