URINARY TRACT INFECTIONS:
IN VITRO STUDY
ABDULKAREEM H.ABD
1, MARWAH HASAN ABD
2,
FATMA ABDULHAMZA OBED
31 College of Medicine, Al- Nahrain University, Department of pharmacology 2 Almustansirya university, national centre of hematology, 3 almustansirya university,
national centre of hematology. Email: [email protected].
Received -11-02-14; Reviewed and accepted -28-02-14
ABSTRACT
The aim of this study to determined in vitro effects of various combinations of three antimicrobials (nitrofurantoin, gentamicin and ciprofloxacin) against twenty five E. coli
isolates and the role of plasmidDNA in antimicrobial resistance.
Method: Seventy five E. coli isolates were collected from urine of patients with urinary tract infections in AL-Kadhimia and AL-Yarmook teaching hospitals in Baghdad for a period between 22/11/2012 to 15/3/2013, from these samples twenty five isolates were selected according to their pattern of the highest resistance as these showing multi-drug resistances and tested to specify their minimum inhibitory concentration for (nitrofurantoin, gentamicin and ciprofloxacin. The plasmid profile for the twenty five E. coli
isolates were studied using Pure Yield ™ plasmid Miniprep system- Cat.# A1220 – Promega- USA. In order to determined the presence of plasmid for antimicrobials resistance.
Result :Among combinations the combination of nitrofurantoin with gentamicin showed high synergistic effect when 1/4+1/4 MIC for each antimicrobial were used. While combinations of nitrofurantoin with gentamicin and ciprofloxacin in some isolates showed additive effect when 1/2+1/2 MIC for each antimicrobial were used. ), nitrofurantoin was found having the lowest MIC comparing with others.Extraction of plasmidDNA indicates the presence of antimicrobial resistance plasmid in (A6, A37, A32, and A57) isolates.
Conclusion: Nitrofurantoin had more effect on E.coli and with high synergistic effect in combination with gentamicin against resistant Ecoli.that 18 isolates show synergistic effect, only2 isolate show additive effect, while combination of nitrofurantoin and quinolon better to be avoided that in vitro show antagonist effect.
Keyword: Urinary tract infection, E.coli, minimum inhibitory concentration, plasmid DNA.
INTRODUCTION
Urinary tract infections (UTIs) are one of the most common bacterialinfections in humans both in the community and hospital setting [1]. Escherichia coli have been documented to be the most important pathogen associated with symptomatic urinary tract infections [2].plasmid DNA molecule is separate from, and can replicate independently of, the chromosomal DNA. [3]
In this study we use combination of Nitrofurantoin which is a synthetic nitrofuran that is used to prevent and treat urinary tract infections [4].with Ciprofloxacin which is a synthetic chemotherapeutic antimicrobial of the fuoroquinolone drug class [5], and aminoglycosides which are polar compound with more activity against aerobic gram-negative bacilli and little activity against an aerobic bacteria and use with other antimicrobial agent against gram positive bacteria [6].
MATERIAL AND METHODS
The E. coli identification depended on morphological, biochemical
testes in addition to API 20E system. Susceptibility of isolates to seventeenth antimicrobials was tested using disk diffusion assay according to modified Kirby–Bauer method [7]. Meropenem, nitrfurantoin, amikacin and imepenem were to be the most effective antimicrobials, while the other antimicrobials were less effective. Minimum inhibitory concentration (MIC) was determined using tubes dilution method [8]. The combination of antimicrobials
weather it’s synergistic, additives, antagonistic, or indifference
depending on the fractional inhibitory concentration (FIC) was
determine as follow: (≤0.5) synergism, (0.5–<1) additive, (1–<4)
indifference,(≥4) antagonism, and calculated using the following
equation [9].
MIC for antibiotic in combination FIC = ———————————————
MIC for antibiotic alone
Plasmid DNA isolated using Pure Yield ™ plasmid Miniprep system, according to the manufacture manual. Then the extracted plasmid DNA was loaded in 0.8% agarose gel stained with ethidium bromide and electrophoresis for 60 minutes at 2V/Cm
using 1X TBE buffer. Then agarose gel was visualized using UV-transluminator.
RESULT AND DISCUSSION
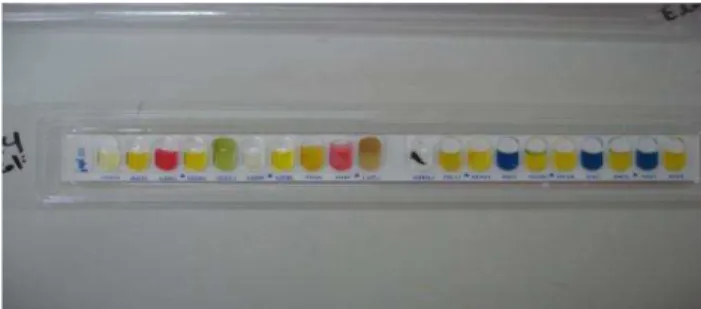
Colonies of E. coli had marked as aflat smooth and pink in color as a result of lactose fermentation in the media on MacConky agar, while on blood agar it gave small pink convex colonies surrounded by zone of β- haemolysis. InMicroscopic Examination it showed as small single bacilli non spore forming with red color (gram –negative bacteria), it occurred separately and singly, but often they are accumulated in groups. The result of biochemical tests for most of E. coli showed its ability to catalase production and lactose fermentation while it gave a negative result in Oxidase, Urease and Simmon Citrate tests. Further identification of the isolates was done by using Api 20E system, as in Figure {1}.
Fig. 1: Identification of E. coli by Api20E stem.
Antimicrobial Sensitivity Test
Qualitative Method (Disc Diffusion Test)
In this study we found that antimicrobials sensitivity among E. coli
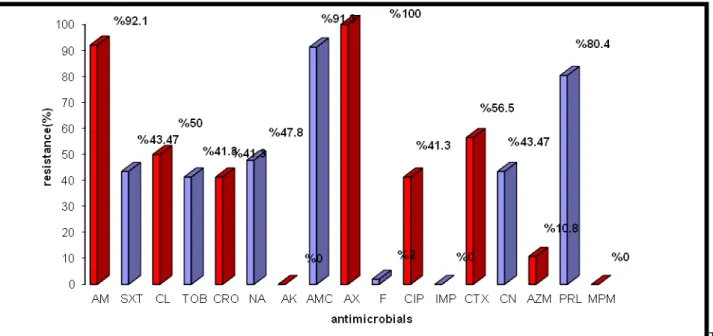
ToB:
Tobramycin; CN: Gentamicin; Sxt: Triomethoprime and sulfamethoxazole; Cip: Ciprofloxacin; Na: Naldixic acid; Ctx: Cefotaxime; Ipm: Imipenim;Am: Ampicillin; CL: Cephalexin; CRO:Ceftriaxone;AMC:Amoxicillin and Clavulonicacid; F:Nitrofurantoin;
AZM:Azithromycin;PRL:Pipracillin;MPM: Meropenem; AX:Amoxicillin AK:Amikacin
Fig. 2: Percentage of resistant E. coli isolates to antimicrobials.
Standard disc diffusion assay was used to detect the sensitivity of pathogenic bacteria and results obtained were compared with those of Clinical and laboratory standard institute [10].The results of the current study (Figure 2) revealed that most of E. coli isolates resist the β- lactam antimicrobials (like ampicillin and amoxicillin) [11].noted the high resistance rates of gram positive and gram negative species to penicillins and some of cephalosporins. Increasing of bacterial resistance rates to this group of antimicrobials may be a result of either production of β-
lactamase enzyme that had the ability to destroy the β- lactam ring in these antimicrobials [12, 13]. Also it may be due to minimizing the interaction of antimicrobials with target site (Penicillin Binding Proteins) [14].Augamentin ( amoxicillin + clavulanic acid) had more activity than other penicillin due to its presence of clavulanic acid, which inhibit β- lactamase enzyme, and increase the spectrum of amoxicillin against gram- positive and gram- negative bacteria [15].
Many research illustrated the higher activity of imipenem and meropenem (related to carbapenems group) against gram- positive and gram- negative bacteria [16].
Regarding aminoglycoside group, amikacin was more active than gentamicin on the current E. coli isolates, many researches showed that the increasing resistance against aminoglycoside group was due to production of the modified enzymes and losing outer membrane pores, which are responsible of permeability of surface cell layer to antimicrobials [17]. The current results (Figure 2) were in agreement with that of Shevelev et al. (2002) [18] who found in a study that the resistance percentage of the isolates to amikacin was (0%), while the resistant rate to gentamicin was (48.6%). The results also were in agreement with Bashir et al.
(2008) [19] who found in a study in Pakistan that the resistance
percentage of the isolates to gentamicin was (49%). Resistant to tobramycin was (40.7%) and this result was near that found by Pape et al. (2004) [20] who found that the resistant percentage of
E. coli to tobramycin was (30%).
Many studies were illustrated the activity of naldixic acid, and most of quinolones antimicrobials against wide range of bacteria that were in a good agreement with the currently result. For example the resistant rate to ciprofloxacin was (40.7%) this result was comparable to the result of Shamm et al. (2001) [21] found in a study that the resistant percentage of E. coli to ciprofloxacin was (39%).
Resistance to pipracillin was (85.5%), this result was in agreement with that of Bujdakova et al.(1998) [22] who found that (86%) of E. coli isolates resistant to pipracillin , and this may be due to the ability of E. coli to develop resistance to these antimicrobials through the production of β-lactamase enzyme which break the β -lactam ring of pipracillin.
Resistance to nitrofurantoin was (2.6%), this result was in agreement with Akyar (2008) [23] who found that the resistant rate
of E. coli against nitrofurantoin was (3%)
Resistance to trimethoprim/ sulfamethoxazole (SXT) was (43.4%), this result may be attributed to the wide use of (SXT) as empirical therapy for urinary tract infection, however this result was in agreement with Gupta; Hooton and Stamm (2001) [24] who found that the resistance to (SXT) among E. coli isolates from patient with UTIs has increased, with a prevalence of resistance which is reported 30 to 50 percent.
Quantitative Method (Minimum Inhibitory Concentration) (MIC)
Table 1: MIC value for three antimicrobials (µg/ml) tested against E. coli isolates.
E. coli
isolates
Gentamicin µg/ml
Ciprofoxacin µg/ml
Nitrofurantoin µg/ml
MIC MBC MIC MBC MIC MBC
A11 12.5 12.5 25 25 3.12 6.25 A13 300 300 200 300 12.5 25 A24 300 300 300 300 25 50 A28 200 200 200 200 12.5 25 A32 480 480 50 100 12.5 25 A35 200 300 200 300 25 50 A37 480 480 800 800 25 50 A41 100 200 200 300 6.25 12.5 A42 100 200 200 300 6.25 12.5 A43 200 300 200 300 25 50 A44 200 300 50 50 1.6 3.125 A45 200 300 300 400 12.5 25 A47 480 480 800 800 25 50 A51 100 200 200 300 6.25 12.5 A55 200 300 50 50 1.6 3.125 A57 480 480 300 300 25 50 A58 300 300 200 300 12.5 25 A67 300 300 200 300 12.5 25 LSD value 137.95 * 118.38 * 219.05 * 210.11 * 8.397* 16.80*
* (P<0.05), LSD: Least significant difference, MBC: minimum bactericidal concentration
Table 1 showed that MIC of nitrofurantoin ranged from (3.125 to
25 μg/ml), Garau (2008) conclude that microorganisms
considered susceptible to nitrofurantoin if their minimum inhibitory
concentration (MIC) was (32 μg/ml) or less [25]. Resistance to nitrofurantoin may be chromosomal or plasmid mediated and involves inhibition of nitrofuran reductase. Acquired resistance to nitrofurantoin in E. coli continues to be rare [26]. But MIC of ciprofloxacin ranged from (25-800 μg/ml), this result was
compatible with Muhammad Asif who found in his study that the MIC of Ciprofloxacin in E. coli was rang from (1-256 μg/ml) [27].
While MIC of gentamicin ranged from (12.5 to 480 μg/ml), this
result was in agreement with Jakobsem et al. [25] who found in his study that the MIC of gentamicin distributed from (8-› 512
μg/ml).
Antimicrobials Combination
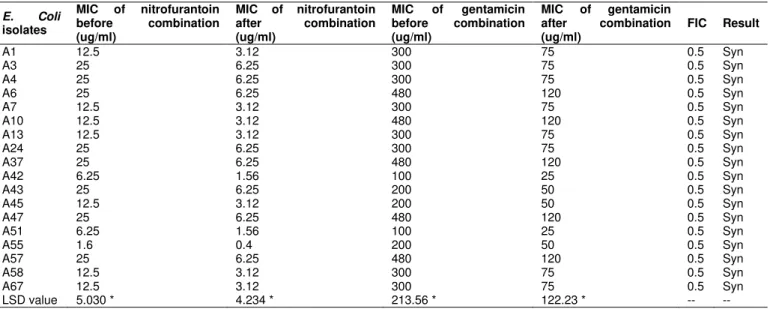
Table 2: the Result of combination of nitrofurantoin with gentamicin (1/4+1/4 MIC).
E. Coli
isolates
MIC of nitrofurantoin
before combination
(ug/ml)
MIC of nitrofurantoin
after combination
(ug/ml)
MIC of gentamicin
before combination
(ug/ml)
MIC of gentamicin
after combination
(ug/ml)
FIC Result
A1 12.5 3.12 300 75 0.5 Syn
A3 25 6.25 300 75 0.5 Syn
A4 25 6.25 300 75 0.5 Syn
A6 25 6.25 480 120 0.5 Syn
A7 12.5 3.12 300 75 0.5 Syn
A10 12.5 3.12 480 120 0.5 Syn
A13 12.5 3.12 300 75 0.5 Syn
A24 25 6.25 300 75 0.5 Syn
A37 25 6.25 480 120 0.5 Syn
A42 6.25 1.56 100 25 0.5 Syn
A43 25 6.25 200 50 0.5 Syn
A45 12.5 3.12 200 50 0.5 Syn
A47 25 6.25 480 120 0.5 Syn
A51 6.25 1.56 100 25 0.5 Syn
A55 1.6 0.4 200 50 0.5 Syn
A57 25 6.25 480 120 0.5 Syn
A58 12.5 3.12 300 75 0.5 Syn
A67 12.5 3.12 300 75 0.5 Syn
LSD value 5.030 * 4.234 * 213.56 * 122.23 * -- --
*(P<0.05); LSD: Least significant difference; Syn: Synergism; FIC: Fractional Inhibitory Concentration
The result in Table (2) shows that the synergistic effect noticed from combination of nitrofurantoin with gentamicin when tested on isolates No. (1, 3, 4, 6, 7, 10, 13, 24, 37, 42, 43, 45, 47, 51, 55,
57, 58, 67,) while isolate No. (2) Show additive effect but other isolate show no effect.
Table 3: Antimicrobials combination (1/2+1/2 MIC for each antimicrobials).
E. coli
isolates
Antimicrobials combination
MIC of first antimicroal alone (µg/ml)
MIC of
first antimicrobial in combination (µg/ml)
MIC of second antimicrobial alone (µg/ml)
MIC of second antimicrobial in combination (µg/ml)
FIC Results
A2 F+CN 12. 5 6. 25 200 100 1 Add
A4 F+CIP 25 12. 5 300 150 1 Add
A32 F+CIP 12. 5 6. 25 50 25 1 Add
On the other hand there is no synergistic effect noticed from combination of nitrofurantoin with ciprofloxacin Table (3), only there is additive effect noticed when tested on isolates No. (4 and 32).This result was in agreement with Call et al.(1978) whose found that nitrofurantoin and quinolon antimicrobials are mutually
antagonistic in vitro. It is not known whether this is of clinical significance, but the combination should be avoided.
Extraction of Plasmid DNA
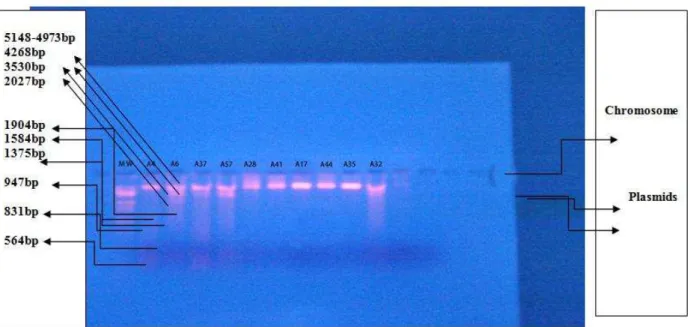
Figure 3: plasmid profile of E. coli strains Lane (A6, A37, A57, A32): Plasmid DNA extracted from E. coli strains; M.W: Molecular
weight marker of lambda DNA digested withEcoRI+HindIII . Electrophoresis was carried in 0.8% agarose gel at (2V/Cm) for 30 min.
The result of Figure (3)and (4) indicate that each of the isolates (A6 , A37)containing two bands of plasmid DNA with approximate molecular weight (2000 and 1900) bp comparing with molecular weight marker. Also, isolates no. (A32, A57) containing one plasmid DNA with approximate molecular weight (2000) bp when comparing with molecular weight marker.
There are many studies referred to the isolation of antimicrobial
resistance plasmid from E. coli. Joseph et al. (2001) [28] found in their study that E. coli isolates contain plasmid coding for resistance of aminoglycoside antimicrobials, including gentamicin and tobramycin. Also, March Galimand et al. (2003) [29] found in their study that E. coli isolated from patient suffering from urinary tract infection contain plasmid coding high level of resistance to aminoglycoside.
Figure 4: plasmid profile of E. coli strains isolated from UTIs patients Lane (A6, A37, A57, A32): Plasmid DNA extracted from E. coli
strains; M.W: Molecular weight marker of lambda DNA digested withEcoRI+HindIII . Electrophoresis was carried in 0.8% agarose gel
Piddock (1999) [30] found in his study that E. coli contain plasmid coding for resistance of flouroquinolone .Sisson et al. (2002) [31] found in their study that resistance to nitrofurantoin may be chromosomal or plasmid mediated. Minch chau phuc Nguyen et al. [32] found in their study that the plasmid gene that confers resistance to azithromycin had recently emerged in non multidrug resistant E. coli; Philippon; Arlet and Jacoby (2002) [33] found in their study that E. coli contains plasmid coding for resistance of ampicillin. In the other hand, other E. coli isolates that show no plasmid may be due to carrying plasmids with low copy number.
REFERENCE
1. David, S.; and Howes, MD.Urinary tract infection in female; 2009; 27.
2. Musa-Aisien, AS.; Ibadin ,OM.; and Ukoh ,G. Prevalence and antimicrobial sensitivity pattern in urinary tract infection in febrile under-55 at a childrens emergency unit in Nigeria.Annual of tropical pediatric; 2003;23:39-45.
a. Lipps G. Plasmids: Current Research and Future Trends; Caister Academic Press; 2008.
3. Laurence, L.; Brunton, Phd.; Keith, L.; Paker, MD., Phd. (2008): In Goodman and Gilmanś .Manual of pharmacology and therapeutics. 11th ed. Mc Graw- Hill companies. PP. 707. 4. Nelson, JM.; Chiller, TM. Powors, JH.; and Angulo, FJ. (2007):Fluoroquinolon – resistant campylobacter species and the withdrawal of flouroquinolones from the use in poultry: a public health success story. Clin. Infec. Dis. 44(7): 977-980. 5. Falagas, ME.; Grammatikos, AP.; and Michalopoulos, A.
Potential of old-generation antibiotics to address current need for new antibiotics. Expert. Rev.Anti. Infect. Ther; 2008; 6(5): 593-600.
6. Vandepitte, J.; and Verhaegen, J.; Engbaek, K.; Rohner, P.; Piot ,P.; Heuck ,C.C.Basic laboratory procedures in clinical bacteriology. 2nd ed. World health organization; 2003; PP.30:109-115.
7. Michael, J.; Leboffe and Bruton, E.; Pierce. A photographic atlas for the 3ed ed. Microbiology laboratory /Douglas, N. Morton, Inc.2005.
8. American society for microbiology. Instructions to Authors.S.I.: Antimicrob. Agents chemother; 2002; 46: i-xix. 9. Clinical and laboratory standard institute (CLSI)
.Performance standard for antimicrobial susceptibility testing. 17th informational supplement; Document M100-S17; Clinical and laboratory standards institute; 2007; Vol.27.No.1. 10. Akther, J.; Qutub, M.; and Qadri, S. Antimicrobial
susceptibility testing and patterns of resistance at tertiary care center in Saudi. Med. J.; 2001; 22(7):569- 576. 11. Gupta, K.; Scholes, D.; and Stamm, W. Increasing
prevalenceof antimicrobial resistance among pathogens causing acute uncomplicated cystitis in women. JAMJ;1999; 281:736-738.
12. Murray, P.R.; Baron, E.J.; Pefaller, M.A.; Tenover, F.C.; and Yolken, R.H.Manual of clinical microbiology. 7th ed. ASM press. USA. 1999.
13. Clark,W.G.; Brater, D.C.; and Johnson, A.R. Medic
pharmacology Gothś in to chemotherapy mechanisms of antimicrobial. International press; 1992.
14. Normann,P.; Ronse, E.; Nass ,T.; Duport, C.; and Labia, R. Characterization of a novel extended-spectrum β- lactamase
from Pseudomonas areuginosa.Antimicrob.Chemother;
1993; 37(5): 962-969.
15. Gales, AC.; Sader, HS. And Jones, RN. Urinary tract infection trends in Latin American hospitals: report from the sentry antimicrobial surveillance program (1997-2000). Diagnostic microbiology and infect Dis.; 2002; 44:289-299. 16. Vatopoulos, A.; Tsakris, A.; Tzouvelekis, L.; Legakis, N.;
Pitt,T.; and Komninou, Z. Diversity of aminoglycosides resistance in Enterobacter Cloacaein Greece .J. Clin.Microbiol. Infect.Dis. 1992; 11(2):131-138.
17. Shevelev, A.; Reshedko, G.; Edelstein, I.; Kozlova, L.; Korovina, N.;Zorkin, S.; Katosova, L.; Papajan, A.; Marusina, N.; Alumetova, L.;Vjalkova, A.; Agapova, E.;and Fokina, B.Mechanisms of resistance to aminoglycosides (amg) E. coli isolates from children with community –aquired urinary tract infections, 4th European congress of chemotherapy and infection. Paris; France; 2002.
18. Bashir, MF.; Qazi, JI.; Ahmad, N.; and Riaz, S. Diversity of urinary tract pathogens and drug resistant isolates of
Esherichia coli in different age and gender groups of
Pakistanis. Tropical journal of pharmaceutical research; 2008; 7(3):1025-1031.
19. Pape, L; Gunzer, F; Ziesing, S; Pape, A; Offiner, G; and Ehrich, JH.Bacterial pathogens, resistance patterns and treatment options in community acquired pediatric urinary tract infection. Klin padiatr; 2004;216(2): 83-86.
20. Sahm, D.F.,C.; Thornsberry, C.; Mayfield, D.C.; Jones, M.E.; and Karlowsky,J.A. Multi- drug resistant urinary tract isolates
of Esherichia coli : Prevalence and patient demographics in
united states in 2000.Antimicrob.Agents; Chemother ; 2001 ; 45:1402-1406.
21. Bujdakova, H.; Lausova, A.; Jankovicova, S.; Prodinger,
W.M.; Kallova, J.;Milosovic, P.; and Kettner, M. Study of β -lactam resistance in ceftazidime resistant clinical isolates of enterobacteriaceae. J.Antimicrob. Agents; 1998; 10:136-414. 22. Akyar, I. Antibiotic resistance rates of extended spectrum beta lactamase producing Escherichia coli and Klebsiella spp. Strains isolated from urinary tract infection in a private hospital. Microbiyol Bul. National center of biotechnology information,U.S. National library of medicine; 2008.
23. Gupta, K.; Hooton, TM and Stamm, WE. Increasing antimicrobial resistance and the management of un complicated community acquired urinary tract infections. Ann.Internal medicine; 2001; 135: 41-50.
24. Garau: " Other antimicrobials of interest in the era of extended spectrum beta- lactamases: Fosfomycin, Nitrofurantoin and Tigecyclin". Clin. Microbiol. Infect;2008; PP. 1:198-202. suppl. 14.
25. Calla, Mc. DB.; Kaiser, C.; and Green, MHL: Genetic of nitrofurazone resistance in Escherichia coli. J Bacteriol ;1978; pp.133:10-16
26. Muhammad Asif: studies on prevalence, characterization and development of resistance in clinically significant gram negative bacilli against commonly used antibiotics. Biological sciences; 2003; PP.238.
27. Joseph, W. Chow; Vivek, kAk.; IIyou;Susan, J. Kao; Joanne Petrin; Don,B. Clewell ; Stephen, A. Lerner; George, H. Miller; and Karen, J. Shaw Aminoglycoside resistance genes aph (2)-Ib and aac-Im detected together in strains of both
Escherichia coli and Enterococcus faecium. Antimicrobial
agents and chemotherapy; 2001; Vol.45.PP. 2691-2694. 28.
MarcGalimand;PatriceCourvalin;andThierryLambert.Plasmid-mediated high – level resistance toaminoglycosides in Enterobacteriaceae due to 16S rRNA methylation, antimicrobial agents and chemotherapy; 2003;Vol. 47.PP.2565-2571.
29. Piddoch, LJ. Mechanisms of flouroquinolon resistance. Drugs; 1999; 58 (suppl2)11-18.
30. Sisson, G.; Goodwin, A.; Raudonikiene, A.; Hushes, N.J.; Mukhopadhyay ,A.K.;Berg, D.E.; and Hoffiman ,P.S.Structural and mechanistic studies of Escherichia coli
nitroreductase with the antibiotic nitrofurazone. Antimicrobial agents and chemotherapy; 2002; 46, 2116-212.
31. Minhchan Plac Ngugen; Paul Louis Woerther; Mathilde Bouvet; Antoine Andremon; Roland Leclercq; and Annuie Canu .Escherichia coli as reservoir for macrolide resistance genes.Emerging infectious disease ; 2009;Vol. 15. No.10. 32. Philippon,A.; Arlet, B.; Jacoby,GA.Plasmid–determined
AmpC-type β-lactamase. Antimicrobial agent chemotherapy; 2002; 46:1-11.