Application of Fisher Score and mRMR
Techniques for Feature Selection in
Compressed Medical Images
Vamsidhar Enireddy
Associate Professor, Department of CSE, MVR College of Engineering, Vijayawada,A.P
Dr.D.V.V.S.PhaniKumar
Professor, Department of CSE,
Geethanjali Institute of Tehnology & Science, Nellore, A,P [email protected]
Dr. Gunna Kishore
Professor, Department of CSE, MVR College of Engineering, Vijayawada,A.P
Abstract: In nowadays there is a large increase in the digital medical images and different medical imaging equipments are available for diagnoses, medical professionals are increasingly relying on computer aided techniques for both indexing these images and retrieving similar images from large repositories. To develop systems which are computationally less intensive without compromising on the accuracy from the high dimensional feature space is always challenging. In this paper an investigation is made on the retrieval of compressed medical images. Images are compressed using the visually lossless compression technique. Shape and texture features are extracted and best features are selected using the fisher technique and mRMR. Using these selected features RNN with BPTT was utilized for classification of the compressed images.
Keywords: Image Compression, Image retrieval, Haar Wavelet, Gabor filter, Feature Selection, Recurrent Neural Network.
Introduction
The advancement of technology in the medical field has seen a large increase in the digital images which are used for diagnosis and therapy. To maintain and access these huge image repositories are difficult to manage. The images are accessed using the identification number or study characteristics [1]. Content-based image retrieval (CBIR) is a technique which retrieves images from a large scale databases according to user interests by using the visual contents of the images. It has been a fast growing research area. The previous techniques utilized textual annotations to retrieve the image which have many drawbacks. The early text-based image retrieval method surveys can be found in [2, 3]. Content-based image retrieval uses the features such as color [7], shape [8], texture [9] and spatial layout of an image to represent and index the image. During 1990, large interest is shown in this technique ranging from government [4], industry [5, 6] to universities [10]. Retrieving of medical images is also one of the important applications of CBIR [11]. The main goal of the medical information systems is to give the required information at the right time to improve the quality and efficiency of the care process [12].CBIR has played a greater role in providing the required information for clinical decision making system. The medical images are now growing larger in number and to store these images and transmission is also a challenging factor. The image needs to be transferred from one place to another in a case where a specialist may not be available. The similar images have to be retrieved from the database so that the professional can take a decision and guide for the further treatment.
Feature selection searches and extracts a subset of “relevant features” so that effectiveness of classification accuracy can be optimized. By applying feature selection, only a compact subset of highly relevant features is retained, to simplify classification process and make it more effective [71].
methods[14].Natural images can utilize the lossy compression methods as minor loss of information is much acceptable. If the lossy compression can produce unnoticeable differences then these are called as visually lossless [15]. Spatial, temporal and spectral are the different types of redundancies [16].spatial redundancies are focused in this research as these are foremost type of medical imagining data used [17].
LITERATURE REVIEW
Yang et al., [18] presented a boosting framework for distance metric learning that aims to preserve both visual and semantic similarities. The boosting framework first learns a binary representation using side information. Syam et al., [19] proposed a CBIR that using Medical images for retrieval and the feature extraction is used along with color, shape and texture feature extraction to extract the query image from the database medical images. The proposed CBIR technique is evaluated by querying different medical images and the retrieval efficiency is evaluated in the retrieval results. Han et al., [20] proposed a novel Back Propagation -based image retrieval (BPBIR) system for image retrieval. Kumar & Kumaraswamy [21] proposed to implement a novel feature selection mechanism using Discrete Sine Transforms (DST) with Information Gain for feature reduction. Peter et al., [61] developed a feature selection approach by projecting the image into sub-space based on Fisher’s Linear Discriminant. The proposed method was effective in separating classes in a low-dimensional subspace. Chengjun & Harry [62] developed an enhanced Gabor Fisher Classifier (GFC) for face recognition. Shiguang et al., [63] employed extended fisher face for face recognition. This was done to overcome the problem of inability to apply fisher face where single image is available for training. Ling et al., [64] used a set of fisher scores for calculating through partial derivative analysis of the parameters estimated in each HMM. These fisher scores are further combined with traditional features such as log likelihood and appearance based features to form feature vectors that exploit the strengths of both local and holistic features of human face. Xiao-Ming et al., [65] developed an extended fisher face with 3D Morphable model. Dinakardas et al., [66] developed Inverse Fisher Discriminant Analysis which combined PCA plus LDA techniques that has two- phrase framework to deal with high dimensional space and singular cases. Zhuang et al., [67] Inverse fisher criterion was augmented by adding a constraint in PCA procedure so that singularity phenomenon will not occur. Nithya & Menaka [68] proposed Rough set theory (RST) based feature selection technique for removing irrelevant features and producing high accuracy for post processing data.
Huda et al., [69] proposed two filter and wrapper hybrid approaches for feature selection techniques by combining the filter’s feature ranking score in the wrapper stage. The first approach hybridizes a Mutual Information (MI) based Maximum Relevance (MR) filter ranking heuristic with an Artificial Neural Network (ANN) based wrapper approach where Artificial Neural Network Input Gain Measurement Approximation (ANNIGMA) has been combined with MR (MR-ANNIGMA) to guide the search process in the wrapper. The second hybrid combines an improved version of MI based (Maximum Relevance and Minimum Redundancy; MaxRel-MinRed) filter ranking heuristic with the wrapper heuristic ANNIGMA (MaxRel-MinRed-ANNIGMA). Unler et al., [70] presented a hybrid filter–wrapper feature subset selection algorithm based on Particle Swarm Optimization (PSO) for support vector machine (SVM) classification. This hybrid algorithm, called maximum relevance minimum redundancy PSO (mr2PSO), uses the MI available from the filter model to weigh the bit selection probabilities in the discrete PSO.
Compressed medical image retrieval has not been studied extensively in literature. In this paper, investigation has been carried out for classification of compressed medical images.
METHODOLOGY
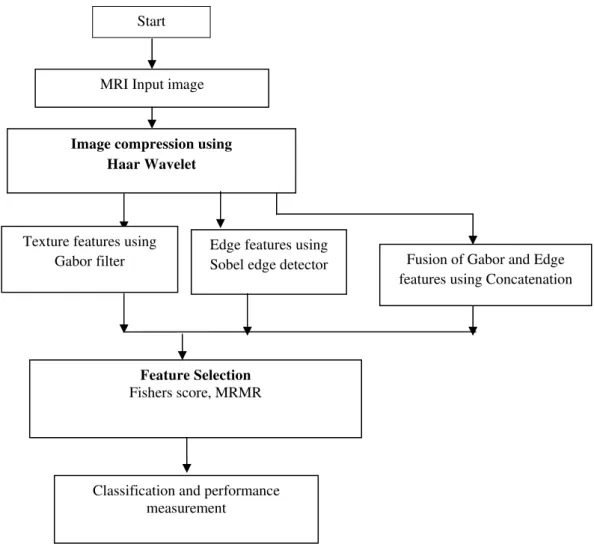
Figure 1: Flowchart of Proposed Methodology
2.1 Image Compression
Haar wavelet is the simplest wavelet introduced by Hungarian Mathematician Alfred Haar [22]. The use of the wavelet was done in 1981 by Jean Morlet a Geophysict. Morlet and the physicist Alex Grossman invented the term wavelet in 1984 [23]. Haar wavelet is orthogonal wavelet, compact and dyadic [24, 25]. The Wavelet transforms the image from the space domain to a local frequency domain [22, 26]. It requires low computing requirements. The operation of the Haar wavelet operates on the adjacent elements and calculates the sum and the differences of the data.
The mother wavelet function of Haar ψ
( )
t can be given as:1
(0,1/ 2)
( )
1
(1 / 2,1)
0
(0,1)
t
t
t
t
ψ
∈
= −
∈
∉
And the scaling function can ø (t) can be described as
1
(0,1)
( )
0
(0,1)
t
t
t
φ
=
∈
∉
To decompose the signal Hilbert transform was used and the signal was decomposed into two components average (approximation) and detail (fluctuation).
A signal having sample values, the first average sub signal
1
1 2 3 / 2
( ,
,
,...
N)
a
=
a a a
a
for a signal length of N is given as: a =
√ ,n=1,2,3…….N/2. The first detail sub signal d = d , d , … … d ). A
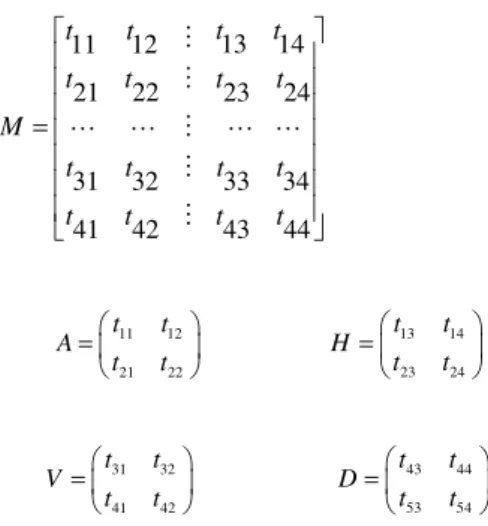
resultant matrix M of first level is formed and shown below
A represents approximation area, H -horizontal area, V - vertical area and D -diagonal area [27]. 2n
Start
MRI Input image
Image compression using Haar Wavelet
Texture features using Gabor filter
Edge features using
Sobel edge detector Fusion of Gabor and Edge features using Concatenation
Feature Selection
Fishers score, MRMR
2.2Feature Extraction
Texture: Gabor filters [28,29,30] is most widely used for texture feature extraction as it performs better and correspond to the characteristics of the illustration for the edge detection[31,32]. The images are rotated in certain directions to measure the texture and information may be lost during the process of rotation of image, shifts or scale changes [33]
Gabor filtered output of the image is obtained by the convolution of the image with Gabor function for each of the orientation spatial frequency (scale) orientation (Fig. 2). Given an image F(x, y), we filter this image with
Gab x y W
( , ,
, ,
θ σ σ
x,
y)
[59]( , ,
, ,
x,
y)
=
(
−
,
−
) *
( , ,
, ,
x,
y)
k l
FGab x y W
θ σ σ
F x k y l
Gab x y W
θ σ σ
The magnitudes of the Gabor filters responses are represented by three moments
1 1
1
( , ,
,
)
( , ,
, ,
,
)
X Y
x y x y
x y
W
FGab x y W
XY
µ
θ σ σ
θ σ σ
= =
=
(
, ,
x,
y)
std W
θ σ σ
=
2
1 1
||
( , ,
, ,
,
) |
( , ,
,
) |
X Y
x y x y
x y
FGab x y W
θ σ σ
µ
W
θ σ σ
= ==
−
Skew=
) 3
1 1 )
( , ,
, ,
,
( , ,
,
)
1
(
)
( , ,
,
= =−
X Y x y x yx y x y
FGab x y W
W
X
XY
std W
θ σ σ
µ
θ σ σ
θ σ σ
The feature vector is constructed using
µ
(
W
, ,
θ σ σ
x,
y),
std W
(
, ,
θ σ σ
x,
y)
and Skew as feature components.Sobel Edge Detector: To Identify and locate sharp discontinuities in an image, due to sudden pixel intensity change, characterizing object boundaries within a scene is called edge detection [35]. To perform the Edge detection it applied the Sobel method. The gradient in X-direction and Y- direction is calculated using two 3X3 size masks [34].
The array is given below
+1 +2 +1 0 0 0 -1 -2 -1 Gx Gy
Figure 2: Convolution kernels of Sobel detector
The horizontal and vertical gradient (Gx and Gy), are calculated and combined together to find the absolute magnitude of the gradient. The absolute magnitude is given by
13 14
11 12
22
21 23 24
31 32 33 34
41 42 43 44
t t
t t
t
t t t
M
t t t t
t t t t
= 11 12 21 22 t t A t t = 13 14 23 24 t t H t t = 31 32 41 42 t t V t t = 43 44 53 54 t t D t t =
|G| = G +G .
The shape descriptors [59] are used to extract the features from the objects and described here are computes a no of circularity, discontinuity angle irregularity, aspect ratio, length irregularity, sharpness, complexity, right-angleness, directedness. Those are translation, rotation (except angle), and scale invariant shape descriptors. It can also use the edges to extract the image contours. Shape information can be obtained from the contour. From individual contour a set of shape features can be extracted and stored. Figure 3 represents these shapes.
Figure3. Shape and measures used to compute features
1) Circularity cir = 2
4
PA
P
2) Aspect Ratio ar =
1
+
2
p
p
C
3) Discontinuity Angle Irregularity dar =
1
|
|
2 (
2)
+−
−
i in
θ
θ
π
4) Length Irregularity
1
|
−
+|
=
L
iL
ilir
K
5) Complexity com = 10
3
−
n
6) Right-Anglenessra=r/n.
7) Sharpness
2
2 |
|
max(0.1 (
−
−
)
=
sh
n
θ π
π
8) Directedness
=
M
dir
Pi
Where: n - number of sides of polygon, A - area of polygon, P - perimeter of polygon,
i
θ
- discontinuity angle between (i−1)-th and i-th boundary segment, r – number of discontinuity angles = a right-angle within a specified tolerance, and M - total length of straight-line segments parallel to mode direction of straight-line segments within a specified tolerance.
2.3 Feature Selection
In the real world classification problems require supervised learning techniques are required where the underlying class probabilities and class-conditional probabilities are unknown, and each instance is associated with a class label [36].Unknown relevant features are a priori. An irrelevant feature will not affect the target. Redundant feature does not add anything new to the target [37]. Redundant features can be removed so that running time of algorithm can also be reduced. It gives a better sight into the real world classification problem [38, 39].
The following lists those that are conceptually different and cover a range of definitions [36]. a) Idealized: Necessary and sufficient minimally sized feature subset must be find out [40].
b) Classical: Selecting a subset of D features from a set of S features, D < S, such that the value of a standard function is optimized over all subsets of size M [41].
c) Improve Prediction accuracy: The selected features should improve the prediction accuracy [39]. d) Approximating original class distribution: the selected features class distribution should be close to
the original class distribution given all feature values [39].
The main criteria of the feature selection is classification accuracy should not decrease and the selected features class distribution should be close to the class distribution of all the features. Feature selection methods searches for best features using some evaluation function.
The feature selection method available in the literature are: filter-based, wrapper based and embedded methods [42]. The features are ranked as pre-processing step prior to learning algorithm and high ranking scores are selected in Filter- based methods. In Wrapper based methods features are selected using the by giving the scores to the features and these scores are given using a learning algorithm. In Embedded methods feature selection is combined with the learning algorithm. In this paper we used Fisher Score and mRMR (minimum redundancy – maximum relevance)
Fisher Score:
The Fisher Score [43] is a method to find the subset of most relevant features for classification. In order to obtain the best features it utilizes the discriminative methods, and generative statistical models. The features are selected using the principle that distance between data points lying in same class should be small and distance between data points lying in different classes should be large. Let us consider in general that the given data set is { x , y } where the xi є Rd and yi є{1,2,3,….c}. The aim is to find a subset of m most important informative features. The data matrix is represented as X=[x1,x2, ……….xn] є Rdxn -1 is a vector of all ones and 0 is vector of all zeros. I is the Identity matrix. So given f features it have to choose a subset of m<f features. Consider the input data matrix is A є Rdxn reduces to B є Rmxn m features are selected. The Fisher Score can be computed as [44]:
F Z = tr S S +ϒΙ)-1 }
Where ϒ –positive regularization parameter, S –between- class scatter matrix, S - total scatter matrix S =∑ n μ − μ μ − μ
S=∑ z − μ z − μ
Where μ and n are mean vector and size of K-th class. The overall mean vector of reduced data is given by μ=∑ n μ . let μ and σ be the mean and standard deviation of k-th class related to the j-th feature μ and σ represent the mean and standard deviation of the set of the j-th feature. The Fisher score is given by: F x =
∑
where ( σ = ∑ n σ
The generalized Fisher Score Algorithm: 1 1 1 1 | | 1 1
: ;
:
1
1 1
1;
int ,
{ };
1
1;
sin
1
T n c p d tt j j
t j
Input C and m
Output V and
Initialize V
and t
n
Find the most violated constra
p
and set
p
repeat
Initialize
t
repeat
Solve V u
g
V
p K
I
H
under the curre
λ
λ
γ
− = ==
=
Ω =
=
=
+
1 1 1 1;
sin
1
( , )
2
int
;
1;
d T tvg j j
j
t t
t t
nt
Slove for u
g gradient descent as in
V
tr V
p K V
until converge
Fine the most violated constra
p
and set
p
t
t
until conerge
λ
λ
γ
= + + +
∇
= −
Ω
= Ω ∪
= +
Maximum Relevance and Minimum Redundancy (mRMR)
The mRMR [45] method is used for feature selection. Features are selected by ranking them based on its relevance to target and redundancy of features. The best features are selected such that it has minimum redundancy within the features and maximum relevance to target variable [46].
Mutual information (MI) is a measure of general interdependence between random variables [47].It is used to quantify both relevance and redundancy. The MI is defined as [46]
(
)
(
)
(
)
( ) ( )
P x, y
I X, Y
P x, y log
P x P y
=
∬
Where X, Y are vectors, joint probabilistic density is represented by p (x, y) marginal probabilistic densities are given by p(x) and p(y)
Given the N data points drawn from the joint probability distribution (xi, yi), i = 1,…, N, Guassian kernel estimator was used to estimate the joint and marginal densities[48,49]
(
)
2 2 2 1 (( ) ( ) 2 21
1
,
2
i ix x y y
h
P x y
e
M
π
h
− − + −
=
And the P(x), P(y) can be defined as
( )
2 21 ( ) 2 2
1
1
2
i x x hP x
e
M
π
h
− −
=
And
( )
2 21
( )
2 2
1
1
2
i
y y h
P y
e
M
π
h
− −
=
the width of the kernels are controlled by using h.
Let us denote the whole feature set as
β
.β
sDenotes the already selected feature set which contains n features. tβ
Represent to be selected feature set which contains m features. The relevance S of the feature f in
β
t havingthe target c is calculated by S = I (f, c) and redundancy R of the feature f in
β
t of all features inβ
s is calculatedby
(
)
i s
i
f β
1
R
I f , f
m
∈=
The features fj are obtained from the
β
t with maximum relevance and mininmum redudancy, S and R arecombined with the mRMR function:
(
)
1
(
)
(
)
[
,
,
]
1, 2,
i s
i s
max
f j j i
f
I f c
I f
f
j
n
m
β
β
∈
∈
−
=
…
The feature set is obtained by mRMR method
' ' ' '
1 2 h N
F
=
{f , f ,
……
.f ,
……
f )
With the N features
N
=
(m n)
+
. Smaller index h values are obtained when the features extracted are better being the index indicating the importance of the feature.Classification
The selected feature set is used for the classification of the compressed image.
The extracted features are classified using Recurrent Neural Network (RNN. A recurrent net is a neural network with feedback connections [50, 51].In literature many RNN are defined such as Hopfield, Elman, Boltzmann machine, BAM, and recurrent back propagation nets [52].
These are applied in many fields including classification trajectory problems, language processing, filtering and so on.
Recurrent neural networks architectures can be in many forms with two common features: 1. Incorporating some form of Multi-Layer Perceptron as a sub-system.
2. Exploiting Multi-Layer Perceptron’s powerful non-linear mapping capabilities, plus some form of memory. RNN architectures include multilayer feed forward networks with input, hidden and output layers. Each node has input from other nodes. Feedback to the node is possible. In simple RNNs (Figure 4) some nodes form part of a feed forward structure, others provide sequential context and receive feedback from other nodes. Context units C1 and C2 weights are processed similar to those for input units. Time delayed feedback is received from second layer to the context unit that is shown in Fig 4.
layer context nodes emphasizing output values sequences. . A learning algorithm, Error Back-Propagation through Time (BPTT) is used for RNN and derived from classic BP to be used on FFNN [55, 56]. Compared to the other learning algorithms, implementing BPTT is relatively easy. The basic of the BPTT algorithm is transformation of RNN “unfolded” to the FFNN comprising more layers, which can be applied to classic BP with minor changes. By the unfolding of RNN, every newly produced layer of FFNN signifies one recursion in time of RNN considered by T - depth of unfolding of RNN.
In the prompt units of time updation of the activation states occur. The initial step consists of recounting method of network that consists in replicating times (folds) the RNN obtaining an equivalent FFNN and at all times, each replicated connection shares its value [57]. Using the Backpropagation algorithm this FFNN is trained .It is BPTT algorithm.
The output time of each neuron of back propagation is defined as
( )
( ( ))
i i
y t
=
f x t
( )
( )
in( )
(
)
i j H i ij j I i ij j M i ij ij
x t
=
∈y t w
+
∈x
t w
+
∈y t
−
τ
w
where f denotes neuron activation function, input and hidden neuron indexes are represented by I and H. M is the indexes of neurons which contains Information about the previous stages given by the M which is the indexes of neurons
τ
ijis an integer representing displacement in recurrent connections through time [58].Since the top 50 features obtained from Fisher Score and mRMR methods and for classification the Partial Recurrent Neural Network is used in which the size of the input layer was fixed at 50 with one hidden layer consisting of 20% of the neurons used in the input layer.
RESULTS AND DISCUSSION
The recurrent neural network is evaluated using a dataset containing 4 different class of image with 750 images. The experiments are run 10 fold cross validation. The Haar Wavelet is used for image compression. Gabor filters are used to extract texture features. Sobel edge detector is used for edge features .Feature selection is achieved through Fisher Score and mRMR methods. The top 50 ranked features of Fisher Score and mRMR are utilized for classifying the medical images.
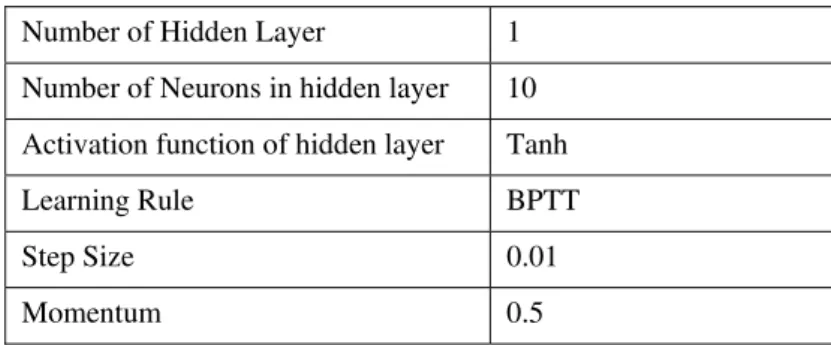
The design parameters of the proposed recurrent neural network are given in Table 2. Table 1: Parameters Used in the Proposed Model
Number of Hidden Layer 1 Number of Neurons in hidden layer 10 Activation function of hidden layer Tanh
Learning Rule BPTT
Step Size 0.01
Momentum 0.5 Sample medical images used in the experimental setup are shown in Figure 5.
Figure 5: Images used in the investigation.
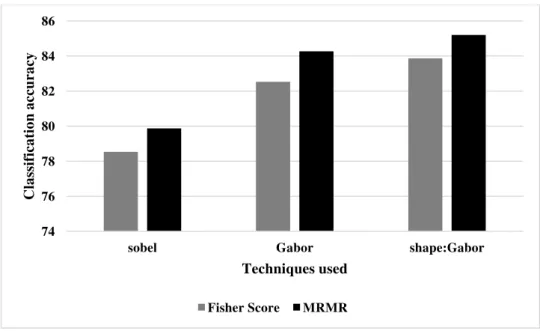
Figure 6 Classification accuracy
From the figure 6, it can be observed that the Fisher score, the sobel method improves classification accuracy by 4.96% and 6.57% when compared with Gabor and shape: Gabor methods. Similarly MRMR, the sobel method increased classification accuracy by 5.36% and 6.45% when compared with Gabor and shape: Gabor methods.
Figure 7 Average Precision
From the figure 7, it can be observed that the Fisher score, the sobel method improves average precision by 4.48% and 5.79% when compared with Gabor and shape: Gabor methods. Similarly MRMR, the sobel method increased average precision by 4.84% and 5.89% when compared with Gabor and shape: Gabor methods.
74 76 78 80 82 84 86
sobel Gabor shape:Gabor
Classification accuracy
Techniques used
Fisher Score MRMR
0.76 0.77 0.78 0.79 0.8 0.81 0.82 0.83 0.84 0.85 0.86
sobel Gabor shape:Gabor
Average precision
Techniques used
Figure 8 Average Recall
From the figure 8, it can be observed that the Fisher score, the sobel method improves average recall by 4.96% and 6.57% when compared with Gabor and shape: Gabor methods. Similarly MRMR, the sobel method increased average recall by 5.36% and 6.45% when compared with Gabor and shape: Gabor methods.
Figure 9 Average F Measure
From the figure 9, it can be observed that the Fisher score, the sobel method improves average f measure by 5.27% and 6.84% when compared with Gabor and shape: Gabor methods. Similarly MRMR, the sobel method increased average f measure by 5.54% and 6.60% when compared with Gabor and shape: Gabor methods.
CONCLUSION
The proposed method integrates image retrieval to retrieve diagnostic cases similar to the query medical image and image compression techniques to minimize the bandwidth utilization. Haar Wavelet is used for obtaining the visually lossless image compression . Shape and texture features are extracted from the medical compressed medical images using Gabor transforms and Sobel edge detector. 50 top ranked features selected through Fisher Score and mRMR Techniques with ranking are used for classification. The mRMR Feature selection method has performed better than the Fisher Score method.Using the selected features from these methods the mRMR features have shown better performance in classification of compressed medical images using the Partial Recurrent neural Network. Simulation results achieved are satisfactory.
0.74 0.76 0.78 0.8 0.82 0.84 0.86
sobel Gabor shape:Gabor
Average recall
Techniques used
Fisher Score MRMR
0.74 0.76 0.78 0.8 0.82 0.84 0.86
sobel Gabor shape:Gabor
Average F
measure
REFERENCES
[1] T.M. Lehmann, M.O. Güld, C. Thies, B. Fischer, M. Keysers, D. Kohnen, H. Schubert, B.B. Wein, Content-based image retrieval in medical applications for picture archiving and communication systems, in: Proceedings of the SPIE Conference on Medical Imaging, vol. 5033, San Diego, CA, USA, 2003
[2] S. K. Chang, and A. Hsu, "Image information systems: where do we go from here?" IEEE Trans. On Knowledge and Data Engineering, Vol.5, No.5, pp. 431-442, Oct.1992.
[3] H. Tamura, and N.Yokoya, "Image database systems: A survey, " Pattern Recognition, Vol.17, No.1,pp. 29-43, 1984.
[4] R .Jain,A.Pentland, and D.Petkovic, “NSF-ARPA workshop on visual information management systems”,Cambridge,MA,June1995 [5] Zobeir Raisi, Farahnaz Mohanna, Mehdi Rezaei “Applying Content-Based Image Retrieval Techniques to Provide New Services for
Tourism Industry” Int. J. Advanced Networking and Applications Volume: 6 Issue: 2 Pages: 2222-2232 (2014) ISSN : 0975-0290. [6] James Dowe, Content-based retrieval in multimedia imagining” in Proc. SPIE Storage and Retrieval for Image and Video Databases. [7] M.J. Swain, D.H. Ballard, “color indexing” Int. J Computer Vision, Vol. 7, no.( 1), pp. 11-32, 1991.
[8] H. Tamura, S. Mori, T. Yamawaki, ‘Textural Features Corresponding to Visual Perception’, IEEE Transactions on Systems Man and Cybernetics, Vol 8, pp. 460-473, 1978
[9] Y. Liu, D. Zhang, G. Lu, W.-Y. Ma, ‘A survey of content-based image retrieval with high-level semantics’, Pattern Recognition , Vol. 40, (1), pp. 262-282, 2007.
[10] W.Y.Ma andB.S.Manjunath, “Netra: A toolbox for navigating large image databases” in Proc. IEEE Int Conf. on Image Proc. 1997. [11] Samuel, G., Armato III, et al.: Lung image database consortium – Developing a resource for the medical imaging research community,
in Radiology . 232, 739-748 (2004)
[12] Winter, A and Haux, R. A three-level graph-based model for the management of hospital informationsystems. Methods Information Med. 1995; 34: 378–396
[13] Dezhgosha, K., Sylla, A. K., &Ngouyassa, E. (1994, May). Lossless and lossy image compression algorithms for on-board processing in spacecrafts. InAerospace and Electronics Conference, 1994. NAECON 1994., Proceedings of the IEEE 1994 National (pp. 416-423). IEEE.
[14] Srikanth, R., &Ramakrishnan, A. G. (2005). Contextual encoding in uniform and adaptive mesh-based lossless compression of MR images. Medical Imaging, IEEE Transactions on, 24(9), 1199-1206.
[15] ME, S. S., Vijayakuymar, V. R., &Anuja, R. (2012). A Survey on Various Compression Methods for Medical Images. International Journal of Intelligent Systems and Applications (IJISA), 4(3), 13.
[16] Xiong, Z., Wu, X., Cheng, S., &Hua, J. (2003). Lossy-to-lossless compression of medical volumetric data using three-dimensional integer wavelet transforms.Medical Imaging, IEEE Transactions on, 22(3), 459-470.
[17] Zukoski, M. J., Boult, T., &Iyriboz, T. (2006). A novel approach to medical image compression. International journal of bioinformatics research and applications, 2(1), 89-103.
[18] Yang, L., Jin, R., Mummert, L., Sukthankar, R., Goode, A., Zheng, B., &Satyanarayanan, M. (2010). A boosting framework for visuality-preserving distance metric learning and its application to medical image retrieval. Pattern Analysis and Machine Intelligence, IEEE Transactions on, 32(1), 30-44.
[19] Syam, B., Victor, J. S. R., &Rao, Y. S. (2013, March). Efficient similarity measure via Genetic algorithm for content based medical image retrieval with extensive features. In Automation, Computing, Communication, Control and Compressed Sensing (iMac4s), 2013 International Multi-Conference on (pp. 704-711). IEEE.
[20] Han, J. H., Huang, D. S., Lok, T. M., &Lyu, M. R. (2005, July). A novel image retrieval system based on BP neural network. In Neural Networks, 2005. IJCNN'05. Proceedings. 2005 IEEE International Joint Conference on (Vol. 4, pp. 2561-2564). IEEE. [21] Kumar, M. S., &Kumaraswamy, Y. S. (2012, March). An improved support vector machine kernel for medical image retrieval system.
In Pattern Recognition, Informatics and Medical Engineering (PRIME), 2012 International Conference on (pp. 257-260). IEEE. [22] Haar A.: ZurTheorie der orthogonalenFunktionensysteme. MathematischeAnnalen, 69, 331–371.1973.
[23] Chun-Lin, Liu “A Tutorial of the Wavelet Transform” February 23, 2010 [24] Castleman KR. Digital image processing. Englewood Cliffs: Prentice-Hall; 1996. [25] Moharir PS. Pattern recognition transforms. New York: Wiley; 1992.
[26] Kamrul Hasan Talukder , Koichi Harada , Haar Wavelet Based Approach for Image Compression and Quality Assessment of Compressed Image, in IAENG International Journal of Applied Mathematics, pp 49-56, 2007.
[27] E.vamsidhar and Kiran Kumar Reddi, An Data Mining Approach for Compressed Medical Image Retrieval,"International journal of computer applications(IJCA),Volume 52-No.August 2012.
[28] D.M. Squire, W. Müller, H. Müller, T. Pun, Content-based query of image databases: in-spirations from text retrieval, Pattern Recognition Letters, vol. 21, 2000, pp. 1193–1198 (Selected papers from the 11th Scandinavian Conference on Image Analysis, SCIA’99).
[29] W. Ma, B. Manjunath, Texture features and learning similarity, in: Proceedings of the 1996 IEEE Conference on Computer Vision and Pattern Recognition (CVPR’96), San Francisco, California, 1996, pp. 425–430.
[30] S. Santini, R. Jain, Gabor space and the development of preattentive similarity, in: Proceedings of the 13th International Conference on Pattern Recognition (ICPR’96), IEEE, Vienna, Austria, 1996, pp. 40.
[31] Daugman, J.G. An information theoretic view of analog representation in striate cortex. Computat. Neurosci.1990; 2: 9–18
[32] Daugman, J.G. High confidence visual recognition of persons by a test of statistical independence. IEEE Trans. Pattern Anal. Machine Intel. 1993; 15: 1148–1161.
[33] Milanese, R and Cherbuliez, M. A rotation, translation and scale-invariant approach to content- based image retrieval. J. Visual Commun. Image Represent. 1999; 10: 186–196
[34] Rezai-Rad, G. and M. Aghababaie (2006). Comparison of SUSAN and Sobel Edge Detection in MRI Images for Feature Extraction. in Information and Communication Technologies. ICTTA '06. 2nd. pp 1103 - 1106.
[35] Pal, N. R., & Pal, S. K. (1993). A review on image segmentation techniques. Pattern recognition, 26(9), 1277-1294 [36] M.Dash,H.Liu “Feature Selection for Classification” in Intelligent Data Analysis 1 (1997) 131-156.
[37] John, G.H., Kohavi, R. and Pfleger, K., Irrelevant features and the subset selection problem. In: Proceedings of the Eleventh International Conference on Machine Learning, 121-129, 1994.
[38] Kohavi, R. and Sommetlield, D., Feature subset selection using the wrapper method: Overfitting and dynamic search space topology. In: Proceedings of First International Conference on Knowledge Discovery and Data Mining, Morgan Kaufmann, 192-197, 1995. [39] Koller, D. and Sahami, M., Toward optimal feature selection. In: Proceedings of International Conference on Machine Learning, 1996. [40] Kira, K. and Rendell, L.A., The feature selection problem: Traditional methods and a new algorithm. In: Proceedings of Ninth
National Conference on Artificial Intelligence, 129-134, 1992.
[42] I. Guyon and A. Elisseeff. An introduction to variable and feature selection. Journal of Machine Learning Research, 3:1157–1182, 2003.
[43] P. E. H. R. O. Duda and D. G. Stork. Pattern Classification. Wiley-Interscience Publication, 2001. [44] Quanquan Gu, Zhenhui Li and Jiawei Han “Generalized Fisher Score for Feature Selection”
[45] Peng H, Long F, Ding C (2005) Feature selection based on mutual information: criteria of max-dependency, max-relevance, and min-redundancy. IEEE Trans Pattern Anal Mach Intell 27(8): 1226–1238. doi:10.1109/TPAMI.2005.159
[46] Yudong Cai et.,al “Prediction of lysine ubiquitination with mRMR feature selectionand analysis” Amino Acids DOI 10.1007/s00726-011-0835-0.
[47] Tourassi, G. D., Frederick, E. D., Markey, M. K., & Floyd Jr, C. E. (2001). Application of the mutual information criterion for feature selection in computer-aided diagnosis. Medical Physics, 28(12), 2394-2402
[48] Beirlant J, Dudewicz E, Gyorfi L, Meulen Evd (1997) Nonparametric entropy estimation: an overview. Int J Math Stat Sci 6(1):17–39 [49] Qiu P, Gentles AJ, Plevritis SK (2009) Fast calculation of pairwise mutual information for gene regulatory network reconstruction.
Comput Methods Programs Biomed 94(2):177–180. doi:10.1016/j.cmpb.2008.11.003.
[50] Pal, S. K., &Mitra, S. (1992). Multilayer perceptron, fuzzy sets, and classification. IEEE Transactions on Neural Networks, 3(5), 683-697.
[51] Fausett, L.: Fundamentals of Neural Networks; Architectures, Algorithms and Applications, Prentice-Hall, Inc. New Jersey, 07632, 1994.
[52] Hecht-Nielsen, R. (1989, June). Theory of the backpropagation neural network. In Neural Networks, 1989. IJCNN., International Joint Conference on (pp. 593-605). IEEE.
[53] Elman, J. L.: Finding Structure in Time, Cognitive Science, 14, 179–211, 1990.
[54] Jordan M (1986) Attractor dynamics and parallelism in a connectionist sequence machine. In: Proc of Ninth Annual conference of Cognitive Science Society. Lawrence Earlbaum, New York, pp 531–546
[55] Martens, J., &Sutskever, I. (2011). Learning recurrent neural networks with Hessian-free optimization. In Proceedings of the 28th International Conference on Machine Learning (ICML-11) (pp. 1033-1040).
[56] Bodén, M. (2002). A guide to recurrent neural networks and backpropagation. The Dallas project, SICS technical report. [57] I. J. Koscak., (2010). StochasticWeight Selection in Backpropagation Through Time
[58] Grau, I., Nápoles, G., Bonet, I., &García, M. M. (2013). Backpropagation through Time Algorithm for Training Recurrent Neural Networks using Variable Length Instances. Computación y Sistemas, 17(1), 15-24.
[59] Choras, R. S. (2007). Image feature extraction techniques and their applications for CBIR and biometrics systems. International journal of biology and biomedical engineering, 1(1), 6-16.
[60] E. Vamsidhar, Kiran Kumar Reddi “ Compressed Medical Image Retrieval Using Neural Networks” International Journal of Applied Engineering Research ISSN 0973-4562 Volume 10, Number 3 (2015) pp. 8953-8965
[61] Peter, N. B., Jooao, P. H., & David, J. K. (1997). EigenfacevsFisherfaceRecognition usingclass specific linear projection.IEEE Transactions on pattern Analysis and machineIntelligence, 19(7), 711-720.
[62] Chengjun, L., & Harry, W. (2002). Gabor feature based classification using the Enhanced Fisher Linear Discriminant Model for face Recognition. IEEE Transaction on image processing, 11(4), 467-476.
[63] Shinguang, S. Bo, C., Wen, G., & Debin, Z. (2002). Extended fisherface for face recognition from a single example image per person. FRJDL lastitute of computing technology .Chinese Academy of science.Department of Computer Science.Harbin Institute of Technology.
[64] Ling C, Hong M, Ara V. N, (2005). Face recognition based on multi-class mappingofFisher scores. Pattern Recognition, 30, 799-811 [65] Xiao-Ming B, Bao-Cal Y, Qin S, and Yan-Feng S, (2005). Face Recognition Using Extended Fisherface with 3D Morphable
Model.Proceedings of the fourth International Conference on Machine learning and Cybernetics, Guangahon, 4481-4486.
[66] Dinakardas, C.N, Perumal S. and Nisha G, (2013). Multimodal identification system in monozygotic twins.International Journal of Image Processing (IJIP), 7(1), 72-80.
[67] Zhuang, X.-S, Dai, D.-Q, and Yuen, P.C, (2005). Face Recognition by Inverse Fisher Discriminant Feature. Springer-Verlag Berlin Heidelberg, 92-98.
[68] Nithya, P., & Menaka, T. (2013). Feature Selection for Post Processing In High Dimensional Data. representations, 2(9).
[69] Huda, S., Yearwood, J., & Stranieri, A. (2011, January). Hybrid wrapper-filter approaches for input feature selection using maximum relevance-minimum redundancy and artificial neural network input gain measurement approximation (ANNIGMA). In Proceedings of the Thirty-Fourth Australasian Computer Science Conference-Volume 113 (pp. 43-52). Australian Computer Society, Inc..
[70] Unler, A., Murat, A., & Chinnam, R. B. (2011). mr 2 PSO: a maximum relevance minimum redundancy feature selection method based on swarm intelligence for support vector machine classification. Information Sciences, 181(20), 4625-4641.