Metabolomic Quantitative Trait Loci (mQTL)
Mapping Implicates the Ubiquitin
Proteasome System in Cardiovascular
Disease Pathogenesis
William E. Kraus1,2, Deborah M. Muoio2,3, Robert Stevens2, Damian Craig2, James R. Bain2, Elizabeth Grass2, Carol Haynes2, Lydia Kwee2, Xuejun Qin2, Dorothy H. Slentz2, Deidre Krupp2, Michael Muehlbauer2, Elizabeth R. Hauser2,4, Simon G. Gregory2,
Christopher B. Newgard2, Svati H. Shah1,2*
1Division of Cardiology, Department of Medicine, Duke University, Durham, North Carolina, United States of America,2Duke Molecular Physiology Institute, Duke University, Durham, North Carolina, United States of America,3Division of Endocrinology, Department of Medicine, Duke University, Durham, North Carolina, United States of America,4Department of Biostatistics and Bioinformatics, Duke University, Durham, North Carolina, United States of America
Abstract
Levels of certain circulating short-chain dicarboxylacylcarnitine (SCDA), long-chain dicar-boxylacylcarnitine (LCDA) and medium chain acylcarnitine (MCA) metabolites are heritable and predict cardiovascular disease (CVD) events. Little is known about the biological path-ways that influence levels of most of these metabolites. Here, we analyzed genetics, epige-netics, and transcriptomics with metabolomics in samples from a large CVD cohort to identify novel genetic markers for CVD and to better understand the role of metabolites in CVD pathogenesis. Using genomewide association in the CATHGEN cohort (N= 1490), we observed associations of several metabolites with genetic loci. Our strongest findings were for SCDA metabolite levels with variants in genes that regulate components of endoplasmic reticulum (ER) stress (USP3,HERC1,STIM1,SEL1L,FBXO25,SUGT1) These findings were validated in a second cohort of CATHGEN subjects (N= 2022, combined p = 8.4x10 -6
–2.3x10 -10
). Importantly, variants in these genes independently predicted CVD events. Association of genomewide methylation profiles with SCDA metabolites identified two ER stress genes as differentially methylated (BRSK2andHOOK2). Expression quantitative trait loci (eQTL) pathway analyses driven by gene variants and SCDA metabolites corrobo-rated perturbations in ER stress and highlighted the ubiquitin proteasome system (UPS) arm. Moreover, culture of human kidney cells in the presence of levels of fatty acids found in individuals with cardiometabolic disease, induced accumulation of SCDA metabolites in parallel with increases in the ER stress marker BiP. Thus, our integrative strategy implicates the UPS arm of the ER stress pathway in CVD pathogenesis, and identifies novel genetic loci associated with CVD event risk.
a11111
OPEN ACCESS
Citation:Kraus WE, Muoio DM, Stevens R, Craig D, Bain JR, Grass E, et al. (2015) Metabolomic Quantitative Trait Loci (mQTL) Mapping Implicates the Ubiquitin Proteasome System in Cardiovascular Disease Pathogenesis. PLoS Genet 11(11): e1005553. doi:10.1371/journal.pgen.1005553
Editor:Aldons J. Lusis, University of California, Los Angeles School of Medicine, UNITED STATES
Received:March 17, 2015
Accepted:September 4, 2015
Published:November 5, 2015
Copyright:© 2015 Kraus et al. This is an open access article distributed under the terms of the
Creative Commons Attribution License, which permits unrestricted use, distribution, and reproduction in any medium, provided the original author and source are credited.
Data Availability Statement:Molecular data from this study are available through the NCBI dbGaP database (accession phs000703.v1.p1).
Funding:This work was supported by NIH grants HL095987 (SHS) and HL101621-01 (WEK). The funders had no role in study design, data collection and analysis, decision to publish, or preparation of the manuscript.
Author Summary
Cardiovascular disease is a strongly heritable trait. Despite application of the latest geno-mic technologies, the genetic architecture of disease risk remains poorly defined, and mechanisms underlying this susceptibility are incompletely understood. In this study, we performed genome-wide mapping of heart disease-related metabolites measured in the blood as the genetic traits of interest (instead of the disease itself), in a large cohort of 3512 patients at risk of heart disease from the CATHGEN study. Our goal was to discover new cardiovascular disease genes and thereby mechanisms of disease pathogenesis by under-standing the genes that regulate levels of these metabolites. These analyses identified novel genetic variants associated with metabolite levels and with cardiovascular disease itself. Importantly, by utilizing an unbiased systems-based approach integrating genetics, gene expression, epigenetics and metabolomics, we uncovered a novel pathway of heart disease pathogenesis, that of endoplasmic reticulum (ER) stress, represented by elevated levels of circulating short-chain dicarboxylacylcarnitine (SCDA) metabolites.
Introduction
Despite the strong heritability of cardiovascular disease (CVD), its underlying genetic architec-ture remains incompletely characterized. Genomewide association studies (GWAS) have con-verged on association of CVD with a locus on chromosome 9p21 [1], but the variants confer modest risk and are of unclear functional significance. One limitation of GWAS studies for complex diseases is the search for association with disease as a binary endpoint, rather than with molecular markers that define risk. An alternative approach is to search for variations in the genome that associate with variation in complex traits. In fact, many diseases can be defined by an underlying quantitative scale, and these“intermediate”traits may have a stronger functional relationship to the causative gene, thereby providing a stronger signal for the disease process. Metabolite levels measured by the emerging tools of metabolomics may be particularly useful for such studies. Indeed, integration of GWAS with metabolomic profiles in population-based cohorts [2] has demonstrated that as much as 12% of variance in metabolite levels is determined by single nucleotide polymorphisms (SNPs). However, most studies of this type performed to date have not used disease-burdened cohorts, so clear linkages between genetic signals, intermediate phenotypes and disease remain to be discovered.
Metabolomic profiling has identified novel biomarkers for CVD risk [3–5]. For example, a cluster of heritable [6] short-chain dicarboxylacylcarnitine (SCDA) metabolites measured in plasma (comprised of the mono-carnitine esters of short-chain,alpha-,omega-diacids), a clus-ter of long-chain dicarboxylacylcarnitines (LCDA), and a clusclus-ter of medium-chain acylcarni-tines (MCA) predict CVD events in cardiovascular cohorts [4,5], in patients undergoing coronary artery bypass grafting [3], and add incremental risk prediction to robust clinical mod-els inclusive of>20 variables [5]. Little is known about the biological pathways represented by these metabolites and how they may predispose to CVD. Thus, we hypothesized that integra-tion of metabolomics with genetics, epigenetics, and transcriptomics could define novel mecha-nisms of CVD pathogenesis by identifying metabolic quantitative trait loci (mQTL) that are CVD risk factors. We performed a GWAS of metabolite levels in a large cardiovascular cohort referred for cardiac catheterization (CATHGEN,N= 1490) and validated our findings in a sec-ond cohort (CATHGEN,N= 2022). A proportion of study subjects (44%) did not have clini-cally significant atherosclerotic coronary artery disease at time of catheterization; regardless, all individuals were analyzed given that metabolites predict risk of CVD events even in individuals named on a patent owned by Duke University for
without coronary artery disease, and because these individuals are still at risk for these events. We found that genetic loci that strongly associate with SCDA levels also predict incident CVD events, and are linked to ER stress. Genes differentially methylated in subjects at the extremes of SCDA levels also report on ER stress. Gene expression quantitative trait loci (eQTL) pathway analysis identified ER stress as an expression module associated with disease risk, particularly highlighting the ubiquitin proteasome system (UPS) arm of ER stress. Thus, this multi-plat-form“omics”approach identified a molecular pathway (ER stress and dysregulation of the UPS) associated with a prevalent complex disease.
Results
Table 1displays baseline characteristics of the study population. PCA of metabolomic data identified 14 factors with metabolites in each factor clustering within biochemical pathways (S1 Table), and clustering similar to our previous studies [3–5,7]. For this study, we performed GWAS using the top three PCA-derived factors: factor 1 (composed of MCA metabolites), fac-tor 2 (composed of LCDA metabolites), and facfac-tor 3 (composed of SCDA metabolites), all of which we have previously identified as predicting CVD events (S2 Table) [3–5].S1 Figdetails the overall study flow.
Metabolic quantitative trait loci (mQTL) of metabolite levels reside in
genes reporting on ER stress
Factor 1, factor 2 and factor 3 scores were used as the quantitative traits in GWAS analysis to identify mQTL. Q-Q plots suggested the presence of SNPs associated with levels of each of the three metabolite factors (S2,S3andS4Figs). Several SNPs were significantly associated with metabolite factor levels at genomewide significance (p10−6) in additive models in the
Table 1. Baseline characteristics of study population.
Discovery (N = 1490) Validation (N = 2022)
Age, mean (SD) 57.6 (11.6) 62.2 (11.9)
Race
% White 68% 72%
% Black 21% 21%
Sex (% female) 48.7% 38.2%
BMI, mean (SD) 30.8 (7.9) 30.1 (7.0)
Ejection fraction, mean (SD) 58.7 (11.4) 56.5 (13.5)
Creatinine, mean (SD) 1.1 (0.9) 1.3 (1.5)
Diabetes (%) 28.0% 31.2%
Hyperlipidemia (%) 56.7% 59.4%
Hypertension (%) 67.4% 67.4%
Smoking (%) 51.2% 47.2%
Family history (%) 38.3% 36.2%
Number of diseased coronary arteries
0 50.9% 39.0%
1 16.7% 23.6%
2 15.1% 16.0%
3 17.3% 21.4%
Heart failure (%) 20.1% 26.6%
Renal disease (%) 1.2% 2.5%
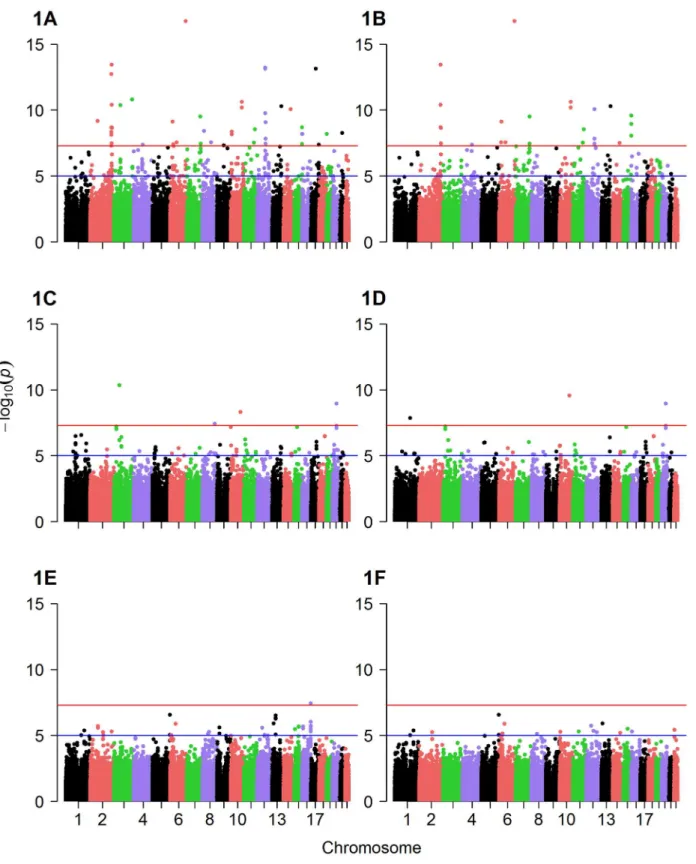
discovery cohort (Fig 1A–1F) and confirmed (p0.05) in the validation cohort (Table 2). Spe-cifically, eight SNPs were associated with factor 1 (MCA) levels in any race, but with only two of these SNPs showing more than nominal significance in the validation cohort (Table 2): rs10987728 (in cyclin dependent kinase 9 [CDK9]) and rs6738286 (intergenic between transi-tion protein 1 [TNP1] and disrupted in renal carcinoma 3 [DIRC3]). Twelve SNPs were associ-ated with factor 2 (LCDA) levels in any race (Table 2), with only two of them showing more than nominal significance in the validation cohort (rs12129555 just downstream from poly-meric immunoglobulin receptor [PIGR] and rs17025690 in Usher syndrome 2A [USH2a]). Factor 3 (SCDA) showed the strongest mQTL with twelve SNPs being associated with SCDA levels in any race (Table 2), and four of these SNPs showing more than nominal significance in the validation cohort: rs2228513 in HERC1 HECT and RLD domain containing E3 ubiquitin protein ligase family member 1 (HERC1), rs10450989 in ubiquitin specific protease 3 (USP3), rs11771619 in round spermatid basic protein 1-like (RSBN1L), and rs1869075 (intergenic between F-box protein 25 [FBXO25] and glutamate rich 1 [ERICH1]). Effect sizes (β, i.e. per 1 unit change in factor levels) ranged from to -0.38 to 2.17 (factor 1), -0.19 to 1.16 (factor 2), and -0.43 to 1.72 (factor 3).
In meta-analyses combining the race-stratified results, eleven SNPs were associated with factor 1 (MCA) levels, with three of these SNPs showing more than nominal association (Table 3); one of these (rs10987728 inCDK9) was also identified from race-stratified results and two (rs16990949 in PDX1 C-terminal inhibiting factor 1 [PCIF1]) and rs543129 [inter-genic between cutaneous T-cell lymphoma-associated antigen 1 (CTAGE1) and retinoblastoma binding protein 8 (RBBP8)]) were new mQTL identified in these race meta-analyses. Eight SNPs were associated with factor 2 (LCDA) levels (Table 3); one gene had been identified in race-stratified analyses (ZNF521) but showed stronger association in the validation cohort in these analyses, and rs352216 near frizzled class receptor 3 (FZD3) was a new mQTL. Factor 3 (SCDA) again had the largest number and strongest mQTL with fourteen SNPs associated with SCDA levels, with eight SNPs showing more than nominal significance in the validation cohort (Table 3). SNPs inUSP3,HERC1andOLFM4|SUGT1(intergenic between olfactomedin 4 and SGT1, suppressor of G2 allele of SKP1 [S. cerevisiae]) had already been identified in race-stratified analyses; additional mQTL identified in these race meta-analyses included rs12589750 and rs3853422 (in or near stonin 2 [STON2] and sel-1 suppressor of lin-12-like (C. elegans) [SEL1L]), rs930491 and rs11827377 (both intergenic between ribonucleotide reduc-tase M1 [RRM1] and stromal interaction molecule 1 [STIM1]), rs11242866 (between solute carrier family 22 (organic cation transporter), member 3 [SLC22A23] and PX domain contain-ing 1 [PXDC1]), and rs4544127 (near FRAS1-related extracellular matrix protein 2 [FREM2] and stomatin-like protein 3 [STOML3]).
Thus, to summarize, the most robust results overall were for mQTL associated with SCDA metabolite levels (factor 3) including an mQTL composed ofUSP3(rs10450989) andHERC1
(rs2228513); and a locus composed ofSTON2(rs12589750) andSEL1L(rs3853422), with loci meeting genomewide significance in the discovery cohort (p10−6), strong significance in the
validation cohort (p = 2.4x10⁻³–7.7x10⁻⁷, except rs3853422 which only showed borderline sig-nificance [p = 0.01]), and stronger association in the meta-analyses (p = 1.6x10⁻⁶–7.2x10⁻¹²). The next strongest overall results for SCDA mQTL (based on race-stratified or race-combined meta-analysis p-values) in descending order of significance were forRRM1|STIM1,OLFM4| SUGT1,SLC22A23|PXDC1,RSBN1L,FBXO25|ERICH1, andFREM2|STOML3. The next stron-gest results overall were for mQTL associated with LCDA (factor 2) levels with SNPs inPIGR,
Fig 1. Manhattan plots of GWAS results.Displayed are Manhattan plots of the association results for GWAS (discovery cohort, whites only) with (A) factor 1 additive model, (B) factor 1 dominant model, (C) factor 2 additive model, (D) factor 2 dominant model, (E) factor 3 additive model and (F) factor 3 dominant model.
Table 2. Significant mQTL from GWAS of metabolite factors 1, 2 and 3.Presented are SNPs meeting genomewide significance for association with fac-tor 1 (MCA metabolites), facfac-tor 2 (LCDA metabolites) and facfac-tor 3 (SCDA metabolites) in race-stratified analyses in the discovery cohort (p10−6) also
show-ing nominal association (p0.05) in the validation cohort, ranked by meta-analysis p-value.
Gene Factor SNP Chr:Pos MAF Model Racea Discovery pb Validation pb Meta pc
HERC1 3 rs2228513 15:63950887 0.05 Add W 2.2x10⁻⁶ 3.2x10⁻⁶ 7.9x10⁻¹⁰
HERC1 3 rs2228513 15:63950887 0.05 Dom W 3.2x10⁻⁶ 1.2x10⁻³ 5.0x10⁻⁸
USP3 3 rs10450989 15:63846508 0.05 Add W 2.2x10⁻⁶ 3.1x10⁻⁶ 2.3x10⁻¹⁰
USP3 3 rs10450989 15:63846508 0.05 Dom W 3.1x10⁻⁶ 4.7x10⁻⁴ 1.6x10⁻⁸
PIGR 2 rs12129555 1:207101264 0.03 Add B 2.4x10⁻⁷ 2.5x10⁻³ 2.1x10⁻⁸
PIGR 2 rs12129555 1:207101264 0.03 Dom B 2.4x10⁻⁷ 1.2x10⁻³ 7.6x10⁻⁹
LOC100289596|ZNF521 2 rs4800615 18:22622445 0.03 Add B 1.6x10⁻⁹ 0.03 3.0x10⁻⁸ LOC100289596|ZNF521 2 rs4800615 18:22622445 0.03 Dom B 1.6x10⁻⁹ 0.04 6.8x10⁻⁸
ZNF521 2 rs12965721 18:22648924 0.05 Add B 2x10⁻⁸ 0.02 8.8x10⁻⁸
CDK9 1 rs10987728 9:130553040 0.01 Add W 5.6x10⁻⁶ 1.2x10⁻³ 7.4x10⁻⁸
CDK9 1 rs10987728 9:130553040 0.01 Dom W 5.6x10⁻⁶ 9.3x10⁻⁴ 5.7x10⁻⁸
USH2A 2 rs17025690 1:216119893 0.04 Add B 7.9x10⁻⁷ 5.4x10⁻³ 1.4x10⁻⁷
RSBN1L 3 rs11771619 7:77403278 0.02 Add B 2.3x10⁻⁶ 7.6x10⁻³ 4.4x10⁻⁷
RPL36AP40 2 rs9633819 11:25529987 0.03 Add B 7x10⁻⁷ 0.04 2.3x10⁻⁶
RPL36AP40 2 rs9633819 11:25529987 0.03 Dom B 7x10⁻⁷ 0.02 8.6x10⁻⁷ NFIA|TM2D1 2 rs17122575 1:62104766 0.06 Add B 2.9x10⁻⁷ 0.01 2.6x10⁻⁷
TNP1|DIRC3 1 rs6738286 2:217994269 0.02 Add W 4.5x10⁻⁶ 3.5x10⁻³ 2.6x10⁻⁷
TNP1|DIRC3 1 rs6738286 2:217994269 0.02 Dom W 4.5x10⁻⁶ 3.5x10⁻³ 2.6x10⁻⁷
FBXO25|ERICH1 3 rs1869075 8:540949 0.10 Add B 3.2x10⁻⁶ 7.1x10⁻³ 5x10⁻⁷ PTPRT 2 rs6016673 20:40693779 0.02 Dom W 8.3x10⁻⁸ 0.04 7.5x10⁻⁷
OLFM4|SUGT1 3 rs17573278 13:53995627 0.05 Add W 4.8x10⁻⁷ 0.03 1.2x10⁻⁶
OLFM4|SUGT1 3 rs9591507 13:53929144 0.05 Add W 5.4x10⁻⁷ 0.03 1.1x10⁻⁶
FER1L6|TMEM65 2 rs7816704 8:125263468 0.08 Add B 6.1x10⁻⁷ 0.03 1.2x10⁻⁶ COL23A1 3 rs17081346 5:177895383 0.01 Add W 2.8x10⁻⁷ 0.04 1.3x10⁻⁶
COL23A1 3 rs17081346 5:177895383 0.01 Dom W 2.8x10⁻⁷ 0.04 1.3x10⁻⁶
COL23A1 3 rs17052428 5:177898958 0.01 Add W 2.8x10⁻⁷ 0.04 1.3x10⁻⁶
COL23A1 3 rs17052428 5:177898958 0.01 Dom W 2.8x10⁻⁷ 0.04 1.3x10⁻⁶ OLFM4|SUGT1 3 rs9285184 13:53977134 0.05 Add W 3.1x10⁻⁷ 0.04 1.6x10⁻⁶
CACNA2D2 1 rs41291734 3:50513613 0.03 Add W 5.8x10⁻⁶ 0.03 4.7x10⁻⁶
CACNA2D2 1 rs41291734 3:50513613 0.03 Dom W 2.5x10⁻⁶ 0.02 2.2x10⁻⁶
PDGFD 2 rs12421553 11:103838440 0.21 Add B 7.5x10⁻⁷ 0.02 1x10⁻⁶ EBF2|PPP2R2A 1 rs2170483 8:26133566 0.04 Add W 2.4x10⁻⁶ 0.03 3.2x10⁻⁶
EBF2|PPP2R2A 1 rs2170483 8:26133566 0.04 Dom W 2.4x10⁻⁶ 0.03 3.7x10⁻⁶
ELF3|GPR37L1 3 rs12139192 1:202003269 0.06 Add B 2.7x10⁻⁶ 0.04 6.1x10⁻⁶
ELF3|GPR37L1 3 rs12139192 1:202003269 0.06 Dom B 2.7x10⁻⁶ 0.02 1.8x10⁻⁶ SFTA1P 2 rs17148556 10:10676274 0.03 Add B 2.3x10⁻⁷ 0.04 1.1x10⁻⁶
SFTA1P 2 rs17148556 10:10676274 0.03 Dom B 2.3x10⁻⁷ 0.04 1.3x10⁻⁶
ZNF267 2 rs4889565 16:31897308 0.04 Dom W 9.1x10⁻⁶ 0.02 4.3x10⁻⁶
MACROD2 2 rs2423983 20:15709520 0.08 Dom W 6.8x10⁻⁶ 0.03 5.1x10⁻⁶ PLA2G4A|FAM5C 3 rs16829453 1:188836078 0.02 Add W 4.2x10⁻⁶ 0.04 6.4x10⁻⁶
PLA2G4A|FAM5C 3 rs16829453 1:188836078 0.02 Dom W 4.3x10⁻⁶ 0.03 5.5x10⁻⁶
MYO16 1 rs6492128 13:109271217 0.01 Add W 6.4x10⁻⁶ 0.03 5.7x10⁻⁶
MYO16 1 rs6492128 13:109271217 0.01 Dom W 6.4x10⁻⁶ 0.03 5.7x10⁻⁶ SLC6A11 1 rs3821754 3:10978825 0.01 Add W 4x10⁻⁶ 0.04 6.1x10⁻⁶
SLC6A11 1 rs3821754 3:10978825 0.01 Dom W 4x10⁻⁶ 0.04 6.1x10⁻⁶
We have previously shown that all three metabolite factors predict risk of incident CVD events, however the results from those studies were most robust for the SCDA metabolites [5]. Given these prior results, and the strength and consistency of findings for the SCDA metabolite factor in these GWAS analyses, we chose to focus the remainder of our analyses on this factor.
Fig 2andS5 Figdisplay Locus Zoom plots for these eight mQTL most strongly associated with SCDA metabolite factor levels. Interestingly, the majority of these (i.e.HERC1,USP3,STIM1,
SUGT1,FBXO25andSEL1L) encode proteins reporting on endoplasmic reticulum (ER) stress.
SCDA mQTL SNPs also associate with incident cardiovascular events
SCDA mQTL were tested for association with incident CVD events using Cox proportional hazards time-to-event analyses in the combined discovery and validation datasets, using meta-analysis of race- and dataset-stratified results, unadjusted for multiple comparisons. Of these eight mQTL (15 SNPs) loci, four SNPs predicted mortality in additive models:HERC1
rs2228513 (p = 0.05 in race combined, p = 0.04 in whites only),RRM1rs11826962 (p = 0.03), andFBOX025rs1869075 (p = 2.5x10⁻⁴for blacks only, not significant in race combined analy-ses), withUSP3rs10450989 showing a trend for association (p = 0.06 in race combined, p = 0.05 in whites only). FREM2|STOML3 rs4544127 showed a trend for association
(p = 0.06). We observed for theHERC1SNP a 33% event rate for non-carriers and a 36% event rate for carriers of at least one copy of the minor G allele (the same allele associated with higher SCDA levels,S3 Table). Adjustment for SCDA levels in these models resulted in attenuation of the association between mQTL and CVD event (S3 Table), suggesting that the relationship between these mQTL and CVD events is in part mediated through SCDA metabolite levels.
mQTL SNPs are associated with SCDA independent of risk factors
To ensure that the relationships between SNPs and SCDA levels were not confounded by renal disease, we further adjusted for glomerular filtration rate. This adjustment caused no or mini-mal attenuation of the association for our strongest SNPs (S3 Table). In multivariable models, we found minimal attenuation of the association between most SNPs and SCDA levels (S3 Table), suggesting that these SNPs have effects on SCDA levels unrelated to other comorbidi-ties. There was attenuation of association of SNPs nearRRM1|STIM1andSTON2|SEL1Lafter adjustment (although still significant at p<0.05, unadjusted for multiple comparisons), sug-gesting that these SNPs have effects on SCDA levels mediated through these clinical factors, in particular renal disease.
Table 2. (Continued)
Gene Factor SNP Chr:Pos MAF Model Racea Discovery pb Validation pb Meta pc
OLFM4|SUGT1 3 rs894840 13:53973955 0.09 Add W 8.7x10⁻⁶ 0.03 8.4x10⁻⁶
LOC100289576|GPRC5C 1 rs8071255 17:72429618 0.01 Add W 7.2x10⁻⁶ 0.04 1.1x10⁻⁵ LOC100289576|GPRC5C 1 rs8071255 17:72429618 0.01 Dom W 7.2x10⁻⁶ 0.04 1.1x10⁻⁵
SPATA8|LOC91948 1 rs1500631 15:98079217 0.01 Add W 7.8x10⁻⁶ 0.05 1.4x10⁻⁵
SPATA8|LOC91948 1 rs1500631 15:98079217 0.01 Dom W 7.8x10⁻⁶ 0.05 1.4x10⁻⁵
MAF: Minor allele frequency; Add: additive; Dom: dominant.
aB: black, W: white
bsex, age and race-specific PC adjusted (4 PCs for whites, 2 PCs for blacks).
cmeta-analysis combining discovery and validation cohorts, for race-stratified analyses, adjusted for sex, age and race-specific PCs.
Table 3. Significant mQTL for GWAS of metabolite factors, race meta-analyses.Presented are SNPs meeting genomewide significance for association with factor 1 (MCA metabolites), factor 2 (LCDA metabolites) and factor 3 (SCDA metabolites) in race-combined meta-analyses in the discovery cohort (p10−6) also showing nominal association (p0.05) in the validation cohort, ranked by meta-analysis p-value.
Gene Factor SNP Chr:Position MAF Wa MAF Ba MAF Oa Model Disc pb Valid pb Meta pc
STON2 3 rs12589750 14:81891157 0.001 0.10 0.02 Add 2.0x10⁻⁶ 7.7x10⁻⁷ 7.2x10⁻¹²
STON2 3 rs12589750 14:81891157 0.001 0.10 0.02 Dom 1.5x10⁻⁶ 3.5x10⁻⁵ 3.3x10⁻¹⁰
SULF2|PREX1 3 rs1886848 20:46695252 0 0.05 0.01 Add 9.9x10⁻¹² 0.02 1.2x10⁻¹⁰ ZNF521 2 rs12965721 18:22648924 0.16 0.05 0.14 Add 8.5x10⁻⁶ 1.7x10⁻⁵ 7.7x10⁻¹⁰
RRM1|STIM1 3 rs930491 11:4199848 0.0004 0.07 0.02 Add 3.1x10⁻⁸ 2.0x10⁻³ 2.2x10⁻⁹
RRM1|STIM1 3 rs930491 11:4199848 0.0004 0.07 0.02 Dom 6.8x10⁻⁶ 8.2x10⁻⁴ 4.1x10⁻⁸
RRM1|STIM1 3 rs11827377 11:4200685 0.0004 0.07 0.02 Add 3.1x10⁻⁸ 2.4x10⁻³ 2.7x10⁻⁹ RRM1|STIM1 3 rs11827377 11:4200685 0.0004 0.07 0.02 Dom 3.1x10⁻⁸ 1.0x10⁻³ 5.2x10⁻⁸
USP3 3 rs10450989 15:63846508 0.05 0.004 0.02 Add 5.0x10⁻⁶ 4.9x10⁻⁵ 1.5x10⁻⁹
USP3 3 rs10450989 15:63846508 0.05 0.004 0.02 Dom 6.9x10⁻⁶ 1.1x10⁻³ 7.0x10⁻⁸
HERC1 3 rs2228513 15:63950887 0.05 0.004 0.02 Add 5.0x10⁻⁶ 1.3x10⁻⁴ 4.5x10⁻⁹ HERC1 3 rs2228513 15:63950887 0.05 0.004 0.02 Dom 6.8x10⁻⁶ 2.4x10⁻³ 1.9x10⁻⁷
ZNF521 2 rs4800615 18:22622445 0.12 0.03 0.12 Add 1.5x10⁻⁷ 3.1x10⁻⁴ 8.8x10⁻¹⁰
ZNF521 2 rs4800615 18:22622445 0.12 0.03 0.12 Dom 1.3x10⁻⁶ 8.0x10⁻⁴ 1.4x10⁻⁸
LIN7A 1 rs11114645 12:81280092 0.02 0.08 0.04 Add 3.6x10⁻⁹ 0.01 8.9x10⁻⁹ RRM1|STIM1 3 rs11826962 11:4200923 0.0002 0.05 0.01 Add 2.4x10⁻⁸ 0.02 4.7x10⁻⁸
RRM1|STIM1 3 rs11826962 11:4200923 0.0002 0.05 0.01 Dom 5.5x10⁻⁶ 0.02 1.8x10⁻⁶
LIN7A 1 rs12304000 12:81282585 0.02 0.14 0.04 Add 1.1x10⁻⁸ 0.02 5.3x10⁻⁸
CDK9 1 rs10987728 9:130553040 0.01 0.00 0.01 Add 5.6x10⁻⁶ 1.2x10⁻³ 7.4x10⁻⁸
CDK9 1 rs10987728 9:130553040 0.01 0.00 0.01 Dom 5.6x10⁻⁶ 9.3x10⁻⁴ 5.7x10⁻⁸
OLFM4|SUGT1 3 rs9591507 13:53929144 0.05 0.12 0.04 Add 4.3x10⁻⁷ 6.4x10⁻³ 1.0x10⁻⁷
SLC22A23|PXDC1 3 rs11242866 6:3593956 0.001 0.06 0.02 Dom 3.0x10⁻⁶ 3.6x10⁻³ 1.3x10⁻⁷
CADM2|VGLL3 3 rs6796873 3:86168194 0.002 0.23 0.05 Add 1.8x10⁻⁶ 0.01 3.7x10⁻⁷ AFAP1L2 1 rs493347 10:116133734 0.009 0.28 0.08 Dom 6.7x10⁻⁶ 0.02 5.0x10⁻⁷
STON2|SEL1L 3 rs3853422 14:81900169 0.001 0.04 0.0009 Add 7.6x10⁻⁶ 0.01 6.3x10⁻⁷
STON2|SEL1L 3 rs3853422 14:81900169 0.001 0.04 0.0009 Dom 7.6x10⁻⁶ 0.02 1.6x10⁻⁶
RAMP1 3 rs3769047 2:238769892 0.003 0.02 0.04 Add 6.8x10⁻⁶ 0.04 6.4x10⁻⁶ RAMP1 3 rs3769047 2:238769892 0.003 0.02 0.04 Dom 2x10⁻⁷ 0.04 6.6x10⁻⁷
FZD3 2 rs352216 8:28426891 0.001 0.08 0.02 Add 9.4x10⁻⁶ 0.01 1.2x10⁻⁶
FZD3 2 rs352216 8:28426891 0.001 0.08 0.02 Dom 6.1x10⁻⁶ 4.2x10⁻³ 2.8x10⁻⁷
PCIF1 1 rs16990949 20:44575493 0.04 0.07 0.03 Add 5.6x10⁻⁶ 0.01 1.3x10⁻⁶ PCIF1 1 rs16990949 20:44575493 0.04 0.07 0.03 Dom 3.6x10⁻⁶ 7.3x10⁻³ 5.1x10⁻⁷
FREM2|STOML3 3 rs4544127 13:39538666 0.006 0.12 0.03 Dom 6.5x10⁻⁶ 8.7x10⁻³ 7.3x10⁻⁷
CTAGE1|RBBP8 1 rs543129 18:20057092 0.02 0.20 0.11 Add 7.1x10⁻⁶ 4.9x10⁻³ 4.8x10⁻⁷
CTAGE1|RBBP8 1 rs543129 18:20057092 0.02 0.20 0.11 Dom 5.8x10⁻⁶ 0.02 2x10⁻⁶ FLJ40606|PCIF1 1 rs8114598 20:44562900 0.04 0.07 0.03 Add 5.7x10⁻⁶ 0.02 2.9x10⁻⁶
FLJ40606|PCIF1 1 rs8114598 20:44562900 0.04 0.07 0.03 Dom 3.6x10⁻⁶ 0.01 1.2x10⁻⁶
PLTP|FLJ40606 1 rs16990934 20:44553194 0.04 0.07 0.03 Add 1.7x10⁻⁶ 0.02 1.2x10⁻⁶
PLTP|FLJ40606 1 rs16990934 20:44553194 0.04 0.07 0.03 Dom 1.0x10⁻⁶ 0.01 4.7x10⁻⁷ GATA3|SFTA1P 1 rs7908673 10:8786636 0.13 0.41 0.14 Add 2.1x10⁻⁶ 0.03 2.3x10⁻⁶
LOC151121|LOC389033 2 rs2165440 2:130007996 0.03 0.13 0.09 Add 4.6x10⁻⁷ 0.03 1.2x10⁻⁶
C14orf105 3 rs10139566 14:57960474 0.01 0.14 0.05 Dom 6.3x10⁻⁶ 0.02 2.2x10⁻⁶
GATA3|SFTA1P 1 rs7908673 10:8786636 0.13 0.41 0.14 Add 2.1x10⁻⁶ 0.03 2.3x10⁻⁶ NFIA|TM2D1 2 rs17122575 1:62104766 0.003 0.06 0.02 Add 2.9x10⁻⁷ 0.05 5.1x10⁻⁶
ZFAT|LOC286094 2 rs7820325 8:135969632 0.30 0.22 0.30 Add 6.9x10⁻⁶ 0.03 6.0x10⁻⁶
Methylation in ER stress genes is different in individuals with extremes of
SCDA metabolites
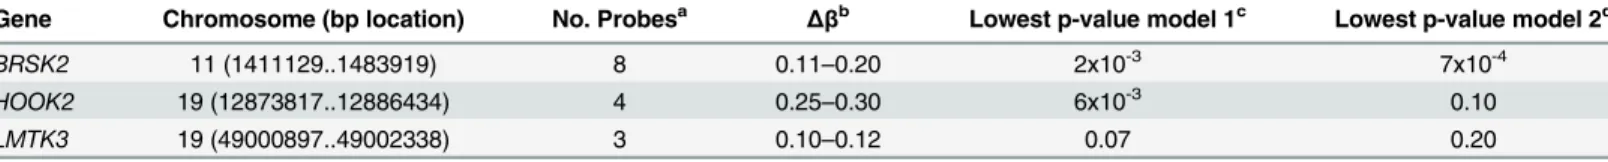
Visual comparison of the distribution of methylated probes revealed similar distributions in individuals with high and low SCDA levels (N = 46, combined methylation discovery and vali-dation datasets,S6 Fig). After filtering based onΔβvalues, the presence of multiple correlated probes in a gene, and adjustment for estimated cell type proportions, sex, age and race, probes in 28 genes showed differential methylation in SCDA extremes (i.e. |Δβ|0.10 in2 probes within a gene). Differential methylation in three of these genes was confirmed in the validation set based on |Δβ|0.10 (BRSK2,Hook2andLMTK3,Table 4). Two of these genes, including the most significant one, report on ER stress:Hook2(four probes,Δβ0.25–0.30) andBRSK2
(four probes,Δβ0.11–0.20).Hook2may be involved in pathways contributing to the ubiquitin proteasome system (UPS) arm of ER stress via its role in establishment and maintenance of pericentrosomal localization of aggresomes (complexes of misfolded proteins, chaperones and proteasomes) [8].BRSK2encodes brain selective kinase 2, a serine/threonine kinase of the AMPK family that acts as a checkpoint kinase in response to DNA damage induced by UV irradiation. BRSK2 protein levels are down-regulated in response to ER stress and ER stress promotes localization of BRSK2 to the ER [9]. Knockdown of endogenousBRSK2expression enhances ER stress-mediated apoptosis in human pancreatic carcinoma and HeLa cells [9].
Expression quantitative trait loci (eQTL) analyses also implicate the
ubiquitin proteasome arm of ER stress
Blood RNA microarray data were generated forN= 1204 CATHGEN individuals. We began by examiningciseffects for the identified SNPs; however, many of the top SNPs did not have availablecis-transcripts after extensive QC. Rs9591507,rs17573278, rs894840, and rs9285184 (all inOLFM4|SUGT1), rs11771619 (RSBN1L), rs1869075 (FBXO25), and rs1886848 (SULF2) showed evidence ofcis-regulation (S4 Table).HERC1andUSP3are not well-represented on the microarray (one probe per gene); there was only a minimal trend toward association between theHERC1andUSP3SNPs withHERC1expression (p = 0.16 and 0.19, respectively) and no association with theUSP3transcript.
We then performed eQTL analyses to find evidence oftrans-acting pathways (S4 Table). When analyzed as single transcripts, among the top ten transcripts associated withHERC1
rs2228513 andUSP3rs10450989 wereUSP39(p = 0.0002 and p = 0.0004, respectively) and
CYLD(p = 0.00015 and p = 0.0007), suggesting that these SNPs show functional relationships with expression oftrans-acting pathways related to the UPS arm of ER stress. USP39 has a role in mRNA splicing and is essential for recruitment of the U4/U6.U5 tri-snRNP to the pre-spliceosome. The tumor suppressor CYLD is a deubiquitinating enzyme, acts as a negative Table 3. (Continued)
Gene Factor SNP Chr:Position MAF Wa MAF Ba MAF Oa Model Disc pb Valid pb Meta pc
SLC35B1 1 rs8186 17:47778793 0.04 0.15 0.05 Add 5.1x10⁻⁶ 0.04 8.2x10⁻⁶
LOC100289139|LRRC4C 2 rs12270585 11:39882450 0.0004 0.10 0.02 Dom 7.0x10⁻⁶ 0.05 0.13 C18orf20|CDH7 2 rs1787927 18:62587346 0.002 0.10 0.05 Add 1.1x10⁻⁶ 0.02 0.16
MAF: minor allele frequency; Add: additive model; Dom: dominant model.
aW: white, B: black, O: other race brace-strati
fied results sex, age and race-appropriate PC adjusted, and then combined using meta-analysis.
cmeta-analysis combining discovery and validation cohorts, race-strati
fied results combined.
regulator of NF-kappa-B signaling, and plays a pro-inflammatory role in vascular smooth mus-cle cells [10]. Cis- and trans-eQTL analyses were not adjusted for multiple comparisons, as we were looking for focused functional effects for each SNP.
Using GSEA [11], we then identified KEGG pathways of transcripts associated with each SNP; nominal p-values are reported. The most significant pathway associated withHERC1
rs2228513 was“ubiquitin mediated proteolysis”(p = 0.01; p = 0.12 forUSP3rs10450989). The Fig 2. Genomic region plots for significant mQTL associated with SCDA levels.Displayed are LocusZoom plots with -log10(p-value) (left Y-axis) and LD (right Y-axis), additive model, discovery cohort:(A)USP3|HERC1, whites only;(B)STON2|SEL1L, race meta-analysis;(C)RRM1|STIM1, race meta-analysis;(D)OLFM4|SUGT1, whites only.
most significant pathway for rs10450989 was“RNA degradation”(p = 0.03). Pathways associ-ating with the other SNPs reported on various cellular processes: rs930491 and rs11827377 (RRM1|STIM1) with RNA polymerase pathway (both p = 0.001); rs11826962 (RRM1|STIM1) with JAK-STAT signaling pathway (p<0.0002); rs17573278 (OLFM4|SUGT1) with Alzhei-mer’s disease pathway (p = 0.008); rs894840 (OLFM4|SUGT1) with glycosaminoglycan biosyn-thesis (p<0.0002); rs12589750 and rs3853422 (STON2|SEL1L) with ribosome pathway (p<0.0001 and p = 0.001, respectively) and FC Gamma R mediated phagocytosis pathway (p = 0.001 for both). The Alzheimer’s disease pathway includes components of ER stress and there is evidence that neuronal death in Alzheimer’s disease may arise from ER dysfunction. The ER is also thought to play an important structural role in phagocytosis.
Finally, we performed GSEA for the correlation between SCDA levels with genomewide RNA expression; nominal p-values are reported. The most significant KEGG pathways were oxidative phosphorylation (p<0.0002), Parkinson’s disease (p<0.0002), cardiac muscle con-traction (p<0.0002), porphyrin and chlorophyll metabolism (p = 0.002), and the proteasome pathway (p = 0.008). The proteasome is an integral component of the UPS arm of ER stress, degrading cellular proteins that are modified by ubiquitin. Also, an integral part of the Parkin-son’s disease pathway includes components of the UPS.
Biochemical characterization of SCDA metabolites
In this and prior studies [4–6], SCDA were measured using a flow-injection-MS/MS method that is ideal for rapid profiling of samples, but full resolution of isomeric species comprising each SCDA metabolite peak is not achieved. C6-DC represents a SCDA that loads heavily on the PCA-derived SCDA factor in our studies, which can be comprised of either the branched-chain methylglutaryl acylcarnitine or the straight branched-chain adipoyl acylcarnitine isomers. To resolve these metabolites, we adapted a liquid chromatography (LC)-MS/MS method [12]. Peak identification was facilitated by in-house chemical synthesis of internal standards for the two targeted analytes [13]. Using this method, we re-analyzed 29 human plasma samples from our original studies [5] that contained the highest C6-DC levels. We found that in the majority of individuals (19 of 29), the clearly predominant C6-DC isomer was the branched-chain 3-methylglutaryl carnitine metabolite, and in in 23 of the 29 individuals levels of the branched chain isomer were higher than the straight chain isomer (S7 Fig). The correlation between the C6-DC measured by flow injection-MS/MS with each of these LC-MS/MS measured isomers further confirms that it is primarily the branched-chain isomer accounting for the signal (r2 = -0.06, p = 0.8 for straight chain isomer; r2 = 0.67, p = 1.8x10⁻⁴for branched-chain isomer). Table 4. Whole genome methylation profiling.Genes showing highest degree of differential methylation between individuals with high and low SCDA lev-els with |Δβ|>0.10 in the discovery and validation datasets.
Gene Chromosome (bp location) No. Probesa Δβb Lowest p-value model 1c Lowest p-value model 2d
BRSK2 11 (1411129..1483919) 8 0.11–0.20 2x10⁻³ 7x10⁻⁴
HOOK2 19 (12873817..12886434) 4 0.25–0.30 6x10⁻³ 0.10 LMTK3 19 (49000897..49002338) 3 0.10–0.12 0.07 0.20
anumber of differentially methylated probes within gene
bmethylated (M) and unmethylated (U) signal intensities and overall methylation levels (β) were calculated as the ratio of methylated to total signal (i.e.β=
M / (M + U)) whereβranges from 0 (unmethylated) to 1 (methylated).Δβwas calculated for the difference in overall methylation levels between high and low SCDA level individuals.
cnominal p-value, unadjusted for multiple comparisons; adjusted for estimated cell proportions.
dnominal p-value, unadjusted for multiple comparisons; adjusted for estimated cell proportions, age, race and sex.
Interestingly, one potential source of the branched-chain 3-methylglutaryl carnitine metabolite is the branched-chain amino acid leucine. Our previous studies have shown an association of branched-chain amino acid metabolites with coronary artery disease [4,7].
ER stress markers increase in conjunction with SCDA metabolites in
cultured cells
The above findings linking ER stress to SCDA metabolites led us to question whether nutrient-induced accumulation of dicarboxylacylcarnitines would be accompanied by ER stress in cul-tured cells. Exposure of human HEK293 kidney cells to 500 uM fatty acids for 24 hours (a con-dition designed to mimic elevated fatty acid levels observed in human obesity) increased cellular production and efflux of several long, medium and short-chain dicarboxylacylcarni-tines (Fig 3A and 3B). Interestingly, fatty acid-induced production of dicarboxylacylcarnitines was accompanied by elevated expression of the molecular chaperone protein BiP (Fig 3C), a well-recognized marker of ER stress. At low doses of the ER stress agent tunicamycin (lower than required to cause cytotoxicity), fatty acid exposure also augmented BiP expression (Fig 3C). Together, these results point to an intriguing connection between cellular carbon load, dicarboxylic acylcarnitines and proteotoxicity.
Discussion
We have analyzed metabolomics, genetics, epigenetics and transcriptomics together to estab-lish genomewide associations between a cluster of SCDA metabolites that predict CVD events and specific genetic loci. Our findings implicate the UPS arm of ER stress as a factor influenc-ing SCDA levels and CVD event pathogenesis. Several previous studies have successfully mapped metabolites to genetic loci [2], but primarily have not triangulated such genetic varia-tion with disease endpoints and funcvaria-tional studies. Key findings of the current study include: (1) SNPs and CpG probes in genes reporting on components of ER stress were associated with levels of SCDA metabolites previously shown to predict CVD events [3–5]; (2) several of these SNPs themselves also predicted CVD events; (3) some of the SNPs/genes were linked with SCDA metabolites and ER stress through eQTL analyses; (4) the isomeric composition of the peak containing the major SCDA metabolite C6-DC was clarified; and (5) in cultured cells, nutrient-induced accumulation of SCDA metabolites occurred in parallel with increases in the ER stress marker BiP. Subjects in the CATHGEN cohort have a high prevalence of obesity, hyperlipidemia and diabetes (Table 1). Thus, ourin vitroexperiment may be viewed as a mimetic of the metabolic environment to which CATHGEN subjects are commonly exposed.
SNP 58 kB upstream fromUSP3(rs10519210) was the strongest SNP associated with heart fail-ure in a GWAS from the CHARGE consortium [15]. Rs10519210 not associated with SCDA levels in our study (p = 0.16) and is not in LD with rs10450989 (r2 = 0.002). Our next strongest finding was for a locus in/nearSTON2andSEL1L. Rs12589750 is an intronic SNP within
STON2and rs3853422 is intergenic betweenSTON2andSEL1L. SEL1L plays a role in the ER-Fig 3. Dicarboxylic (DC) acylcarnitines measured in HEK 293 cell lysates (A) and conditioned medium (B) after 24 h exposure to BSA alone or in complex with 500 uM fatty acids (FA, oleate:palmitate, 1:1). C) Representative Western blot analysis of the ER stress protein, BiP, in HEK 293 cells treated 24 h with 500 uM FA±increasing doses of tunicamycin (NT; no treatment, Vehicle (DMSO), 8 ng/mL and 32 ng/mL
tunicamycin). High dose tunicamycin (500 ng/mL) served as a positive control. Asterisks indicate significant difference between BSA and FA experiments (p<0.05).
associated protein degradation (ERAD) machinery, and is part of a complex necessary for the retrotranslocation of misfolded proteins from the ER lumen to the cytosol where they are then degraded by the proteasome in a ubiquitin-dependent manner. Dysfunctional protein degrada-tion causes ER stress.
Other mQTL included SNPs nearRRM1andSTIM1;STIM1encodes a calcium sensor in the ER that translocates to the plasma membrane upon calcium store depletion to activate cal-cium release-activated calcal-cium channels. STIM1 induction, redistribution and clustering are important during ER stress when calcium stores are depleted [16].FBXO25is one of 68 human F-box proteins that serve as specificity factors for a complex composed of s-phase-kinase asso-ciated protein 1 (Skp1) and cullin1 (SCF), that act as protein-ubiquitin ligases, targeting pro-teins for destruction across the UPS.FBXO25is cardiac specific and acts as a ubiquitin E3 ligase for cardiac transcription factors [17]. Rs17573278 and rs9591507 are intergenic SNPs >400 kB downstream fromOLFM4andSUGT1.SUGT1is required cell cycle transitions and
encodes a novel subunit of the SCF ubiquitin ligase complex [18].OLFM4encodes an anti-apo-ptotic protein that promotes tumor growth. The functions of the other SCDA mQTL loci are unclear.
Given the strength of association of SCDA metabolites (factor 3) with CVD and their partic-ular strength of association in the current GWAS analyses, we chose to focus our subsequent analyses on SCDA. However, we did also identify mQTL for LCDA and MCA, both of which have also been shown to predict CVD events. LCDA are metabolic intermediates of long chain fatty acid oxidation in the mitochondria or peroxisomes. The most significant mQTL for LCDA metabolite levels includedPIGR,USH2a,ZNF521andFZD3.PIGRis a member of the immunoglobulin superfamily andZNF521is involved in regulation of early B-cell factor, sug-gesting a potential relationship between LCDA levels and immune and/or inflammatory path-ways as a link to CVD. MCA are byproducts of mitochondrial fatty acid oxidation. The most significant mQTL for MCA show no obvious potential biologic relationship to mitochondrial function and/or CVD. More epidemiologic and functional work is necessary to clarify these links.
Importantly, and unique to this study, we have observed an association of mQTL and dis-ease phenotypes. The SNPs most significantly associated with SCDA levels (HERC1andUSP3) were also associated with CVD events, with a consistent direction of effect (G allele associating with higher SCDA levels and events).STIM1|SEL1LSNPS were not associated with CVD events despite their strong association with SCDA levels; this may be due to limited power related to the low MAF in racial subsets. Adjustment for SCDA levels in these models resulted in attenuation of the association between SNP and CVD event suggesting that the relationship between underlying mQTL and CVD events is in part or in full mediated through SCDA metabolites and not through a different biological pathway. In combination, these results sug-gest potential functional and pathway relationships between SCDA metabolites and CVD events.
Many SCDAs result from the catabolism of amino acids,ω-oxidation of fatty acids or per-haps represent products of microbial metabolism [19], but the reasons for their accumulation in plasma in at-risk subjects, and how they may be related to CVD pathogenesis remain uncer-tain. Based on the convergence of GWAS, transcriptomic, metabolomic and functional data presented herein, we hypothesize that genetic and epigenetic variation predisposes to increased susceptibility to ER stress through proteasome dysfunction (reflected by the observation of upregulation of expression of ER stress genes), with ER stress in turn contributing to increased production of SCDA metabolites. This pathway of increased ER stress then leads to increased risk of CVD events, with SCDA metabolites and the genetic variants themselves predicting increased risk by reporting on this pathway (Fig 4). Epigenetic variation could be the influence of environmental or lifestyle factors inducing methylation changes; in this working model, diet and lifestyle-induced dyslipidemia and hyperglycemia could result in methylation changes as a regulatory mechanism to handle nutrient overload, thus predisposing to dysregulated ER stress which then leads to subsequent CVD events.
The UPS arm of the ER is responsible for the removal of misfolded proteins but is some-times insufficient, for example, in the setting of increased production of misfolded proteins. Fig 4. Representation of metabolomics, GWAS, eQTL, and methylation leading to convergence on ER stress as a pathway for CVD event pathogenesis.
The associated proteasome functional insufficiency can lead to cellular dysfunction and cell death, with cardiomyocytes being particularly vulnerable due to limited regenerative capability [20]. The UPS has been hypothesized to be involved in atherosclerosis based on the recognized roles of inflammation, oxidative stress, and endothelial dysfunction in this condition, and the intertwined relationships between the UPS and those pathways [21]. Preclinical evidence of the role of the UPS in atherosclerosis includes studies showing that oxidized LDL inhibits protea-somal activity in macrophages leading to apoptosis [22], and data suggesting that the UPS may contribute to foam cell formation by suppression of apoptosis of lipid-bearing macrophages by aggregated LDL inin vitromodels [23]. Studies of proteasome inhibition have shown conflict-ing data; Hermannet al. found aggravation of atherosclerosis [24] and myocardial dysfunction [25] in pigs treated with proteasome inhibition, whereas a recent study showed reversal of ure-mia-induced atherosclerosis with proteasome inhibition in rabbits [26].
Human studies suggesting the role of the UPS in atherosclerosis are limited. Very small studies have shown greater amounts of ubiquitin conjugates in carotid endarterectomy tissues with unstable as compared with stable plaque morphologies [27] and increased UPS activity in carotid tissue from patients with symptomatic compared with asymptomatic carotid disease [28]. While preclinical studies have suggested the role of UPS in atherosclerosis as secondary to oxidative stress or other pathophysiologies, our identification of genetic variants in UPS/ER stress genes using unbiased analyses in our human cohorts provides strong support for the direct etiologic role of the UPS in promoting long-term cardiovascular risk. Importantly, we note that while ER stress is a common pathway in several disorders, we believe that the conver-gence of results on the UPS highlights its unique relationship to SCDA metabolism.
Our findings could have significant translational implications beyond CVD. Our primary objective of discovery of novel genetic risk variants using an mQTL approach was successful; the unexpected finding of genetic variation predisposing to ER stress could have much broader importance to human disease. Indeed, the response to ER stress is a trait that is known to be heritable in humans [29], but the genetic architecture has not been characterized. Equally as important, our data suggest the presence of easily quantifiable circulating biomarkers of ER stress, traditionally measureable only in tissue through ER stress-responsive gene expression studies. Thus, these results could have more wide-reaching implications for ER stress research in humans. Our prior work solidified the role of SCDA metabolites as predictors of CVD events [4,5]; the current study has implications for clinical translation using SCDA metabolites for improved risk stratification even beyond CVD given the central role of normal and dys-functional ER stress in health and disease.
The strengths of this study are the use ofa prioridefined discovery and validation cohorts; integration of genetics, epigenetics, metabolomics, transcriptomics in large cohorts; and careful biochemical refinement of the most strongly associated SCDA metabolite. Importantly, this represents one of the first studies to successfully identify genetic variants through mapping of intermediate metabolomic traits that themselves associate with disease endpoints. Our prior work had consistently identified SCDA metabolites as incremental predictors of CVD events, but little was known about the biological pathways underlying that association; the genome-wide, multiple platform molecular approach taken in our study facilitated identification of the UPS more rapidly than other scientific methods. This work also adds an important finding to the metabolomics literature, namely that SCDA metabolites may be reporting on increased or dysregulated ER stress and specifically to proteasome functional insufficiency or dysregulation.
artery disease is not confounding the relationship between genetic factors and outcome. Fur-ther, the high burden of CVD risk factors mirrors that of the general population, enabling gen-eralizability of the study findings. Some of the results were isolated to a racial subset because the identified SNPs were either monomorphic or extremely rare in other races, underscoring the potential importance of including non-Caucasian races in such studies. Race-stratified sequencing of these genomic regions may identify different variants in these genes present in other races that may also serve as SCDA and CVD genetic variants. Wea priorichose a p-value 10−6as genomewide significant based on the commonly used threshold at the time we
embarked on this study, and as a balance between the overly conservative Bonferroni correc-tion and presence of linkage disequilibrium across the genome. More contemporary GWAS platforms cover a greater number of SNPs and include imputed SNPs in analysis, thus p<10−8
is now often considered genomewide significant; most of the key SNPs in this study would meet that threshold in combined meta-analyses, but not in the discovery cohort alone. The sig-nificance level also did not account for testing of two genetic models and for race-stratified analyses, however, most of the identified mQTLs would remain significant even after account-ing for such multiple testaccount-ing (p<3.0x10⁻⁷). More importantly, the use of a validation cohort and convergence of diverse omic’data on the UPS obviate concerns about type I error with the threshold used for this study. Finally, while our study overall analyzed metabolomics with genetics, epigenetics and transcriptomics, not all individuals were profiled with all platforms, such that we co-analyzed genetic, epigenetic and transcriptomic data with metabolomics data one pair at a time. The ultimate goal for an eventual true systems biology approach would inte-grate all molecular platforms to unravel molecular pathways. However, to our knowledge this is the largest study deploying four diverse platforms in conjunction with cardiovascular event outcomes to date, and our consistent findings across platforms support further mechanistic interrogation of the identified pathway.
Our results highlight the power of combined molecular analyses and mapping of intermedi-ate disease-relintermedi-ated biomarkers for identifying the genetic architecture underlying common complex diseases, and could lead to improved CVD event risk prediction models as well as fur-ther mechanistic investigations of the role of the ubiquitin proteasome system in CVD.
Materials and Methods
Study design
The overall objective of this study was to integrate metabolomic, genetic (genomewide associa-tion study [GWAS]), transcriptomics and epigenetic data in a large human cohort to identify the genetic architecture regulating metabolite levels (metabolites shown to be incrementally predictive of CVD events [4,5]) and thereby identify novel CVD risk genes. The analytic pro-cess was as follows (S1 Fig): (1) a GWAS was conducted of metabolite factor levels in a discov-ery cohort (N = 1490) individuals from the CATHGEN biorepository; (2) SNPs meeting genomewide significance from the discovery cohort were validated in a second cohort
Study population
Individuals were selected from the CATHGEN biorepository of patients referred for evaluation of ischemic heart disease recruited sequentially through the cardiac catheterization laboratories at Duke University (Durham, NC) [30]. After informed consent, blood was obtained from the femoral artery, immediately processed to separate plasma, and frozen at -80°C. Individuals were fasting for a minimum of six hours prior to collection. Patients with severe pulmonary hypertension or transplant were excluded. The discovery cohort for mQTL GWAS analysis of metabolite levels consisted of a coronary artery disease (CAD) case-control sample; CAD cases were defined as having one to three coronary arteries with clinically significant stenosis (i.e. >50%). Controls were defined as not having clinically significant CAD (i.e. zero coronary
arteries with>50% stenosis) and being free of cardiovascular disease, peripheral vascular dis-ease and with a normal ejection fraction (LVEF>40%), and were matched to cases on age, race and sex (745 cases and 745 matched controls). This CAD definition was also used as a covari-able in multivaricovari-able models assessing the association between mQTL and metabolite levels. To ensure generalizability of the mQTL results, the validation cohort for the metabolite GWAS consisted of a sequential cohort of 2022 CATHGEN individuals [30], and was not constrained on CAD or other status. Significant mQTL were tested for association with incident CVD events (death at any time during follow-up). All CATHGEN participants provided informed, written consent for participation in the CATHGEN biorepository at the time of enrollment. The Duke Institutional Review Board (IRB) approved the CATHGEN biorepository and this substudy.
GWAS genotyping
The Illumina Human Omni1-Quad Infinium Bead Chip (Illumina, San Diego, CA, USA) was used for genotyping in both the discovery and validation cohorts following the manufacturer’s protocol using 200 nanograms of DNA. Quantification of DNA samples prior to genotyping was performed using the Quant-iT PicoGreen dsDNA reagent in a 96-well plate format (Life Technologies, Grand Island, NY, USA). DNA quality was assessed using gel electrophoresis. All samples were scored on a zero to five scale and samples with a score<3 were not further used. Briefly, the samples were denatured and amplified overnight, followed by fragmentation, precipitation and resuspension. DNA was then hybridized to the Illumina BeadChip for 16–24 hours, washed to remove unhybridized DNA, and then labeled with nucleotides to extend the primers to the DNA sample. After the genotyping protocol, BeadChips were imaged using the Illumina iScan system. Genotypes were called using Illumina’s GenomeStudio V2010.2 soft-ware (version 1.7.4 Genotyping module). Any SNPs with<98% call frequency, minor allele fre-quency (MAF)<0.01 in all races, or out of Hardy-Weinberg equilibrium (p<10−6) were
excluded, resulting in the following number of autosomal SNPs for analysis: 785,945 in whites; 881,891 in blacks; and 871,209 in the“other”race (primarily Native American). Samples with <98% call rates for all SNPs, gender mismatches, cryptic relatedness, or with outlying ethnicity
(as determined by multidimensional scaling plots of a linkage disequilibrium-pruned set of SNPs) were excluded (172 samples).
Metabolomic profiling
analyzer, using reagents from Wako (Richmond, VA). For MS-profiled metabolites (acylcarni-tines, amino acids), proteins were first removed by precipitation with methanol. Aliquoted supernatants were dried, and then esterified with hot, acidic methanol (acylcarnitines) orn -butanol (amino acids). Analysis was done using tandem flow injection MS with a Quattro Micro instrument (Waters Corporation, Milford, MA). Quantification of the“targeted” inter-mediary metabolites was facilitated by addition of mixtures of known quantities of stable-iso-tope internal standards. Given the use of internal standards permitting absolute quantification of the metabolites in micromolar concentrations, values below the lower limits of quantifica-tion (LOQ) were reported and analyzed as“0”. Metabolites with>25% of values below LOQ were not analyzed (two acylcarnitines: C6 and C7-DC).
RNA microarray
RNA purification processing was done utilizing Qiagen PAXgene Blood RNA MDx Kits in fro-zen whole blood PAXgene tubes. Strict adherence to the PAXgene Blood RNA MDx Kit Hand-book, Second Edition, July 2005 protocol was maintained throughout the purification process. The purification process failed on 384 samples (four batches of ninety-six samples each) during processing for unidentified reasons and the samples were not repeated. Biotinylated total RNA was generated using the Illumina TotalPrep RNA amplification kit (Life Technologies, Grand Island, NY, USA); 200 nanograms of RNA was used for the kit. The quality of the RNA was determined using the Bioanalyzer RNA Nano chip assay (Agilent, Santa Clara, CA, USA). Quantification of the RNA was determined using the Quant-iT RiboGreen RNA Assay Kit. Samples with RIN scores less than 6.0 were not carried forward. The Human HT-12v3 Expres-sion BeadChip (Illumina, San Diego, CA) was used for quantitative RNA profiling and scanned on the Illumina iScan system according to manufacturer’s protocol. Biotinylated RNA (750 nanograms) was hybridized to the BeadChip and washed; Cy3-SA was then introduced to the hybridized samples and the BeadChips scanned on the Illumina iScan system according to manufacturer’s protocol. Quality control (QC) and background subtraction was performed using Illumina GenomeStudio tools. Probes with a detection p-value<0.05 and detected in >50% of samples were retained for analysis. Expression values were log2 transformed and
quantile normalized using Robust Multichip Average (RMA) methods. Results were visually inspected for outliers and sample failures after plotting for variance components comprising eight distinct and standard QC variables at the plate, chip and individual level. A total of 12,800 probes passed the detection and QC filters and 1204 samples passed the QC and outlier filters.
Statistical methods
nominal association (p<0.05, unadjusted for multiple comparisons) in the validation cohort. Significant SNPs were then: (1) analyzed using meta-analysis of the cohorts using METAL [32]; (2) tested for association with metabolite factor levels after adjustment for glomerular fil-tration rate and in multivariable models (adjusted for BMI, hypertension, CAD, diabetes, left ventricular ejection fraction, dyslipidemia, smoking and renal disease); and (3) tested for asso-ciation with time-to-death using Cox-proportional hazards modeling in the combined cohorts. Expression quantitative trait loci (eQTL) analyses of SNPs and SCDA levels were conducted using linear regression adjusted for age, race, sex and batch. Gene Set Enrichment Analysis (GSEA) [11], using the Preranked tool, was used on the resultant p-values for each SNP or SCDA covariate effect on expression levels to identify enriched KEGG pathways. GWAS analy-ses were corrected for multiple comparisons based on the above defined genomewide signifi-cance; other analyses were not adjusted for multiple comparisons and nominal unadjusted p-values are reported, with a p0.05 considered statistically significant.
Whole genome methylation profiling
For the methylation studies, we analyzed blood samples from a discovery cohort composed of 11 individuals from the combined CATHGEN cohorts who had the highest SCDA factor levels and 12 individuals with the lowest levels; and a validation cohort of 12 individuals with the next highest SCDA factor levels and 11 individuals with the next lowest levels; all 46 individuals were selected from those with RNA expression microarray data also available. DNA was iso-lated from blood mononuclear cells and sodium bisulfite treated prior to being prepped for analysis on the Illumina HumanMethylation 450K BeadChip following the manufacturer’s guidelines, using the Zymo EZ DNA Methylation Kit using manufacture’s protocol (Zymo Research Corporation Irvine, California USA). The alternative incubation condition recom-mended if using the Illumina Infinium Methylation Assay was used (supplied in the manufac-turer’s instruction manual appendix). Converted DNA was amplified, fragmented and hybridized to the Human Methylation27, RevB bead chip pool of allele-differentiating oligonucleotides.
models and empirical Bayes methods as implemented inlimma[37]. Our standard model adjusted for estimates of cell-type proportions present in each sample using the method of Houseman, et al. [38]; we also ran a sensitivity analysis that additionally included age, sex and race.
Biochemical characterization of C6-DC peak
Adipoyl carnitine and 3-methylglutaryl carnitine were synthesized from carnitine chloride and the corresponding cyclic acid anhydride according to the method of Johnson [13]. Products were confirmed by mass spectrometry. The liquid chromatography (LC)-MS/MS method of Maeda et al. [12] was extensively modified. Acylcarnitines were derivatized to butyl esters. The analytical platform was converted to a UPLC format using an Acquity UPLC HSS T3 column and the ion pairing reagent was changed to triethyl ammonium acetate. The carnitines were eluted using a linear gradient using water as solvent A and 95/5 v/v acetonitrile/water as solvent B starting at 20% B.
Supporting Information
S1 Fig. Overall study design and study flow.
(TIF)
S2 Fig. Q-Q plots of genome-wide association results for metabolite factor 1 (MCA). Dis-played are Q-Q plots for GWAS in the discovery cohort (adjusted for age, sex and PC-factors), (A) additive model, whites only; (B) dominant model, whites only; (C) additive model, blacks only; (D) dominant model, blacks only; (E) additive model, races combined; (F) dominant model, races combined.
(TIF)
S3 Fig. Q-Q plots for genomewide association results for metabolite factor 2 (LCDA). Dis-played are Q-Q plots for GWAS in the discovery cohort (adjusted for age, sex and PC-factors), (A) additive model, whites only; (B) dominant model, whites only; (C) additive model, blacks only; (D) dominant models, blacks only; (E) additive model, races combined; (F) dominant model, races combined.
(TIF)
S4 Fig. Q-Q plots for genomewide association results for metabolite factor 3 (SCDA). Dis-played are Q-Q plots for GWAS in the discovery cohort (adjusted for age, sex and PC-factors), (A) additive model, whites only; (B) dominant model, whites only; (C) additive model, blacks only; (D) dominant models, blacks only; (E) additive model, races combined; (F) dominant model, races combined.
(TIF)
S5 Fig. Locus Zoom plots of SCDA (factor 3) mQTL.Displayed are LocusZoom plots with -log10(p-value) (left Y-axis) and LD (right Y-axis), discovery cohort:(A)RSBN1L, additive model, blacks only;(B)FBXO25|ERICH1, additive model, blacks only;(C)FREM2|STOML3, dominant model, race meta-analysis;(D)SLC22A23|PXCD1, dominant model, race meta-anal-ysis.
(TIF)
degree of differential methylation and the Y-axis displays the count for the number of probes. (TIF)
S7 Fig. Biochemical refinement of C6-DC SCDA metabolite.Displayed are levels of two iso-mers of the C6-DC acylcarnitine metabolite: adipoyl and 3-methylglutaryl carnitine, in human plasma samples from 29 individuals with the highest C6-DC acylcarnitines from our previous studies, showing that the predominant isomer accounting for the high C6-DC levels is the 3-methylglutaryl carnitine.
(TIF)
S1 Table. Principal components analysis (PCA) in combined CATHGEN cohorts. Dis-played are the 14 factors identified through PCA in the combined discovery and validation CATHGEN cohorts (total N = 3512), with an annotated description of the top metabolites loaded for a given factor, and a list of the individual metabolites with the highest factors loads for each factor (absolute value of factor load>0.4).
(DOCX)
S2 Table. Factor loads for individual metabolites in the SCDA PCA-derived factor.
(DOCX)
S3 Table. Extended phenotypic analyses of top genetic variants identified from SCDA GWAS.Presented are results for the association between our most significant SCDA GWAS genetic variants after adjustment for glomerular filtration rate (GFR); in a multivariable model adjusted for cardiovascular risk factors; and for time-to-event analyses for the relationship between genetic variants and incident cardiovascular events.
(DOCX)
S4 Table. Differential expression analyses for top GWAS SNPs.This table displays p-values for the analysis of differential expression using an additive model for the top SNPs identified from the SCDA GWAS, forcis-acting transcripts, and for the individualtrans-acting tran-scripts for each SNP.
(DOCX)
Acknowledgments
We are grateful to CATHGEN participants and to Elaine Dowdy and Melissa Hurdle for study enrollment. Molecular data from this study are available through the NCBI dbGaP database (accession phs000703.v1.p1).
Author Contributions
Conceived and designed the experiments: WEK SHS SGG ERH CBN RS JRB DMM. Performed the experiments: JRB RS MM DK EG DHS DMM. Analyzed the data: CH DC SHS LK XQ. Contributed reagents/materials/analysis tools: DMM CBN JRB. Wrote the paper: CBN WEK SHS SGG ERH DMM EG.
References
1. Helgadottir A, Thorleifsson G, Manolescu A, Gretarsdottir S, Blondal T, Jonasdottir A, et al. A common variant on chromosome 9p21 affects the risk of myocardial infarction. Science. 2007; 316(5830):1491– 3. PMID:17478679
3. Shah AA, Craig DM, Sebek JK, Haynes C, Stevens RC, Muehlbauer MJ, et al. Metabolic profiles predict adverse events after coronary artery bypass grafting. The Journal of thoracic and cardiovascular sur-gery. 2012; 143(4):873–8. doi:10.1016/j.jtcvs.2011.09.070PMID:22306227
4. Shah SH, Bain JR, Muehlbauer MJ, Stevens RD, Crosslin DR, Haynes C, et al. Association of a periph-eral blood metabolic profile with coronary artery disease and risk of subsequent cardiovascular events. Circulation Cardiovascular genetics. 2010; 3(2):207–14. doi:10.1161/CIRCGENETICS.109.852814 PMID:20173117
5. Shah SH, Sun JL, Stevens RD, Bain JR, Muehlbauer MJ, Pieper KS, et al. Baseline metabolomic pro-files predict cardiovascular events in patients at risk for coronary artery disease. American heart journal. 2012; 163(5):844–50 e1. doi:10.1016/j.ahj.2012.02.005PMID:22607863
6. Shah SH, Hauser ER, Bain JR, Muehlbauer MJ, Haynes C, Stevens RD, et al. High heritability of meta-bolomic profiles in families burdened with premature cardiovascular disease. Molecular systems biol-ogy. 2009; 5:258. doi:10.1038/msb.2009.11PMID:19357637
7. Bhattacharya S, Granger CB, Craig D, Haynes C, Bain J, Stevens RD, et al. Validation of the associa-tion between a branched chain amino acid metabolite profile and extremes of coronary artery disease in patients referred for cardiac catheterization. Atherosclerosis. 2014; 232(1):191–6. doi:10.1016/j. atherosclerosis.2013.10.036PMID:24401236
8. Szebenyi G, Wigley WC, Hall B, Didier A, Yu M, Thomas P, et al. Hook2 contributes to aggresome for-mation. BMC cell biology. 2007; 8:19. PMID:17540036
9. Wang Y, Wan B, Li D, Zhou J, Li R, Bai M, et al. BRSK2 is regulated by ER stress in protein level and involved in ER stress-induced apoptosis. Biochemical and biophysical research communications. 2012; 423(4):813–8. doi:10.1016/j.bbrc.2012.06.046PMID:22713462
10. Liu S, Lv J, Han L, Ichikawa T, Wang W, Li S, et al. A pro-inflammatory role of deubiquitinating enzyme cylindromatosis (CYLD) in vascular smooth muscle cells. Biochemical and biophysical research com-munications. 2012; 420(1):78–83. doi:10.1016/j.bbrc.2012.02.118PMID:22406061
11. Subramanian A, Tamayo P, Mootha VK, Mukherjee S, Ebert BL, Gillette MA, et al. Gene set enrichment analysis: a knowledge-based approach for interpreting genome-wide expression profiles. Proceedings of the National Academy of Sciences of the United States of America. 2005; 102(43):15545–50. PMID: 16199517
12. Maeda Y, Ito T, Suzuki A, Kurono Y, Ueta A, Yokoi K, et al. Simultaneous quantification of acylcarnitine isomers containing dicarboxylic acylcarnitines in human serum and urine by high-performance liquid chromatography/electrospray ionization tandem mass spectrometry. Rapid communications in mass spectrometry: RCM. 2007; 21(5):799–806. PMID:17279485
13. Johnson DW. Synthesis of dicarboxylic acylcarnitines. Chemistry and physics of lipids. 2004; 129 (2):161–71. PMID:15081857
14. Reyes-Turcu FE, Ventii KH, Wilkinson KD. Regulation and cellular roles of ubiquitin-specific deubiquiti-nating enzymes. Annual review of biochemistry. 2009; 78:363–97. doi:10.1146/annurev.biochem.78. 082307.091526PMID:19489724
15. Smith NL, Felix JF, Morrison AC, Demissie S, Glazer NL, Loehr LR, et al. Association of genome-wide variation with the risk of incident heart failure in adults of European and African ancestry: a prospective meta-analysis from the cohorts for heart and aging research in genomic epidemiology (CHARGE) con-sortium. Circulation Cardiovascular genetics. 2010; 3(3):256–66. doi:10.1161/CIRCGENETICS.109. 895763PMID:20445134
16. McKeown L, Moss NK, Turner P, Li J, Heath N, Burke D, et al. Platelet-derived growth factor maintains stored calcium through a nonclustering Orai1 mechanism but evokes clustering if the endoplasmic reticulum is stressed by store depletion. Circulation research. 2012; 111(1):66–76. doi:10.1161/ CIRCRESAHA.111.263616PMID:22556336
17. Jang JW, Lee WY, Lee JH, Moon SH, Kim CH, Chung HM. A novel Fbxo25 acts as an E3 ligase for destructing cardiac specific transcription factors. Biochemical and biophysical research communica-tions. 2011; 410(2):183–8. doi:10.1016/j.bbrc.2011.05.011PMID:21596019
18. Kitagawa K, Skowyra D, Elledge SJ, Harper JW, Hieter P. SGT1 encodes an essential component of the yeast kinetochore assembly pathway and a novel subunit of the SCF ubiquitin ligase complex. Molecular cell. 1999; 4(1):21–33. PMID:10445024
19. Libert R, Van Hoof F, Laus G, De Nayer P, Habib Jiwan JL, de Hoffmann E, et al. Identification of ethyl-succinylcarnitine present in some human urines. Clinica chimica acta; international journal of clinical chemistry. 2005; 355(1–2):145–51. PMID:15820489
20. Ranek MJ, Terpstra EJ, Li J, Kass DA, Wang X. Protein kinase g positively regulates proteasome-medi-ated degradation of misfolded proteins. Circulation. 2013; 128(4):365–76. doi:10.1161/
21. Herrmann J, Lerman LO, Lerman A. On to the road to degradation: atherosclerosis and the protea-some. Cardiovascular research. 2010; 85(2):291–302. doi:10.1093/cvr/cvp333PMID:19815565
22. Vieira O, Escargueil-Blanc I, Jurgens G, Borner C, Almeida L, Salvayre R, et al. Oxidized LDLs alter the activity of the ubiquitin-proteasome pathway: potential role in oxidized LDL-induced apoptosis. FASEB journal: official publication of the Federation of American Societies for Experimental Biology. 2000; 14 (3):532–42.
23. Kikuchi J, Furukawa Y, Kubo N, Tokura A, Hayashi N, Nakamura M, et al. Induction of ubiquitin-conju-gating enzyme by aggregated low density lipoprotein in human macrophages and its implications for atherosclerosis. Arteriosclerosis, thrombosis, and vascular biology. 2000; 20(1):128–34. PMID: 10634809
24. Herrmann J, Saguner AM, Versari D, Peterson TE, Chade A, Olson M, et al. Chronic proteasome inhibi-tion contributes to coronary atherosclerosis. Circulainhibi-tion research. 2007; 101(9):865–74. PMID: 17823377
25. Herrmann J, Wohlert C, Saguner AM, Flores A, Nesbitt LL, Chade A, et al. Primary proteasome inhibi-tion results in cardiac dysfuncinhibi-tion. European journal of heart failure. 2013; 15(6):614–23. doi:10.1093/ eurjhf/hft034PMID:23616520
26. Feng B, Zhang Y, Mu J, Ye Z, Zeng W, Qi W, et al. Preventive effect of a proteasome inhibitor on the for-mation of accelerated atherosclerosis in rabbits with uremia. Journal of cardiovascular pharmacology. 2010; 55(2):129–38. doi:10.1097/FJC.0b013e3181c87f8ePMID:19935080
27. Versari D, Herrmann J, Gossl M, Mannheim D, Sattler K, Meyer FB, et al. Dysregulation of the ubiquitin-proteasome system in human carotid atherosclerosis. Arteriosclerosis, thrombosis, and vascular biol-ogy. 2006; 26(9):2132–9. PMID:16778122
28. Marfella R, D'Amico M, Di Filippo C, Baldi A, Siniscalchi M, Sasso FC, et al. Increased activity of the ubi-quitin-proteasome system in patients with symptomatic carotid disease is associated with enhanced inflammation and may destabilize the atherosclerotic plaque: effects of rosiglitazone treatment. Journal of the American College of Cardiology. 2006; 47(12):2444–55. PMID:16781372
29. Dombroski BA, Nayak RR, Ewens KG, Ankener W, Cheung VG, Spielman RS. Gene expression and genetic variation in response to endoplasmic reticulum stress in human cells. American journal of human genetics. 2010; 86(5):719–29. doi:10.1016/j.ajhg.2010.03.017PMID:20398888
30. Shah SH, Granger CB, Hauser ER, Kraus WE, Sun JL, Pieper K, et al. Reclassification of cardiovascu-lar risk using integrated clinical and molecucardiovascu-lar biosignatures: Design of and rationale for the Measure-ment to Understand the Reclassification of Disease of Cabarrus and Kannapolis (MURDOCK) Horizon 1 Cardiovascular Disease Study. American heart journal. 2010; 160(3):371–9 e2. doi:10.1016/j.ahj. 2010.06.051PMID:20826242
31. Purcell S, Neale B, Todd-Brown K, Thomas L, Ferreira MA, Bender D, et al. PLINK: a tool set for whole-genome association and population-based linkage analyses. American journal of human genetics. 2007; 81(3):559–75. PMID:17701901
32. Willer CJ, Li Y, Abecasis GR. METAL: fast and efficient meta-analysis of genomewide association scans. Bioinformatics. 2010; 26(17):2190–1. doi:10.1093/bioinformatics/btq340PMID:20616382
33. Chen W, Gao G, Nerella S, Hultman CM, Magnusson PK, Sullivan PF, et al. MethylPCA: a toolkit to control for confounders in methylome-wide association studies. BMC bioinformatics. 2013; 14:74. doi: 10.1186/1471-2105-14-74PMID:23452721
34. Du P, Kibbe WA, Lin SM. lumi: a pipeline for processing Illumina microarray. Bioinformatics. 2008; 24 (13):1547–8. doi:10.1093/bioinformatics/btn224PMID:18467348
35. Pidsley R, CC YW, Volta M, Lunnon K, Mill J, Schalkwyk LC. A data-driven approach to preprocessing Illumina 450K methylation array data. BMC genomics. 2013; 14:293. doi:10.1186/1471-2164-14-293 PMID:23631413
36. Teschendorff AE, Marabita F, Lechner M, Bartlett T, Tegner J, Gomez-Cabrero D, et al. A beta-mixture quantile normalization method for correcting probe design bias in Illumina Infinium 450 k DNA methyla-tion data. Bioinformatics. 2013; 29(2):189–96. doi:10.1093/bioinformatics/bts680PMID:23175756
37. Ritchie ME, Phipson B, Wu D, Hu Y, Law CW, Shi W, et al. limma powers differential expression analy-ses for RNA-sequencing and microarray studies. Nucleic acids research. 2015; 43(7):e47. doi:10. 1093/nar/gkv007PMID:25605792
![Table 1 displays baseline characteristics of the study population. PCA of metabolomic data identified 14 factors with metabolites in each factor clustering within biochemical pathways (S1 Table), and clustering similar to our previous studies [3 – 5, 7]](https://thumb-eu.123doks.com/thumbv2/123dok_br/18382143.356519/3.918.297.866.647.1049/characteristics-population-metabolomic-identified-metabolites-clustering-biochemical-clustering.webp)