SEM–EDX, Raman and infrared spectroscopic characterization of the phosphate
mineral frondelite (Mn
2+
)(Fe
3+
)
4
(PO
4
)
3
(OH)
5
Ray L. Frost
a,⇑, Yunfei Xi
a, Ricardo Scholz
b, Fernanda M. Belotti
c, Martina Beganovic
baSchool of Chemistry, Physics and Mechanical Engineering, Science and Engineering Faculty, Queensland University of Technology, GPO Box 2434, Brisbane, Queensland 4001, Australia bGeology Department, School of Mines, Federal University of Ouro Preto, Campus Morro do Cruzeiro, Ouro Preto, MG 35400-00, Brazil
cFederal University of Itajubá, Campus Itabira, Itabira, MG, Brazil
h i g h l i g h t s
"We have analyzed a frondelite
mineral sample from the Cigana mine, located in the municipality of Conselheiro Pena.
"The chemical formula was
determined as (Mn0.68,
Fe0.32)(Fe3+)3,72(PO4)3.72(OH)4.99. "The structure of the mineral was
assessed using vibrational spectroscopy.
"Bands attributed to the stretching
and bending modes of PO3 4 and
HOPO3
3 units were identified.
g r a p h i c a l
a b s t r a c t
a r t i c l e
i n f o
Article history:
Received 3 July 2012
Received in revised form 6 November 2012 Accepted 11 February 2013
Available online 4 March 2013
Keywords:
Frondelite Rockbridgeite Raman Infrared Phosphate Pegmatite
a b s t r a c t
We have analyzed a frondelite mineral sample from the Cigana mine, located in the municipality of Con-selheiro Pena, a well-known pegmatite in Brazil. In the Cigana pegmatite, secondary phosphates, namely eosphorite, fairfieldite, fluorapatite, frondelite, gormanite, hureaulite, lithiophilite, reddingite and vivia-nite are common minerals in miarolitic cavities and in massive blocks after triphylite. The chemical for-mula was determined as (Mn0.68, Fe0.32)(Fe3+)3,72(PO4)3.17(OH)4.99.
The structure of the mineral was assessed using vibrational spectroscopy. Bands attributed to the stretching and bending modes of PO3
4 and HOPO33units were identified. The observation of multiple
bands supports the concept of symmetry reduction of the phosphate anion in the frondelite structure. Sharp Raman and infrared bands at 3581 cm1is assigned to the OH stretching vibration. Broad Raman
bands at 3063, 3529 and 3365 cm1are attributed to water stretching vibrational modes.
Ó2013 Elsevier B.V. All rights reserved.
Introduction
Secondary phosphates are common minerals in lithium bearing pegmatites and most of them are related to the superposition of different geological and geochemical process. Different stages of hydrothermalism and the low temperature supergene alteration are responsible for the substitution of primary lithium phosphates
triphylite–lithiophilite and amblygonite–montebrasite, producing
complex paragenesis[1]. In recent published articles, the
charac-terization of the phosphate mineralogy became an important tool in the study of the geochemical and petrological evolution of
peg-matites[2].
In addition to the occurrence in granitic pegmatites, minerals of the frondelite–rockbridgeite series were also identified in
sedi-ments of Elk Lake, Canada[3]. Low temperature Fe and Mn
phos-phates play important role in the environmental geochemistry. The crystalization of authigenic minerals in sediments, develop
1386-1425/$ - see front matterÓ2013 Elsevier B.V. All rights reserved.
http://dx.doi.org/10.1016/j.saa.2013.02.008
⇑ Corresponding author. Tel.: +61 7 3138 2407; fax: +61 7 3138 1804.
E-mail address:r.frost@qut.edu.au(R.L. Frost).
Contents lists available atSciVerse ScienceDirect
Spectrochimica Acta Part A: Molecular and
Biomolecular Spectroscopy
an important function in the removal and storage of metals and
phosphate pollutants[4]. Despites their importance, some
phos-phate minerals are poorly characterized by spectroscopic methods, such as frondelite, rockbridgeite, reddingite and hureaulite.
Frondelite is a manganese and iron basic phosphate mineral
with general chemical formula expressed by (Mn2+)(Fe3+)
4(PO4)3
(-OH)5and belongs to the rockbridgeite group[5]. Frondelite forms a
complex triple series with rockbridgeite-(Mn2+)(Fe3+)
4(PO4)3(OH)5,
where the Mn2+is replaced by Fe2+, and plimerite-(Zn2+)(Fe3+)
4
(-PO4)3(OH)5, where the Mn2+is replaced by Zn2+[5,6]. Frondelite
crystallizes in orthorrombic crystal system, Bbmm space group
with unit-cell parametersa= 13.81 Å,b= 16.96 Å,c= 5.18 Å,Z= 4
andV= 1214.29 Å3.
Farmer [7] divided the vibrational spectra of phosphates
according to the presence, or absence of water and hydroxyl units in the minerals. In aqueous systems, Raman spectra of phosphate
oxyanions show a symmetric stretching mode (
m
1) at 938 cm1,the antisymmetric stretching mode (
m
3) at 1017 cm1, thesym-metric bending mode (
m
2) at 420 cm1 and them
4 mode at567 cm1[8–10]. The value for the
m
1symmetric stretching
vibra-tion of PO4units as determined by infrared spectroscopy was given
as 930 cm1 (augelite), 940 cm1 (wavellite), 970 cm1
(rock-bridgeite), 995 cm1(dufrenite) and 965 cm1(beraunite). The
po-sition of the symmetric stretching vibration is mineral dependent and a function of the cation and crystal structure. The fact that the symmetric stretching mode is observed in the infrared
spec-trum affirms a reduction in symmetry of the PO4units.
The value for the
m
2symmetric bending vibration of PO4units asdetermined by infrared spectroscopy was given as 438 cm1
(aug-elite), 452 cm1 (wavellite), 440 and 415 cm1 (rockbridgeite),
455, 435 and 415 cm1(dufrenite) and 470 and 450 cm1
(bera-unite). The observation of multiple bending modes provides an
indication of symmetry reduction of the PO4units. This symmetry
reduction is also observed through the
m
3antisymmetric stretchingvibrations. Augelite shows infrared bands at 1205, 1155, 1079 and
1015 cm1 [11]; wavellite at 1145, 1102, 1062 and 1025 cm1;
rockbridgeite at 1145, 1060 and 1030 cm1; dufrenite at 1135,
1070 and 1032 cm1; and beraunite at 1150, 1100, 1076 and
1035 cm1.
In the infrared study of triploidite, a basic manganese
phos-phate, Farmer reports the infrared spectrum with the (
m
1) at957 cm1, (
m
3) at 1090, 1058, 1030 and 1010 cm1, (m
2) at420 cm1and the
m
4mode at 595, 570, 486 cm1[12]. An hydroxyl
stretching frequency of 3509 cm1was given. In the spectroscopic
study of strengite, in the region below to 400 cm1, Frost and
We-ier[11]described the metal stretching vibrations for MnO and also
the OMnO bending modes.
In this work, samples of a pure, monomineral frondelite–rock-bridgeite from the Cigana pegmatite, located in the municipality of Conselheiro Pena, Brazil has been carried out. Studies include chemistry and backscattering images via SEM in the EDS mode, spectroscopic characterization of the structure with infrared and Raman spectroscopy.
Experimental
Sample description and preparation
The Cigana mine (also named as Jocão claim), located in the municipality of Conselheiro Pena, is a well-known pegmatite in Brazil, being an important source of rare phosphates. The pegma-tite is located in the Conselheiro Pena pegmapegma-tite district, one of the subdivisions of the Eastern Brazilian Pegmatite province
(EBP) that encompasses an area of about 150,000 km2, extending
from Bahia to Rio de Janeiro states.
The Cigana pegmatite is mined out and in the past was mined for industrial feldspar and with minor importance gemstones and samples for the collectors market. In the Cigana pegmatite, second-ary phosphates, namely eosphorite, fairfieldite, fluorapatite, frond-elite, gormanite, hureaulite, lithiophillite, reddingite and vivianite are common minerals in miarolitic cavities and in massive blocks formed after the aggregates of primary triphylite up to 0.5 m length. Frondelite occurs as botrioidal aggregates up to 10.0 cm in length. The aggregates appear in miarolitic cavities and replaces triphylite–lithiophilite crystals. Other minerals in association are hureaulite and lithiophilite.
Deep green frondelite botrioidal aggregates were collected. The sample was incorporated in the collection of the Geology Depart-ment of the Federal University of Ouro Preto, Minas Gerais, Brazil, with sample code SAA-088. The aggregate was hand selected from a sample in association with hureaulite and lithiophilite. The frondelite fragments were phase analyzed by X-ray diffraction
and Scanning electron microscopy (SEM) for simple
characterization.
Electron probe micro-analysis (EPMA)
A quantitative chemical analysis was carried via EPMA. Frondel-ite–rockbridgeite botrioidal aggregate selected for this study was analyzed with the performance of five spots. The chemical analysis was carried out with a Jeol JXA8900R spectrometer from the Phys-ics Department of the Federal University of Minas Gerais, Belo Hor-izonte. For each selected element was used the following
standards: Fe – magnetite, Mn – rodhonite, P – Ca2P2O7Ca –
Apa-tite Astimex. The limit detection is up to 0.01 wt%. The epoxy embedded frondelite sample was polished in the sequence of
9
l
m, 6l
m and 1l
m diamond paste MetaDIÒII Diamond Paste – Buhler, using water as a lubricant, with a semi-automatic
Mini-MetÒ1000 Grinder-Polisher – Buehler. Finally, the epoxy
embed-ded hureaulite was coated with a thin layer of evaporated carbon. The electron probe microanalysis in the WDS (wavelength dispersive spectrometer) mode was obtained at 15 kV accelerating voltage and beam current of 10 nA. Chemical formula was calcu-lated on the basis of seventeen oxygen atoms (O, OH, F).
Raman microprobe spectroscopy
Botrioidal aggregates of frondelite were placed on a polished metal surface on the stage of an Olympus BHSM microscope, which
is equipped with 10, 20, and 50objectives. The microscope is
part of a Renishaw 1000 Raman microscope system, which also in-cludes a monochromator, a filter system and a CCD detector (1024 pixels). The Raman spectra were excited by a Spectra-Physics mod-el 127 He–Ne laser producing highly polarized light at 633 nm and
collected at a nominal resolution of 2 cm1 and a precision of
±1 cm1in the range between 200 and 4000 cm1. Repeated
acqui-sitions on the samples using the highest magnification (50) were
accumulated to improve the signal to noise ratio of the spectra. The spectra were collected over night. Raman Spectra were calibrated
using the 520.5 cm1line of a silicon wafer. The Raman spectrum
Table 1
Chemical composition of reddingite–phosphoferrite from Cigana pegmatite (mean of four electron microprobe analyses). H2O calculated by stoichiometry.
Constituent wt.% Number of cations Range (wt.%) Probe standard
MnO 7.40 0.68 7.11–7.82 Rodhonite FeO 3.6 0.32 43.29–46.70 Magnetite Fe2O3 45.91 3.72
MgO 0.07 0.00 0.01–0.04 MgO P2O5 34.82 3.17 34.27–35.31 Ca2P2O7
H2O 6.94 4.99 Calculated by stoichiometry
Total 98.68 12.88
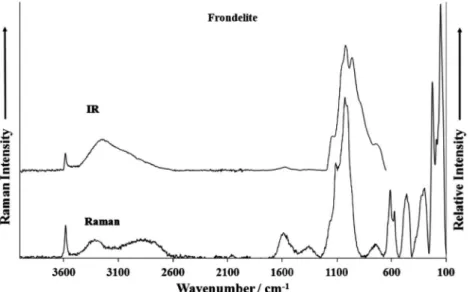
Fig. 1.Raman spectrum of frondelite over the 100–4000 cm1spectral range and Infrared spectrum of frondelite over the 500–4000 cm1spectral range.
of at least 10 crystals was collected to ensure the consistency of the spectra.
Infrared spectroscopy
Infrared spectra were obtained using a Nicolet Nexus 870 FTIR spectrometer with a smart endurance single bounce diamond
ATR cell. Spectra over the 4000–525 cm1 range were obtained
by the co-addition of 128 scans with a resolution of 4 cm1and a
mirror velocity of 0.6329 cm/s. Spectra were co-added to improve
the signal to noise ratio. The infrared spectra are given in the
Sup-plementary information.
Spectral manipulation such as baseline correction/adjustment and smoothing were performed using the Spectracalc software package GRAMS (Galactic Industries Corporation, NH, USA). Band component analysis was undertaken using the Jandel ‘Peakfit’ soft-ware package that enabled the type of fitting function to be se-lected and allows specific parameters to be fixed or varied accordingly. Band fitting was done using a Lorentzian–Gaussian cross-product function with the minimum number of component bands used for the fitting process. The Gaussian–Lorentzian ratio was maintained at values greater than 0.7 and fitting was
under-taken until reproducible results were obtained with squared
corre-lations ofr2greater than 0.995.
Results and discussion
Chemical characterization
The quantitative chemical analysis of frondelite–rockbridgeite
mineral series is presented inTable 1. Composition is the result
of medium values in five spots. H2O content was calculated by
stoi-chiometry and the chemical formula was calculated on the basis of
seventeen oxygen atoms (O, OH, F) on the structure. The Fe2+/Fe3+
ratios was calculated by stoichiometry considering the occupancy
of the tetrahedral site by Mn2++ Fe2++ Mg2+= 1. The chemical
composition indicates an intermediate member of the frondelite– rockbridgeite series with predominance of frondelite under rock-bridgeite. Small amounts of magnesium were detected and that re-places Mn and Fe in the structure. Chemical formula can be
expressed as: (Mn0.68, Fe0.32)(Fe3+)3,72(PO4)3.72(OH)4.99.
The cationic deficiency in the octahedral site is observed due to
the lower amount of Fe3+(3.72 atoms) than expected (four atoms).
This phenomenon can be explained due to vacancies that
Fig. 3.(a) Raman spectrum of frondelite over the 1300–1800 cm1spectral range and (b) Infrared spectrum of frondelite over the 1300–1800 cm1spectral range.
commonly occur in secondary phosphates. The presence of
vacan-cies is supported by the presence of H+in the HOPO3
3 units as
ob-served in the Raman spectra.
Vibrational spectroscopy
The Raman spectrum of frondelite in the 100–4000 cm1
spec-tral range is illustrated inFig. 1. This spectrum displays the
posi-tion and relative intensity of the Raman bands. It is noted and
spectral intensity in the 2600–4000 cm1spectral region is
mini-mal. It is noted that there are large parts of the spectrum where no intensity is observed. Thus, the Raman spectrum is divided into sections according to the type of vibration being observed. The
infrared spectrum of frondelite over the 500–4000 cm1 spectral
range is also shown inFig. 1. This figure records the position and
relative intensity of the infrared bands. Some intensity is now ob-served in the OH stretching region.
The Raman spectrum of frondelite in the 2500–3800 cm1
spec-tral range is illustrated inFig. 2a. This spectrum displays a sharp
band at 3581 cm1superimposed upon a broad spectral profile.
This sharp band is attributed to the stretching vibrations of the OH units. The broad spectral profile may be resolved into
compo-nent bands at 2747, 2886, 3027, 3157 and 3325 cm1. These bands
are assigned to water stretching vibrations. The infrared spectrum
in the 2500–3700 cm1spectral range is reported inFig. 2b. As for
the Raman spectrum, the spectral profile consists of a sharp band
at 3583 cm1assigned to the stretching vibrations of the OH units
and a broad spectral profile with component bands at 3063, 3529
and 3365 cm1. These latter bands are attributed to water
stretch-ing vibrations.
A question that might be raised is the formula as written above
Mn0.68, Fe0.32)(Fe3+)3,72(PO4)3.17(OH)4.99 correct? Both Raman and
infrared spectroscopy clearly shows the existence of OH units. Fur-ther Raman spectroscopy identifies bands which are attributed to
HOPO3
3 units. Thus some of the protons from water are associated
with the phosphate units. It is suggested that the formula of
frond-elite is better written as (Mn0.68, Fe0.32)(Fe3+,!)3,72
(PO4,HOPO3)3.17(OH,H2O)4.99.
The Raman spectrum in the 1400–1800 cm1spectral range is
shown inFig. 3a. The spectrum suffers from a lack of signal. The
spectral profile may be resolved into component bands at 1532
and 1597 cm1. This latter band is attributed to the bending mode
of non-hydrogen bonded water. The Raman spectrum of water is of a very low intensity as water is a very poor Raman scatterer. On the
other hand, water is an intense infrared absorber and thus the
infrared spectrum as shown inFig. 3b, shows significant intensity.
A band is resolved at 1643 cm1and is assigned to the water
bend-ing mode of strongly hydrogen bonded water. Other infrared bands
are observed at 1480 and 1575 cm1. These bands are considered
to be combination bands.
The Raman spectrum of frondelite in the 800–1400 cm1
spec-tral range is displayed inFig. 4a. The spectrum shows a complex
profile with component bands resolved in the spectrum using band component analysis. Raman bands are observed at 966, 1000, 1027,
1071, 1112 and 1164 cm1. The Raman band at 1000 cm1is
as-signed to the
m
1 symmetric stretching mode of the PO34 units.The band at 966 cm1is attributed to the HOPO3
3 units. The
Ra-man bands at 1071, 1112 and 1164 cm1 are attributed to both
the HOP and PO antisymmetric stretching vibrations.
Choi et al. reported the polarization spectra of NaH2PO4crystals.
Casciani and Condrate [13] published spectra on brushite and
monetite together with synthetic anhydrous monocalcium
phos-phate (Ca(H2PO4)2), monocalcium dihydrogen phosphate hydrate
(Ca(H2PO4)2H2O) and octacalcium phosphate (Ca8H2(PO4)65H2O).
These authors determined band assignments for Ca(H2PO4) and
re-ported bands at 1012 and 1085 cm1 as POH and PO stretching
vibrations, respectively. Casciani and Condrate[13]tabulated
Ra-man bands at 1132 and 1155 cm1and assigned these bands to
P–O symmetric and the P–O antisymmetric stretching vibrations. It is proposed that the proton on the hydroxyl units is very liable and can oscillate between the OH units and the phosphate units. In this way the hydrogen phosphate units are formed. Raman
bands in the 748 cm1 spectral region are assigned to hydroxyl
deformation modes.
The infrared spectrum of frondelite in the 500–1300 cm1
spec-tral range is shown inFig. 4b. There is a strong resemblance in the
shape of the spectral profile of the infrared and Raman spectra. As with the Raman spectrum, the spectral profile is complex with a series of overlapping bands. The resolved component bands at
695, 736 and 801 cm1may be attributed to hydroxyl deformation
vibrations. The infrared band at 964 cm1is attributed to the PO
stretching vibration of the HOPO3
3 units. The infrared band at
1008 cm1may be assigned to the
m
1symmetric stretching modeof the PO3
4 units. The series of infrared bands at 1025, 1057,
1103, 1154 and 1179 cm1are assigned to the HOP and PO
m
3
anti-symmetric stretching vibrations.
The Raman spectrum of frondelite in the 300–800 cm1spectral
range is reported inFig. 5a. This part of the Raman spectrum may
Fig. 5.(a) Raman spectrum of frondelite over the 300–800 cm1spectral range and (b) Raman spectrum of frondelite over the 100–300 cm1spectral range.
be divided into three regions: (a) bands in the 550–650 cm1
spec-tral region (b) bands centered around 455 cm1and (c) bands in
the 300–380 cm1spectral range. The first group of bands at 572,
589, 612 and 635 cm1are assigned to the
m
4out of plane bending
modes of the PO4and HPO4units. The Raman spectrum of NaH2PO4
shows Raman bands at 526, 546 and 618 cm1. The observation of
multiple bands in this spectral region supports the concept of sym-metry reduction of both the phosphate and hydrogen phosphate
units. The second group of bands at 436, 455 and 481 cm1 are
attributed to the
m
2 PO4 and HPO4 bending modes. The Ramanspectrum of NaH2PO4 shows two Raman bands at 460 and
482 cm1. The observation of multiple Raman bands for the
frond-elite mineral supports the concept of symmetry reduction. The
third group of bands at 291, 329 and 379 cm1are attributed to
metal–oxygen vibrations. The Raman spectrum in the far low
wavenumber region is shown inFig. 5b. Raman bands are observed
at 126, 151, 172, 189, 207 and 226 cm1and are simply described
as lattice vibrations.
Conclusions
The name frondelite is given to the mineral of composition
Mn2þFe3þ
4 ðPO4Þ3ðOHÞ5 isostructural and isomorphous with
rock-bridgeite, the ferrous iron analog. We have analyzed frondelite mineral sample from the Cigana mine using a combination of elec-tron probe analysis and vibrational spectroscopy. By using elecelec-tron
probe analysis, The chemical formula was determined as (Mn0.68,
Fe0.32)(Fe3+)3.72(PO4)3.17(OH)4.99. The vacancies in the Fe3+site,
ob-served due to the cationic deficiency, is supported by the presence
of H+in the HOPO3
3 units as observed in the Raman spectra.
The structure of the mineral was assessed using vibrational spectroscopy. The Raman spectrum of frondelite in the 800–
1400 cm1 spectral range shows a complex profile with
compo-nent bands resolved using band compocompo-nent analysis. The Raman
band at 1000 cm1is assigned to the
m
1symmetric stretching mode
of the PO3
4 units. The band at 966 cm1is attributed to the HOPO33
units. The Raman bands at 1071, 1112 and 1164 cm1are
attrib-uted to both the HOP and PO antisymmetric stretching vibrations. Raman spectroscopy shows the presence of both phosphate and hydrogen phosphate units in the frondelite structure. A sharp
Ra-man band at 3581 cm1is attributed to the stretching vibrations
of the OH units. The broad Raman spectral profile may be resolved
into component bands at 2747, 2886, 3027, 3157 and 3325 cm1
which are assigned to water stretching vibrations.
A question that might be raised is the formula as written above
(Mn0.68, Fe0.32)(Fe3+)3,72(PO4)3.17(OH)4.99correct? Both Raman and
infrared spectroscopy clearly shows the existence of OH units. Fur-ther Raman spectroscopy identifies bands which are attributed to
HOPO3
3 units. Thus, some of the protons from water are associated
with the phosphate units. Vibrational spectroscopy clearly identi-fies water in the structure.
Acknowledgements
The financial and infra-structure support of the Discipline of Nanotechnology and Molecular Science, Science and Engineering Faculty of the Queensland University of Technology, is gratefully acknowledged. The Australian Research Council (ARC) is thanked for funding the instrumentation. R. Scholz thanks to FAPEMIG – Fundação de Amparo à Pesquisa do estado de Minas Gerais, (Grant No. CRA - APQ-03998-10). Martina Beganovic thanks to CNPq for the masters scholarship.
Appendix A. Supplementary material
Supplementary data associated with this article can be found, in
the online version, athttp://dx.doi.org/10.1016/j.saa.2013.02.008.
References
[1] P.B. Moore, Min. Rec. (1973) 103.
[2] E. Roda-Robles, R. Vieira, A. Pesquera, A. Lima, Miner. Petrol. 100 (2010) 23. [3] W. Dean, L.A. Doner, J. Paleolimnol. 47 (2012) 29.
[4] J.O. Nriagu, C.I. Dell, Am. Mineral. 59 (1974) 934. [5] J. Sejkora, J. Plášil, J. Filip, J. Geosci. 56 (2011) 215.
[6] P. Elliott, U. Kolitsch, G. Giester, E. Libowitzky, C. McCammon, A. Pring, W.D. Birch, J. Brugger, Mineral. Mag. 73 (2009) 131.
[7] V.C. Farmer, Mineralogical Society Monograph 4: The Infrared Spectra of Minerals, 1974.
[8] R.L. Frost, W. Martens, P.A. Williams, J.T. Kloprogge, Mineral. Mag. 66 (2002) 1063.
[9] R.L. Frost, W. Martens, P.A. Williams, J.T. Kloprogge, J. Raman Spectrosc. 34 (2003) 751.
[10] R.L. Frost, W.N. Martens, T. Kloprogge, P.A. Williams, Neues Jahrb. Mineral. (2002) 481.
[11] R.L. Frost, M.L. Weier, J. Mol. Struct. 697 (2004) 207. [12] R.L. Frost, K.L. Erickson, Spectrochim. Acta 61A (2004) 45.