NESTLÉ’S DYNAMIC FORECASTING PROCESS: ANTICIPATING RISKS AND
OPPORTUNITIES
ANA SOFIA FIDALGO DIAS, 323
A Project carried out on the Finance course, under the supervision of: Miguel Ferreira
Patricia Relvas
Abstract
Nestlé’s Dynamic Forecasting Process: Anticipating Risks and Opportunities
This Work Project discusses the Nestlé’s Dynamic Forecasting Process, implemented within the organization as a way of reengineering its performance management concept and
processes, so as to make it more flexible and capable to react to volatile business
conditions. When stressing the importance of demand planning to reallocate resources and
enhance performance, Nescafé Dolce Gusto comes as way of seeking improvements on this
forecasts’ accuracy and it is thus, by providing a more accurate model on its capsules’
sales, as well as recommending adequate implementations that positively contribute to the
referred Planning Process, that value is brought to the Project.
Index
Purpose of Project – General Overview ... 3
Literature Review ... 5
The Dynamic Forecasting Process ... 7
The Dynamic Planning Process... 8
The Monthly Business Planning ... 9
The Dynamic Planning Framework... 11
Limitations and Proposals for Intervention ... 12
Monthly Sales Review Meeting: risks and opportunities ... 12
Nescafé Dolce Gusto Case – Improving Demand Plan Accuracy ... 14
Methodology ... 15
Results ... 16
Conclusion ... 21
References ... 23
Purpose of Project
–
General Overview
In the course of the current global economic environment flexibility has emerged more
strongly than ever as a crucial factor for survival and success. These challenging and
volatile times have prompted business leaders to review their business models in a way to
serve its customers, and react to their needs, faster and more efficiently. The strategic
positioning of organizations requires qualified systems for managing its internal resources
so that it contributes to the company’s sustainability and competitiveness. Traditional approaches to planning have proven to be obsolete. Moving towards the implementation of
a business model may be the solution for the organization to adapt quickly when faced with
volatility and uncertainty.
Tracing its origin back to 1905, when a merger between Henri Nestlé’s Society and the
Anglo-Swiss Condensed Milk Company took place, Nestlé has been since then on its way to
be considered the world’s largest food, nutrition and beverage company. Today it counts with a product line that includes coffee, chocolate, breakfast cereals, dairy products, bottled
water, confectionary, ice cream, food seasoning, pet foods and pharmaceutical products.
With main headquarters in Vevey (Switzerland) Nestlé’s presence is patent in most markets, operating on more than 83 countries and employing over than 280.000 people.
Being a listed company, such as Nestlé, means having to give permanent idea on where the
company is heading to investors, who want to perceive if the company is worth investing in
or not. Therefore, having a well defined set of plans and strategies is of great importance,
Bearing this in mind, Nestlé decided that it was not enough to focus on a static planning
that would spotlight only the current fiscal year (the Operational Plan) but instead to
embrace with the framework and the tools that would help enhance flexibility: the Dynamic
Planning Framework. The Dynamic Planning Framework is the source of implementation
of Dynamic Planning Processes, such as the Monthly Business Planning Process. By
resorting to such tools Nestlé intends, not only to be able to shape future demand, but to
perceive how impacts such as the economic environment, marketing & sales strategies, and
new product releases, may have on the final Income Statement of the company, and apply
measures to cover those risks or opportunities.
This Work Project comes as an opportunity to develop a specific project at Nestlé, where
I had the chance of doing an internship and contacting closely with the concept of Dynamic
Forecasting.
What is the Dynamic Forecasting Process? On what does it consist? What sort of
improvements is it possible to hunt for? These are some of the questions that this Work
Project will approach, not only by describing what is the origin of the Dynamic Forecasting
Process, who does it involve, but also to focus on a particular aspect of the process that
may need to be reviewed and enhanced. This latter aspect deals with the Demand Planning
aspect of the whole process, by acknowledging the necessity of improving the Demand
Plan Accuracy (DPA) of a specific Nestlé Beverages business - the Nescafé Dolce Gusto.
In this Work Project, I try to extend the acquaintance of how can data on sales of Nescafé
Dolce Gusto machines be used to better understand and forecast the sales of the brand’s
Literature Review
For many years much has been exacerbated on the challenge of managing through times
of great complexity, risk and uncertainty and the need of adapting in such an environment.
As it was long time ago strained by Charles Darwin (“Origin of the Species”, 1859), “The species that survive are not the strongest, nor the most intelligent, but those that adapt to
changes.” The principle can be extended to a business. Only the ones who are able to find
the appropriate tools to respond to the constant changes of the macro and microeconomic
environment do survive.
For over decades, Adam Smith’s theory was well embraced by organizations. This theory defended that industrial work should be reduced to its simplest and more basic tasks,
and each person would specialize in a single function (Hammer and Champy, 1993).
However Hammer and Champy (1993) acknowledged the fact that the theory that had been
once applied had no practical application anymore. They criticize management procedures
applied until the time and argue that “it is no longer necessary or desirable for companies to
organize their work around Adam Smith’s division of labor”. Instead, given the new
dynamics in the business world there should be a change from task-oriented jobs (that are
becoming obsolete) towards a process reengineering. “Reengineering is the fundamental rethinking and radical design of business processes to achieve dramatic improvements in
critical, contemporary measures of performance, such as cost, quality, service, and speed.” (Hammer and Champy, 1993) However, as Hammer and Champy (1993) state, for this
process reengineering to be successfully implemented it should be accompanied by an
reengineering-related technology” would be the “Enterprise Resource Planning (ERP), an integrated
software system that supports not only individual functional areas but complete business
processes.” They argue that “without reengineering, information technology delivers little
payoff; without information technology, little reengineering can be done.”
More recently Chase (2009) brought out the fact that “most demand planning processes
are not adequate to deal with the present day economic volatility” and that “understanding
the effects of sales promotions, marketing events and economic factors is more critical than
ever”. The same point of view is shared by Makridakis (1987). According to this author it is
not enough to look at tendencies of past data, but also to understand the impacts that future
events may have when forecasting. He also argues that “marketing staff tend to produce
optimistic forecast due to their need to believe sales are likely to improve from a better
marketing effort” while “sales forecasters are often seen as pessimistic” so as to “protect themselves from criticism”. In order to anticipate key elements, factors such as “the firm, the environment, the market, and the competition” should be previously analyzed.
Turning into a specific part of the Dynamic Forecasting Process- the Demand Planning -
Chase (2009) defended that many companies today determine the demand forecast on
professional judgment as “a way to meet their needs” or to “justify sales targets based on
stretch goals”. Still, most of the demand planners think that by doing so they are actually
“enhancing the accuracy of the forecast”. Chase (2009) also stresses the importance of the
Consensus Forecasting on the process of Demand Forecasting, since it “requires each
functional department to submit its version of the demand forecast to create a final
The Dynamic Forecasting Process
In a world where nothing is constant and what yesterday was seen as possible and viable
and now is seen as outdated and impractical it is of major importance for companies to be
able to anticipate the market tendencies rapidly and effectively in order to maintain its
competitive positioning. Thus, being able to build and maintain a strong customer
relationship is a powerful contributor to a company’s ability to manage through rough
times. In order to do this, companies wanting to thrive nowadays should implement Lean
processes1 by examining and reengineering their Customer Relationship Management
(CRM)2 processes. For this purpose arises the need for a process reengineering as a way for companies to implement their Enterprise Resource Planning (ERP) software and thus help
reallocate resources on the most strategic and value-adding way.
Aiming for this, Nestlé implemented the GLOBE Framework with a new ERP software
SAP (“Systems Applications and Products”) that allows corporations to interact through a
common database. GLOBE - Global Business Excellence - was the application of the
concept of Process Reengineering in Nestlé. This one is based on three main goals:
Implementation of best practices of the processes from the different markets in a
harmonized global way; the use of standardized information; the exploitation of a unique
information system covering the entire Nestlé. Currently, GLOBE covers a series of
End-to-End processes3 namely the Dynamic Planning Process.
1
Lean Processes intends to split processes through processes that indeed create values and the ones that don’t. 2
Customer Relationship Management is a way of managing information regarding all the various aspects concerning their customers, such as sales prospects, customer service, or even marketing.
3
- The Dynamic Planning Process
The Dynamic Planning Process comprises the alignment between the Management
Business Strategy (which consists on an analysis of each business unit and the economic
environment so as to decide on what should be the long term strategies to pursue within the
organization for the following three years) and the Dynamic Forecasting, Demand
Planning, and Monthly Business Planning processes.
This process intends to replace the old Operational Plan process by combining actual
and forecasted data based on a rolling 18 months planned Income Statement, first arranged
by business unit and then aggregated for whole businesses.
The Dynamic Forecasting comprises information from Marketing & Sales, Finance, and
Supply Chain, which has then to be aligned with the Integrated Commercial Planning and
Consensus Demand Planning, within the same portfolio. Consensus Demand Planning
represents a collaborative process designed to bring together the interdependent
assumptions of three plans originated from the Business Strategy: the Integrated
Commercial Plan (where business plans are set), led by Generating Demand Department;
the Dynamic Forecast, led by Finance; and the Demand Plan, led by Supply Chain. To
ensure the consistency of all activities, these decisions must all be based on one single
estimate – the Consensus Demand Plan. This “One Number” principle does not mean that there is literally one number that the former departments use but rather that there is one set
At Nestlé, the process performance of Demand Planning is measured by the KPIs4
Demand Plan Accuracy and Demand Plan Bias. Zones, markets and, most importantly,
Demand Planners monitor the values closely and compare them to targets.
So that all information may be effectively aligned the Dynamic Forecasting assumptions
(defined as Medium Term Strategy Directions) need to be revised on a monthly basis, so as
to ensure that all strategies are in alignment with changes that may have taken place or are
expected to occur, within the business, or even surrounding it. This monthly revision, called
the Monthly Business Planning, defines the Short Term Tactical Direction, by enabling all
business areas to operate with a single set of aligned plans and assumptions.
- The Monthly Business Planning
The Monthly Business Planning (MBP), as it was referred in the broader concept of the
Dynamic Forecasting, represents a cross-functional process under joint responsibility and
leadership of the Supply Chain, Sales & Marketing and Finance & Control functions. So,
by challenging integration between functions, it enables all the four departments to operate
with a single set of aligned numbers/assumptions.
The process encompasses a full 18 months financial review done once a year and
monthly reviews of shorter horizons. These monthly reviews consist on a set of four
meetings where volumes, gaps and possible impacts are aligned so as to come up with a
consensus “One Number” volume. The MBP meetings are held in sequence starting with
MSR in week one and the cycle will only be completed by the end of the month, as follows:
4
Monthly Sales Review (MSR) – following a 3 months approach (only high level information used for the rolling 18-months forecast), it consists on consolidating
customer plans, reviewing the details for the upcoming 3 months sales and marketing
activities, and gathering competition and market information, so as to achieve aligned
sales plans and agreed sales volumes to be discussed on the next meeting (MGR).
Participants5 include Marketing, Sales, Decision Support, Demand & Supply Planners and Finance & Control.
Monthly Gap Review (MGR) – resorting to a 3-6 months approach, it also covers the consolidation of the expected trade activities for the upcoming 3 months (as it is done in
the MSR), review of key customer information and simulation of the financial actual
results so as to achieve proposed scenarios and volumes to be presented during the next
meeting (MFR). The purpose of this meeting is to review the 18-months Demand Plan,
promote gap’s closing, present risks and opportunities and assess alignment of the
Dynamic Forecasting with the Management Business Strategies. Participants include
Sales, Marketing, Demand Planner and the Business Executive Manager.
Monthly Forecast Review (MFR) – using the months that are still ahead in the current year, as well as the upcoming year (but focusing on the details only for the next 4 to 6
months) it provides analysis on the proposed scenarios stretched on the previous meeting
and the impacts from changes in strategies, so that they reach the signoff Dynamic
Forecasting (18-months Business Plan) and Consensus Demand Plan, based on the “One
Number” Principle. Participants include Sales, Marketing, Supply Chain, Finance &
Control, and the Business Executive Manager.
5
Monthly Operations Review (MOR) –aligning Demand and Supply for the upcoming 18 months, with all the assumptions included, this meeting intends to review demand
capacity, supply situation and purchase so as to get a forward looking perspective and
identify operational issues/solutions that may impact the value chain (e.g. capacity
constraints, raw and packaging material shortages, etc.). Participants include Sales and
the Business Executive Manager or the Country Business Manager (when it applies).
- The Dynamic Planning Framework
The Dynamic Forecasting (DF) Process and, more precisely, the Monthly Business
Planning, come as a backbone to implement successfully the Dynamic Planning
Framework (DPF) within Nestlé, which shall be completely implemented by 2012.
Furthermore, and as has already been explicit, there are a series of contributors that not
only influence the Monthly Business Planning, and consequently the DF, but also
contribute to this implementation of the DPF, namely the Monthly Business Planning
Dashboard. This latter one serves as a tool created for the series of the four mentioned
reunions and helps analyzing the diverse risks and opportunities for each business.
The Monthly Business Planning plays a crucial role on the Dynamic Planning
Framework and thus it is important that the way the process undergoes takes into account
the established “Best Practices” which aims to improve the effectiveness of planning
through a solid and standard planning process, helps aligning full cross-functionality within
far beyond the simple discussion of volumes. MBP “Best Practices” contains the best practices for each of the meetings of the monthly planning process and proposals agenda to
guide the markets in the implementation of the MBP process. Throughout the “Best Practices” it is essential to work as team and to make an effort in the way of being able to elaborate more stringent forecasts, closer to reality and properly justified, even if the
environment is of great uncertainty and indecision.
Bearing this in mind the best approach to follow in this Work Project would be to seek
improvements that may be essential for enhancing efficiency to the whole process. In this
sense the best way to contribute positively would be to attend the four meetings that part
the Dynamic Forecasting Process and understand what drawbacks could be taken from the
experience. Due to the fact that the MSR is the meeting with the higher level of detail,
amount of effort and time spent, only the Monthly Sales Review Meeting will be subject to
review.
Limitations and Proposals for Intervention
- Monthly Sales Review Meeting: risks and opportunities
With the rationale of understanding in a more practical way how the process undergoes
the best solution was to attend a MSR Meeting, in this case, from the Beverages Business.
In a nutshell it was possible to observe that all the previously referred participants were
present, no more no less, and that the meeting was well scheduled, since it had already been
Nevertheless, there was some lack of alignment on the access to the information
provided to all participants since a great part of the time was spent discussing some
occurrences that had happened in the past and that were not yet well explained, as well as
there was some new information that not all of the participants knew yet.
For this purpose for the following meetings it should be created a “central data bank” that would not just work as a singular source to download documents (as the company
already has it - the “Team Room”) but also to serve as a source of new information that
some department may be aware and the others don’t (such as cases of stock shortage,
among others). The organization should decide in advance what types of data might
possibly be relevant for each type of strategic decision. The important information would
be collected routinely and stored in this “central data bank”.
Another recommendation would be to previously send the PowerPoint presentation that
will be used for the meeting since it would be a way for the participants to do a forehand
analysis on the main information that will be covered. If successful and aligned with the
required “Best Practices” this solution could prevent a very time-consuming reunion.
As a final point, the last issue to be covered regards the volumes forecasted for each
month. In this case, and as it was already referred on Chase (2009) statements, many
volumes are reached through the use of judgmental aspects, such as applying a number as
close as possible to the target one which would, aftermost, affect the forecasts’ accuracy.
So, as Chase (2009) also defended, it should be conducted a “forecast value added analysis” to “determine if value was added to the statistical baseline forecasts when manual overrides
are made, by all individuals in the demand forecasting process”. The objective would be
determine if it improved or not. The purpose would not to punish people if they did wrong,
but to work together as a way to improve the forecasts’ quality.” (Chase, 2009)
- Nescafé Dolce Gusto Case – Improving Demand Plan Accuracy
As it may be known, Nescafé is not just a particular brand, but the world’s leading
coffee brand, being present in more than 120 countries. As for the specific Nescafé Dolce
Gusto (“NDG”), a new single-cup coffee system which emerged from the union between
Nescafé and Krups, it is the national market leader with a market share of about 30% in
machines and 55,4% in volume of capsules by June 2011 (Source: GfK data).
However, what shall be stressed out in this project is not the product/brand per se, but
the way the sales of Nescafé Dolce Gusto capsules are forecasted within Nestlé Portugal.
For a few months now, Nestlé Demand Planners have been trying to fit sophisticated
models with SAS forecast server6 in order to improve the demand plan and its two key performance indicators (KPIs): the Demand Plan Accuracy (DPA) and bias (please refer to
Appendix 1 for detailed information on these KPIs calculation).
The current results are already satisfactory, with DPAs over 50% (please refer to
Appendix 2 for historical information on “NDG” KPIs) but much potential can still be
extracted from this process, particularly when it comes to forecasting Nescafé Dolce Gusto
capsules’ sales given the actual data from the Nescafé Dolce Gusto machines’ sales. In
order to accomplish this task, data were collected and gathered so as to follow with a
regression analysis on these variables.
6“Software responsible for choosing automatically the most appropriate model, optimizing the model parameters and
Methodology
In order to build a statistical model that would help forecast coffee capsules’ sales using historical data, such as machines’ sales, some regressions were computed.
Past data from Nescafé Dolce Gusto capsules’ historical sales (provided by Nestlé) was gathered, since its inception, as well as Dolce Gustomachines’ sales. To enhance the model it was added historical data of the prices on the raw material coffee (Source: Eurostat) and
(in Euros) the investment made by Nestlé in Nescafé Dolce Gusto capsules promotion (data
provided by Nestlé).
These variables were considered as the most suitable ones since ultimately sales will be
driven by the price of capsules - given that the consumers are price sensitive – which is directed correlated to the price of its raw material such as coffee prices, and the promotion
that the company does to induce people to buy their products.
Although difficult to measure its impact it is expected that the more investment made by
Nestlé in promoting Dolce Gusto, higher will be the capsules’ sales.
However given the access limitation to past data of machines’ sales some assumptions were made. Regarding the Nescafé Dolce Gustomachines’ sales the only data available was that, until mid-2011, since the brand’s inception there had been sold approximately 250.000 machines and that the average market share had been approximately 30% for the previous
years. Also some consumer research studies suggest that people tend to buy more machines
during the first quarter of the year and especially in the last quarter given the Christmas
holidays and sales. Moreover, it is known that by 2009 it was sold in national territory
approximately 130.000 coffee machines and that sales increased about 60% (Source: Gfk
Taking into account the soaring
sales during the first and fourth
quarter of the month, it was assumed
that 30% of total sales were made
during the first quarter and 40%
during the fourth quarter (and then
both of them split per month). The remaining amount of sales was equally-weighted
through the other months.
With all the available data gathered a regression analysis was computed, including the
following variables: Independent Variables (monthly means) - Nescafé Dolce Gusto
machines’ sales (in units), Coffee (as raw material) Prices (in euros) and Nescafé Dolce
Gustocapsules’ investment on promotion (in Euros); Dependent Variable (monthly means)
–Nescafé Dolce Gustocapsules’ sales (in units).
Results
When attempting to forecast coffee capsules’ sales, resorting only to its coffee machines’ sales, even though at first the relationship between these two variables was providing an extremely low coefficient of determination ((R2)7 of approximately 2% (for detailed information on some of the regressions’ outputs please refer to Appendix 3:
Regression 1), when introducing a backward looking on the monthly coffee machines’ sales
data it enhanced the r-squared of the regression model to over than 42%.
7“
R2 represents the ratio of the explained variation compared to the total variation; thus it is interpreted as the fraction of the sample variation in the dependent variable that is explained by the independent variable. The value of R2 is always between zero and one.” (Jeffrey M. Wooldridge, 2006)
Table I - Nescafé Dolce Gusto machines' sales
Year Estimate Standard Error
2011 74.880 € (60% increase from 2009)
2010 46.800 € (20% increase from 2009)
2009 39.000 € (=30% market share * 130.000 machines)
2008 33.621 € (16% increase from 2008 to 2009)
(I) The enhanced regression model, using the method of Ordinary Least Squares (OLS) is
as follows in Equation I:
( NDG )
( NDG c ines sol )
Where “Nescafé Dolce Gusto capsules’ sales” (in units) represent the dependent variable, the units of Nescafé Dolce Gusto machines sold the independent variable and
the remaining unobserved factors (for detailed information on this regression’s output,
please refer to Appendix 3: Regression 2). It is important to highlight the R-squaredof
approximately 42%, and the output’s p-values8 that showed as statistically significant confirm the substantial relationship between these two variables.
The results obtained through the previous regression model are aligned with what was
expected, since capsules sales are directly related with all the coffee machines available in
the market.
Additionally, the backward looking regression (with lag of one period) illustrates the
fact that there isn’t an immediate increase on the consumption of capsules when the machines are sold but only on the following period.
Moreover, it should be accounted the use of the logarithmic function on both variables,
which caters for limiting the effects of “outliers” (extreme values of variables) throughout the regression model.
8
(II) When resorting to a single regression model, such as the latter one, one comes across
with one of the primary drawback of using only one explanatory variable which is the
distress of having to draw any type of conclusions, ceteris paribus, of how only one
variable x affects another variable y. To enhance the forecasting accuracy of the model it
was included more variables using a multiple regression model.
The parameters estimated were the number of Dolce Gusto machines sold, the
investment done on promoting the capsules and the historical prices of the raw material
coffee, which resulted into the regression model as follows in Equation II:
( )
( NDG machines sold ) ( )
( )
Where “Nescafé Dolce Gusto capsules’ sales” (in units) represents the dependent variable and the remaining variables correspond to the independent variables. For detailed
information on the regression’s output, please refer to Appendix 3: Regression 3.
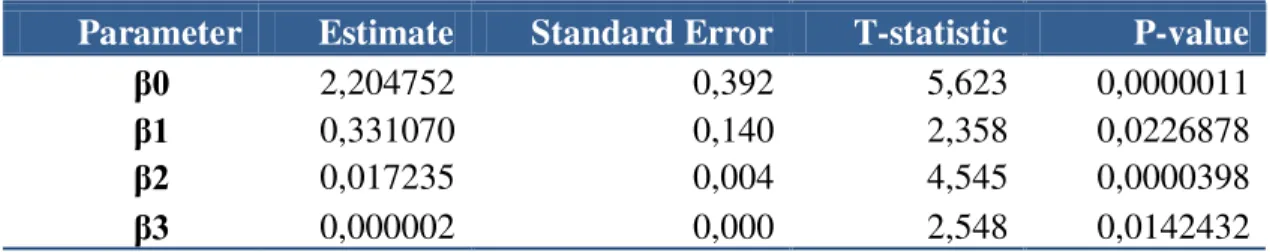
With an R-squared of approximately 64% the results of the regression are as follows in
Table II:
Table II - Ordinary Least Squared Estimators (Results)
Parameter Estimate Standard Error T-statistic P-value
β0 2,204752 0,392 5,623 0,0000011
β1 0,331070 0,140 2,358 0,0226878
β2 0,017235 0,004 4,545 0,0000398
Analyzing in detail each coefficient and each variable one can perceive that the number
of “NDG” capsules sold will increase by approximately 0,33% on average, ceteris paribus,
if the number of “NDG” machines in the previous period (represented by the coefficient
β1), increases by 1% unit.
Regarding the other two independent variables it is possible to identify that the number
of “NDG” capsules sold will increase by 1,72%, on average, ceteris paribus, if the price of the coffee two periods ago goes up 1 euro, while it will increase by 0,002%, on average,
ceteris paribus, if investment made on the previous period in capsules promotion increases
by 1 euro.
Furthermore when examining the overall regression model one can conclude that the
variables included are all statistically significant (with p-values quite below from the
standard confidence level of 5%), and that all of them help explain more than 60 percent of
the dependent variable, information provided by the analysis of the coefficient of
determination.
It should also be highlighted the importance of analyzing, not only the R2 per se, but also the adjusted R-squared.
The adjusted R-squared, as opposed to the R-squared, takes into account the number of
variables in a model, and may decrease if the number of variables increases. So, when
analyzing the adjusted R-squared of 61,5% although being smaller than the R-squared it
still shows the efficiency of the obtained regression model. This also happens because it
Following the regression analysis it is essential to understand how to relate the actual
values of Dolce Gusto capsules’ sales, with the ones provided by the obtained regression model.
Focusing on the year 2010 since, besides being one of the most recent years it is also the
one with all available data for each month. The main conclusions that can be withdrawn
from this analysis are as follows in Table III:
Table III: Deviations from actual and predicted values
(Nescafé Dolce Gusto capsules, in units)
Year % monthly average
absolute value/year
absolute value/month
2010 -20,66% 856.104 71.342
The results obtained from this comparison reflect the fact that the regression model is
forecasting lower values than the actual values (with a deviation of approximately 21%).
This should be expected, given that the variables included in the model do not completely
explain the dependent variable (R-squared is 64% and not 100%), and there may other
variables that could help explain such difference.
Also another fact that could help explain this deviation would be the fact that people do
not follow a trend path and some of them do buy by impulse and thus make it harder to
measure those consumers’ behavior.
Finally, there may have been a particular month during the year where capsules sales
were quite above from the trend, creating a deviation that will reflect on the average
deviations during the year. For detailed information on the monthly comparison analysis,
Conclusion
In the actual economic environment it is necessary to implement a disciplined, agile and
efficient business planning process to support the decision making process.
By increasing transparency, consistency and discipline in the Business Planning Process
the organization is not only in a position to identify gaps and react timely but creating a real
and competitive gap versus its competitors.
The Dynamic Planning Process, working a stress test of business plans, boosts speed to
decision making, creates visibility to what’s ahead and the range of possible outcomes, and
focuses on the most important drivers of business performance.
Furthermore, it is a process owned at local levels but with a clear alignment with
stakeholder/investors expectations and shareholder value creation, allowing for its
effectiveness and credibility.
When it comes to planning Supply Chain knowledge, this is more critical than ever,
especially when dealing with a multinational organization as Nestlé. So, all efforts that can
be done in order to improve the accuracy of demand planning and thus the efficiency of the
supply chain and the whole organization should not be ignored.
The main intention of this Work Project was to contribute with solutions that could be
taken to improve, not only the Nestlé’s Demand Plan Accuracy, but to help increase efficiency when trying to anticipate risks and opportunities on the overall Dynamic
For this purpose, it was computed a regression analysis on the Nescafé Dolce Gusto
capsules’ sales, so that a more accurate forecast could be drawn from the analysis. In order
to accomplish this there were taken into account three main variables that directly influence
coffee capsules’ sales: coffee machines’ sales, prices of the raw material coffee, and the
amount invested on the promotion of those capsules.
Through the obtained results it was possible to demonstrate that even though the chosen
variables explain most of the capsules’ sales, deviations on the actual and predicted values
reflect that there could be other variables to take into account and that could be relevant to
the model. Also, consideration must be taken on the consumers’ unpredicted behavior that does not necessarily react according to a certain path trend.
Though just a small contribution in the extended and complex area of business planning,
this Work Project endeavored to demonstrate that it is not enough to lean on past data and
hope that the actual results will turn out as expected, and it is not enough to take second
guesses as an escape plan. If the organization does anticipate its constraints and its needs
then it will provide more efficient resources reallocation, improved customer service, and
greater efficiency on planning. But, most of all, it will be enhancing value and the way it is
References
Books
Albert, Kenneth J. 1979. Handbook of Business Problem Solving. New York:
McGraw-Hill.
Chase, Charles. 2009. Demand-Driven Forecasting: a Structured Approach to
Forecasting. New Jersey: John Wiley & Sons, Inc.
Darwin, Charles. 2007. The Origin of the Species. London: Forgotten Books.
Hammer, Michael and James Champy. 2003. Reengineering the Corporation. New
York: Harper Paperbacks.
Kotler, Philip, Gary Armstrong and Peggy H. Cunningham. 2007. Principles of
Marketing. Toronto: Pearson Education Canada.
Lundholm, Russell and Richard Sloan. 2006. Equity Valuation and Analysis. Boston:
McGraw-Hill Irwin.
Madridakis, Spyros G. and Steven C. Wheelwright. 1987. The Handbook of Forec sting: A M n ger’s gui e. New York: John Wiley & Sons, Inc.
Wooldridge, Jeffrey M. 2006. Introductory Econometrics: a Modern Approach.
Michigan: South-Western College Pub.
Websites
Diário Económico. 2011. IBT, SA.
http://economico.sapo.pt/noticias/dolce-gusto-quer-entrar-em-380-mil-casas-este-ano_129131.html (accessed December, 2011).
Hipersuper. 2011. Workmedia.
http://www.hipersuper.pt/2011/05/02/entrevista-a-jorge-silva-marketing-manager-bebidas-nestle-portugal/ (accessed December 23, 2011). SAP. 2011. SAP AG. http://www.sap.com/corporate-en/our-company/index.epx
(accesed November 1, 2011).
Eurostat. 2011. http://epp.eurostat.ec.europa.eu/portal/page/portal/eurostat/home/
(accessed December 23, 2011).
Appendices
Appendix 1 - Formulas
Demand Plan Accuracy Formula:
( ) ( ( ) )
Bias Formula:
( ) ( ( ) )
Appendix 29 - Nescafé Dolce Gusto historical Demand Plan Accuracy
9
Appendix 3 – Regressions Outputs
Regression 1
Regression Output (Dependent Variable: log(Units of “NDG” Coffee Capsules sold in period t); Independent Variable: log(Units of “NDG” Coffee Machines sold in period t))
Regression 2
Regression 3
Regression Output (Dependent Variable: log(Units of “NDG” Coffee Capsules sold in period t); Independent Variables: log (Units of “NDG” Coffee Machines in period t-1) (Variable 1); Coffee Prices from period t-2 (Variable 2); Promotion from period t-1 (Variable 3)