Cross-cultural adaptation of the
“Australian National University
Alzheimer’s Disease Risk Index”
for the Brazilian population
Marcus Kiiti Borges
1, Alessandro Ferrari Jacinto
2, Vanessa de Albuquerque Citero
3ABSTRACT. Alzheimer’s disease (AD) represents a major public health problem and it is therefore crucial that modifiable risk factors be known prior to onset of dementia in late-life. The “Australian National University - Alzheimer’s Disease Risk Index” (ANU-ADRI) is one of the potential tools for primary prevention of the disease. Objective: The aim of this study was to devise an adapted version of the ANU-ADRI for use in Brazil. Methods: The instrument was translated from its original language of English into Portuguese and then back-translated into English by bilingual translators. It was subsequently reviewed and evaluated as to the degree of translation issues and equivalence. In this study, the ANU-ADRI was applied using individual (face-to-face) interviews in a public hospital, unlike the original version which is applied online by self-report. The final version (pretest) was evaluated in a sample of 10 participants with a mean age of 60 years (±11.46) and mean education of 11 years (±6.32). Results: The intraclass correlation coefficient (ICC) (inter-rater) was 0.954 (P<0.001 for a confidence interval (CI) of 95%=[0.932; 0.969]). Cultural equivalence was performed without the need for a second instrument application step. Conclusion: After cross-cultural adaptation, the language of the resultant questionnaire was deemed easily understandable by the Brazilian population.
Key words: Alzheimer’s disease, dementia, risk assessment, primary prevention, cross-cultural comparison.
ADAPTAÇÃO TRANSCULTURAL DO ÍNDICE DE RISCO DA DOENÇA DE ALZHEIMER DA “AUSTRALIAN NATIONAL UNIVERSITY” PARA A POPULAÇÃO BRASILEIRA
RESUMO. A doença de Alzheimer (DA) tem sido um grande problema de saúde pública, portanto é crucial que fatores de risco modificáveis possam ser conhecidos antes da instalação da demência na fase final da vida. O “Australian National
University - Índice de Risco da Doença de Alzheimer” (ANU-ADRI) é uma das ferramentas potenciais para a prevenção primária da doença. Objetivo: Este estudo teve como objetivo elaborar uma versão adaptada do ANU-ADRI para o uso no Brasil. Métodos: O instrumento foi traduzido do idioma original, inglês para a língua portuguesa e retrotraduzido para o inglês por tradutores bilíngues. Foi posteriormente revisado e avaliado quanto ao grau de dificuldade da tradução e equivalência. Neste estudo, o ANU-ADRI foi aplicado em entrevistas individuais (face a face) num hospital público em vez da versão original que é aplicada on-line por meio de autorrelato. A versão final (pré-teste) foi avaliada numa amostra de 10 participantes com média de idade 60 anos (±11,46), e média de escolaridade 11 anos (±6,32). Resultados: O coeficiente de correlação intraclasse entre os avaliadores foi 0,954 (P<0,001, intervalo de confiança de 95% IC=[0,932; 0,969]). A equivalência cultural foi realizada sem a necessidade de uma segunda etapa de aplicação do instrumento. Conclusão: Após a adaptação transcultural, a linguagem do questionário é descrita como de fácil compreensão pela população brasileira.
Palavras-chave: doença de Alzheimer, demência, medição de risco, prevenção primária, comparação transcultural.
This study was conducted at the Department of Psychiatry, Hospital do Idoso Zilda Arns de Curitiba, Curitiba, PR, Brazil.
1MScPsychiatrist, Master’s student, Postgraduate Program in Psychiatry, Escola Paulista de Medicina, Universidade Federal de São Paulo (EPM/UNIFESP), São
Paulo, SP, Brazil. 2MDGeriatrician, PhD Associate Professor, Department of Internal Medicine, Faculdade de Medicina de Botucatu, Universidade Estadual Paulista
Júlio de Mesquita Filho (UNESP), Botucatu, SP, Brazil. 3MDPsychiatrist, PhD Associate Professor, Department of Psychiatry, Escola Paulista de Medicina, Universidade
Federal de São Paulo (UNIFESP), São Paulo, SP, Brazil.
Marcus Kiiti Borges. Department of Psychiatry – Escola Paulista de Medicina, Universidade Federal de São Paulo (EPM/UNIFESP) – Rua Borges Lagoa, 570 / 9º andar – 04038-030 São Paulo SP – Brasil. E-mail: [email protected]
Disclosure: The authors report no conflicts of interest.
Received January 09, 2017. Accepted in final form April 11, 2017.
INTRODUCTION
A
lzheimer’s disease (AD) is one of the most
promi-nent public health issues. Around 8 million new
cases of dementia are diagnosed each year, with AD
being the most prevalent type.
1A recent meta-analysis
has shown that the global prevalence of this form of
dementia has doubled every 20 years in a number of
countries with aging populations.
2he estimated global
cost of the disease was US$ 604 billion in 2010, which is
comparable to the economic burden of cancer and
car-diovascular diseases.
3Multiple factors are associated with the risk of
developing AD.
4he lifetime risk factors for AD may
vary, with middle age representing a critical period for
changes in some of these factors.
5While a number of
clinical or lifestyle-related factors such as a low
edu-cational level (less than 12 years), diabetes,
hyperten-sion in middle age, obesity in middle age, depreshyperten-sion,
dyslipidemia, and smoking are modiiable, biological or
genetic factors such as age, gender, and apolipoprotein
(APOE)
ε
4 genotypes are not.
6he protective factors with stronger evidence are
cog-nitive activities or reserve, physical activity, and
engag-ing in other leisure activities that can stimulate social
and cognitive aspects.
7Known protective factors are:
Mediterranean diet (high in Omega-3 fatty acids) and
moderate alcohol consumption, both lifestyle-related.
8Focusing on the risk of AD as opposed to diagnosis,
the
Australian National University – Alzheimer’s Disease
Risk Index
(ANU-ADRI) could be used as one of several
primary prevention strategies.
9he original items of
the ANU-ADRI were developed in English, precluding
their use in other countries such as Brazil. hus, the
literature recommends the process of translation and
cross-cultural adaptation using rigorous and widely used
methods.
12Finally, there are no papers published on
cross-cul-tural adaptation of the ANU-ADRI for the Portuguese
language. he instrument has not yet been used in
spe-cialized Neurology, Geriatrics or Psychiatry outpatient
services or primary care (where patients are seen by
general practitioners), and its applicability in Brazil has
not yet been adequately assessed.Our objective in this
study to devise an adapted version of the ANU-ADRI for
use in Brazil.
METHODS
Ethical considerations.
Permission to translate and adapt
the instrument was granted by the researchers at the
Centre for Research on Ageing, Health and Wellbeing
(CRAHW) of the Australian National University (ANU)
and by Dr. Kaarin J. Anstey (Email: kaarin.anstey@anu.
edu.au). his research project was reviewed and approved
by the institutional review boards of the “
Universidade
Federal de São Paulo”
– UNIFESP and “
Escola Paulista de
Medicina”
– EPM (applying institution). Subsequently,
the “
Centro de Educação em Saúde”
(Health Education
Center) Research Ethics Committee of the Health
Depart-ment of Curitiba approved the project regarding the
feasibility of access to the research venue. he approved
research project is available on the “
Plataforma Brasil”
database (CAAE registry No. 38185614.5.1001.5505).
Design: cross-cultural adaptation study
Instruments.
A questionnaire was administered for
sociodemographic and clinical data collection, after
which the MMSE was applied for patient screening. he
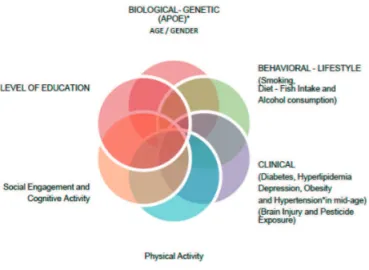
84-item ANU-ADRI was the principal questionnaire. he
Australian National University Alzheimer’s Disease Risk
Index (ANU-ADRI) is a self-report instrument to assess:
11 risk factors and 4 protective factors for Alzheimer’s
disease. hese factors are shown in Figure 1.
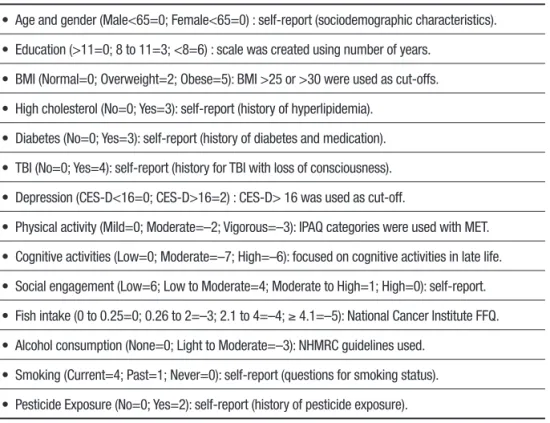
he total score was obtained by summing the scores
assigned by category to the risk or protective factors in
Table 1. In this study, the ANU-ADRI was administered
via individual face-to-face interviews as opposed to
applying the original online self-report version.
Participants.
A convenience sample comprised 10
patients selected from a public hospital in Curitiba,
Brazil, between July and August 2015. All participants
were aged >40 years with no evidence of severe or
disabling disease at the outpatient service of “Hospital
do Idoso Zilda Arns” (HIZA).
*not included in the ANU-ADRI Questionnaire
Table 1. Variables assessed and scores allocated to each factor on the ANU-ADRI (Anstey et al.10).
• Age and gender (Male<65=0; Female<65=0) : self-report (sociodemographic characteristics).
• Education (>11=0; 8 to 11=3; <8=6) : scale was created using number of years.
• BMI (Normal=0; Overweight=2; Obese=5): BMI >25 or >30 were used as cut-offs.
• High cholesterol (No=0; Yes=3): self-report (history of hyperlipidemia).
• Diabetes (No=0; Yes=3): self-report (history of diabetes and medication).
• TBI (No=0; Yes=4): self-report (history for TBI with loss of consciousness).
• Depression (CES-D<16=0; CES-D>16=2) : CES-D> 16 was used as cut-off.
• Physical activity (Mild=0; Moderate=–2; Vigorous=–3): IPAQ categories were used with MET.
• Cognitive activities (Low=0; Moderate=–7; High=–6): focused on cognitive activities in late life.
• Social engagement (Low=6; Low to Moderate=4; Moderate to High=1; High=0): self-report.
• Fish intake (0 to 0.25=0; 0.26 to 2=–3; 2.1 to 4=–4; ≥ 4.1=–5): National Cancer Institute FFQ.
• Alcohol consumption (None=0; Light to Moderate=–3): NHMRC guidelines used.
• Smoking (Current=4; Past=1; Never=0): self-report (questions for smoking status).
• Pesticide Exposure (No=0; Yes=2): self-report (history of pesticide exposure).
BMI: Body Mass Index; TBI: Traumatic Brain Injury; CES-D: Center for Epidemiology Scale for Depression; IPAQ: International Physical Activity Questionnaire; MET: Metabolic Equivalent; FFQ: Food Frequency Questionnaire; MHMRC: Australian National and Medical Research Council.
he exclusion criteria were a history of any severe
visual or hearing impairment or marked
psychomo-tor disability (e.g. parkinsonism); a hispsychomo-tory of severe
psychiatric or neurological disorders; severe clinical or
psychiatric disorders; dementia and/or below expected
score on the Mini-Mental State Examination (MMSE)
adjusted for level of education (cut-of scores: 20 for
illiterate persons; 25 for those with at least one year of
schooling).
11No patients were excluded from the study.
All patients were instructed as to the study goals and
provided written informed consent prior to instrument
evaluation.
Procedures.
he translation and cross-cultural
adapta-tion were standardized.
12he irst step was a forward
translation of the English version of the ANU-ADRI
instrument into Brazilian Portuguese by two bilingual
health professionals (DI and RNS), both of whom were
Brazilian, independent, and aware of the main goal of
the study. Translation focused on conceptual rather
than linguistic equivalence of the items. he
transla-tions were compared by an expert review committee
(two psychiatrists, MKB and VAC, and one geriatrician,
AFJ) and a consensus version was formulated from
these two translations.
In the next step, the consensus translation was
back-translated into English by a third bilingual
trans-lator – a native English speaker with proiciency in the
Portuguese language (ACD). Subsequently, this version
was compared with the original English language
instru-ment. he back-translation showed semantic
equiva-lence and consistency in the translated items.
he inal step consisted of ensuring cultural
equiva-lence and involved the same expert panel who
partici-pated in the semantic equivalence process. his step is
justiied by the fact that a word or statement used with
a given intent in the original context may not convey
the same meaning to the target population of the new
version. he expert committee reviewed the questions
with regard to content validity and prepared a summary
version for pretesting in order to assess the
acceptabil-ity and understanding of the instrument by the target
population. he aim of this step was to identify the
ques-tions that were not understood or not answered by the
target population. To that end, a “not applicable” answer
choice was included alongside each question. he
ANU-ADRI instrument was administered by ive trained
inter-viewers yielding data in the pretest phase.
the random luctuations noted for the same individual
interviewed on multiple occasions. Each patient was
assessed by a diferent interviewer in a random manner
(inter-rater).
Intraclass correlation coeicient (ICC) was the
spe-ciic method used to estimate inter-rater reliability, with
values around 1 indicating good agreement between
answers.
13ICC is deined as “the proportion of variance
of an observation due to between-subject variability in
true scores” and in order to ofset potential errors, a
95% conidence interval or standard error should be
adopted.
14he data were analyzed using the SPSS
ver-sion 20.0 statistical package.
RESULTS
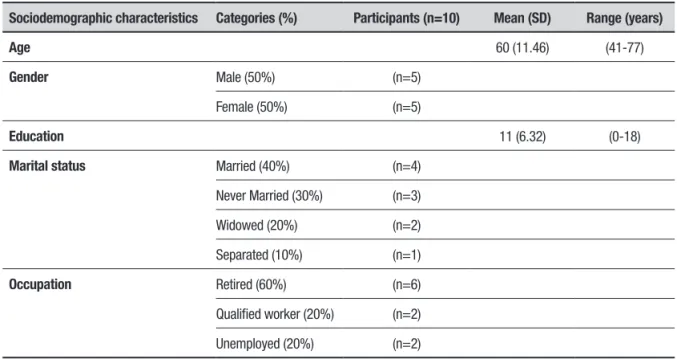
Table 2 shows the sociodemographic characteristics.
Mean pretest MMSE and ANU-ADRI scores of the
sample are given in Table 3.
Cross-cultural equivalence was achieved with no
need for a second step in the instrument evaluation
pro-cess. he intra-class correlation coeicient (inter-rater)
of the ANU-ADRI was 0.954 (
p<
0.001, 95% CI=[0.932;
0.969]).
Most of the individuals interviewed (90%) needed
the interviewer’s assistance to read the items concerning
“Physical Activity” and “Depression” domains, yet had
no diiculty choosing the answers. None of the 84
ques-tions were deemed “not applicable” by the respondents.
he mean time for administering the ANU-ADRI was
25 (±5) minutes. he inal adapted Portuguese version
can be found as
(Supplementary material).
DISCUSSION
he cross-cultural adaptation process is a complex task,
as it entails following a series of steps until functional
equivalence is achieved. he most adequate adapted
version for the older Brazilian population underwent
minor changes in the items concerning the Physical
Activity domain based on the International Physical
Activity Questionnaire (IPAQ) scale adapted for older
Brazilian individuals
15and validated for older women
16and men.
17Table 2. Sociodemographic characteristics of the sample.
Sociodemographic characteristics Categories (%) Participants (n=10) Mean (SD) Range (years)
Age 60 (11.46) (41-77)
Gender Male (50%) (n=5)
Female (50%) (n=5)
Education 11 (6.32) (0-18)
Marital status Married (40%) (n=4)
Never Married (30%) (n=3)
Widowed (20%) (n=2)
Separated (10%) (n=1)
Occupation Retired (60%) (n=6)
Qualified worker (20%) (n=2)
Unemployed (20%) (n=2)
SD: standard deviation.
Table 3. Mean pretest MMSE and ANU-ADRI scores.
Mean SD Minimum Maximum
MMSE 25.6 2.87 20 30
ANU-ADRI 6.3 13.8 –12 37
Cultural equivalence presupposes a literal match
between the original and adapted versions, and should
address the impact a term would have in the cultural
setting of the target population sample. he expressions
used in item 50 (“shoveling snow”) and item 60
(“dou-bles tennis”) of the source questionnaire were excluded
following cultural adaptation as they would not be as
meaningful in the adapted version for the Brazilian
pop-ulation. To allow the use of IPAQ-based questions for
older individuals, examples were included of activities
that are common for persons in this age group.
Other expressions from the Brazilian version of the
IPAQ validated for older men
16were included without
changing the original structure of the questionnaire –
for example, in items 52 (“limpar a garagem”), 54 (“lavar
roupas à mão, limpar o banheiro”), 58 (“remo,
canoa-gem, musculação ou esportes em geral”), and 60 (“jogar
bola, praticar hidroginástica, ginástica ou dança”).
It is important to know the particularities of the
sample considering the fact that respondents’ gender,
age group, and level of education could have inluenced
the performance of the instrument. Older adults with a
low educational level had more diiculty understanding
the items related to the “Depression” domain based on
the CES-D scale validated in Brazil
18compared to adults
with a higher level of education.
A randomized, controlled study including a sample
of middle-aged adults (mean age=55 years) with a high
educational level (mean=18 years of education) revealed
a lower mean ANU-ADRI score (–1.38) than that found
in our sample (6.3).
19he author of the cited study noted
that the ANU-ADRI should be tested in “target samples
with lower levels of education and higher ANU-ADRI
risk scores”.
In the present study, the mean administration time
was longer (25±5 minutes) than that of the original
ANU-ADRI, reported to be around 15±5 minutes. he
short version of the ANU-ADRI can be considered an
alternative whenever the original version is deemed too
lengthy or “not applicable” due to limitations in
admin-istration time.
20he assessment of older people via
questionnaires (either self-administered or in the form
of interviews) is a particularly diicult task due to the
inaccuracy of the information given and susceptibility to
recording or recall bias. In the present study, the
ANU-ADRI was administered using individual interviews
as opposed to the self-report approach of the original
online version. he original version, the short form and
the Portuguese version are available for printout from
the internet.
21In conclusion, after the cross-cultural adaptation
of the ANU-ADRI, the wording of the instrument was
found to be easily understandable by the Brazilian
population.
Furthermore, the inal adapted version can
facili-tate international cooperation projects that employ this
instrument.
In the near future, the authors of the present study
intend to publish the validity and test-retest reliability
of the ANU-ADRI with a larger sample (n=100) of
par-ticipants from the same institution in Brazil.
Author contribution.
Marcus Kiiti Borges and Vanessa de
Albuquerque Citero participated in the study design,
obtained the data and wrote the manuscript. Alessandro
Ferrari Jacinto revised the versions of the questionnaire
and the paper.
Acknowledgments.
We are grateful to the researchers
(Kim S, Anstey KJ) at the Centre for Research on
Ageing, Health and Wellbeing (CRAHW) of the
Austra-lian National University (ANU) for their cooperation
and, in particular, to Dr. Kaarin J. Anstey, for granting
permission to use the ANU-ADRI. Special thanks to the
bilingual translators (Ismael D, Souza RN, and Davis
AC) who contributed to the translation and
back-trans-lation of the questionnaire. Also, thanks are extended to
students (Paluch GD, Soares K, Ramos MJF, Adriazola
RN, Ramalho V), who assisted in the data collection.
REFERENCES
1. Alzheimer’s Disease International. The Global Impact of Dementia 2013-2050: Policy Brief for Heads of Government. 2013. Available from: http:// alz.co.uk/research/GlobalImpactDementia2013.pdf. Accessed in 2016 (Oct 28).
2. Prince M, Bryce R, Albanese E, Wimo A, Ribeiro W, Ferri CP. The global prevalence of dementia: a systematic review and metaanalysis. Alzheimers Dement. 2013;9(1):63-75.e2.
3. Wimo A, Jönsson L, Bond J, Prince M, Winblad B. The worldwide economic impact of dementia 2010. Alzheimers Dement. 2013;9:1-11. 4. Baumgart M, Snyder HM, Carrillo MC, Fazio S, Kim H, Johns H.
Summary of the evidence on modifiable risk factors for cognitive decline
and dementia: A population-based perpective. Alzheimers Dement. 2015;11:718-26.
5. Sindi S, Mangialasche F, Kivipelto M. Advances in the prevention of Alzheimer’s Disease. F1000 Prime Rep. 2015;12:7-50.
6. Deckers K, van Boxtel MP, Schiepers OJ, de Vugt M, Muñoz Sánchez JL, Anstey KJ, et al. Target risk factors for dementia prevention: a systematic review and Delphi Consensus study on the evidence from observational studies. Int J Geriatr Psychiatry. 2015;30(3):234-46. 7. Lopes OL, Becker JT, Kuller LH. Patterns of compensation and
8. Norton S, Mattheus FE, Barnes DE, Yaffe K, Brayne C. Potencial for primary prevention of Alzheimer’s disease: an analyses of population-based data. Lancet Neurol. 2014;13:788-94.
9. Anstey, KJ, Cherbuin, N, Herath, PM. Development of a new method for assessing global risk of Alzheimer’s Disease for use in population health approaches to prevention. Prev Sci. 2013;14:411-21.
10. Anstey, KJ, Cherbuin, N, Herath, PM, Qiu C, Kuller LH, Lopez OL, et al. A self-report risk index to predict occurrence of dementia in three inde-pendent cohorts of older adults: the ANU-ADRI. PLoS One 9(1): e86141. 11. Brucki, SMD, Nitrini, R, Bertolucci, PHF, Caramelli, P, Okamoto, IH. Sugestões para o uso do Mini-Exame do Estado Mental no Brasil. Arq Neuropsiquiatr. 2003;61:777-81.
12. Reichenheim, ME, Moraes, CL. Operationalizing the cross-cultural adap-tation of epidemiological measurement instruments. Rev Saúde Pública. 2007;41(4):665-73.
13. Walter, SD, Eliasziw, M, Donner, A. Sample size and optimal designs for reliability studies. Stat Med. 1998;17:101-10.
14. Gifford, D, Cummings, J. Evaluating dementia screening tests: Methodo-logic standards to rate their performance. Neurology. 1999;52(2):224-7. 15. Mazzo, CZ, Benedetti TRB. Adaptação do questionário internacional
de atividade física para idosos. Rev Bras Cineantropom Desempenho Hum. 2010;12(6):480-4.
16. Benedetti TRB, Mazo, GZ, Barros, MVG. Aplicação do questionário internacional de atividades físicas para avaliação do nível de atividades físicas de mulheres idosas: validade concorrente e reprodutibilidade teste-reteste. Rev Bras Ciênc Mov. 2004;12(1):25-34.
17. Benedetti TRB, Antunes PC, Rodriguez-Añez CR, Mazo GZ, Petroski EL. Reprodutibilidade e validade do questionário internacional de atividade física (IPAQ) em homens idosos. Rev Bras Med Esporte. 2007;13(1):11-6.
18. Silveira DX, Jorge MR. Propriedades psicométricas da escala de rastreamento populacional para depressão CES-D em população clínica e não clínica de adolescentes e adultos jovens. Rev Psiq Clín. 1998;25(5):251-61.
19. Anstey KJ, Bahar-Fuchs A, Herath P, Kim S, Burns R, Rebok GW, et al. Body brain life: A randomized controlled trial of an online dementia risk reduction intervention on middle-aged adults at risk of Alzheimer’s disease. Alzheimers Dement. 2015;1:72-80.
20. Kim S, Cherbuin N, Anstey KJ. Assessing reliability of short and tick forms of the ANU-ADRI: convenient alternatives of a self-report Alzheim-er’s disease risk assessment. Alzheimers Dement. 2016;2:93-8. 21. The Australian National University. Available from: http://anuadri.anu.edu.
SUPPLEMENTARY MATERIAL. BRAZILIAN PORTUGUESE VERSION OF THE ANU-ADRI QUESTIONNAIRE
Parte 1 – SOBRE VOCÊPrimeiro, gostaríamos de solicitar algumas informações básicas e história pessoal. Por gentileza, faça um círculo em volta das respostas apropriadas.
1. Quantos anos você completou no último aniversário? ___ Anos
2. Qual é a sua data de nascimento? ___ Ano
___ Mês
3. Qual é o seu sexo? 1 Masculino
2 Feminino
4. Qual a sua escolaridade? (escreva o número de anos em cada nível) ___ Ensino Fundamental
___ Ensino Médio
___ Escola Técnica
___ Universidade
___ Outros
5. Qual é o seu estado civil atual? 1 Casado(a)
2 União Estável
3 Separado(a)
4 Divorciado(a)
5 Viúvo(a)
6 Solteiro(a)
6. Pode nos informar sua altura? ___ Centímetros
9 Não sei
7. Qual o seu peso sem as roupas e sapatos? ___ Quilogramas
9 Não sei Parte 2 – SOBRE A SUA SAÚDE
Esta seção se refere aos seus problemas de saúde.
8. Você está ciente dos seus níveis de colesterol totais? (nos últimos 2 anos) ___ Colesterol Total
9. Nos últimos dois anos, algum médico ou outro profissional de saúde lhe disse que você tem colesterol alto?
1 Sim
2 Não
3 Não sei
10. Alguma vez um médico ou outro profissional de saúde lhe disse que você tem diabetes? 1 Sim
2 Não
3 Não sei
11. Alguma vez um médico ou outro profissional de saúde lhe disse que você tem níveis altos de açúcar no sangue ou na urina?
1 Sim
2 Não
3 Não sei ! SE A RESPOSTA FOR NÃO, PASSE PARA A QUESTÃO 13
12. Que tratamento para diabetes você está fazendo atualmente? 1 Insulina
2 Insulina e comprimidos
3 Comprimidos
4 Apenas dieta
5 Nenhum
6 Outro
13. Você já teve ferimentos na cabeça? 1 Sim
2 Não
! SE A RESPOSTA FOR NÃO, PASSE PARA A QUESTÃO 16
14. Considerando o ferimento mais grave que você teve na cabeça, você chegou a perder a consciência?
1 Sim
2 Não
3 Não sei
15. Em caso afirmativo, por quanto tempo você ficou inconsciente? 1 0-15 minutos
2 15-30 minutos
3 30 minutos a uma hora
4 Horas
5 Dias
6 Não sei
16. Alguma vez um médico ou outro profissional de saúde lhe disse que você tem depressão? 1 Sim
2 Não
3 Não sei
As próximas perguntas são sobre seus sentimentos. Para cada uma das afirmativas abaixo, pedimos que informe se você se sentiu assim durante a semana que passou.
As alternativas são:
0 Raramente ou em nenhum momento (menos de um dia) 1 Por algum tempo ou um curto período (1-2 dias)
2 Ocasionalmente ou por um período razoável de tempo (3-4 dias) 3 A maior parte ou todo o tempo (5-7 dias)
Faça um círculo em volta da melhor resposta para cada pergunta.
Menos de 1 dia
1-2 dias
3-4 dias
5-7 dias
17. Senti-me incomodado com coisas que habitualmente não me
incomodam. 0 1 2 3
18. Não tive vontade de comer, tive pouco apetite. 0 1 2 3
19. Senti não conseguir melhorar meu estado de ânimo mesmo com a
ajuda de familiares e amigos. 0 1 2 3
20. Senti-me tendo tanto valor quanto outras pessoas. 0 1 2 3
21. Senti dificuldade em me concentrar no que estava fazendo. 0 1 2 3
22. Senti-me deprimido. 0 1 2 3
23. Senti que tive de fazer esforço para dar conta das minhas tarefas
habituais. 0 1 2 3
24. Senti-me otimista com relação ao futuro. 0 1 2 3
25. Considerei que minha vida tinha sido um fracasso. 0 1 2 3
26. Senti-me amedrontado. 0 1 2 3
27. Meu sono não foi repousante. 0 1 2 3
28. Estive feliz. 0 1 2 3
29. Falei menos do que o habitual. 0 1 2 3
30. Senti-me sozinho. 0 1 2 3
31. As pessoas não foram amistosas comigo. 0 1 2 3
32. Aproveitei a minha vida. 0 1 2 3
33. Tive crises de choro. 0 1 2 3
34. Senti-me triste. 0 1 2 3
35. Eu senti que as pessoas não gostavam de mim. 0 1 2 3
Parte 3 – SOBRE A SUA ATIVIDADE
As próximas perguntas referem-se ao tempo em que você esteve fisicamente ativo(a) nos últimos 7 dias.
Pense em todas as atividades vigorosas e moderadas que você fez na semana que passou. Atividades físicas vigorosas são aquelas que exigem bastante esforço físico e fazem você respirar muito mais rápido que o normal. Atividades moderadas são aquelas que exigem esforço físico moderado e fazem você respirar um pouco mais rápido que o normal.
PARTE 3a: ATIVIDADE FÍSICA NO TRABALHO
A primeira seção é sobre o seu trabalho. Ela inclui serviços remunerados, atividades agrícolas, trabalho voluntário, atividades nos estudos e qualquer outro trabalho não remunerado que você fez fora de casa. Não inclua trabalho não remunerado que você faz em casa, como tarefas domésticas, cuidar do quintal, manutenção geral da casa e cuidar da família.
37. Atualmente, você tem um trabalho remunerado ou faz algum trabalho voluntário fora de casa? 1 Sim
2 Não
! SE A RESPOSTA FOR NÃO, PASSE PARA A PARTE 3b - TRANSPORTE
As próximas perguntas são sobre toda a atividade física que você fez na última semana como parte do seu trabalho, remunerado ou não. Isso não inclui as idas e vindas do trabalho.
38. Em quantos dias da última semana você praticou atividades físicas vigorosas como erguer grandes pesos, cavar, trabalhar em obras ou subir escadas como parte do seu trabalho? Considere apenas as atividades físicas que você fez por pelo menos 10 minutos seguidos.
___ Dias por semana
0 Nenhuma atividade vigorosa no trabalho
! SE NÃO REALIZOU ATIVIDADE VIGOROSA, PASSE PARA A QUESTÃO 40
39. Nos dias em que você fez atividades físicas vigorosas como parte do seu trabalho, quanto tempo você gastou nessas atividades, em geral?
___ Horas por dia
___ Minutos por dia
40. Considere mais uma vez apenas as atividades físicas que você praticou por pelo menos 10 minutos seguidos. Em quantos dias da última semana você praticou atividades físicas moderadas, tais como carregar pesos leves, como parte do seu trabalho? Não inclua caminhadas.
___ Dias por semana
0 Nenhuma atividade física moderada no trabalho
! SE NÃO REALIZOU ATIVIDADE FÍSICA MODERADA, PASSE PARA A QUESTÃO 42
41. Nos dias em que você fez atividades físicas moderadas como parte do seu trabalho, quanto tempo você gastou nessas atividades, em geral?
___ Horas por dia
___ Minutos por dia
42. Em quantos dias da última semana você caminhou por pelo menos 10 minutos seguidos como parte do seu trabalho? Não inclua caminhadas para ir ou voltar do trabalho.
___ Dias por semana
0 Nenhuma caminhada
! SE VOCÊ NÃO CAMINHOU, PASSE PARA A QUESTÃO 44
43. Nos dias em que você caminhou como parte do seu trabalho, quanto tempo você gastou caminhando, em geral?
___ Horas por dia
___ Minutos por dia PARTE 3b: ATIVIDADE FÍSICA NO TRANSPORTE
Estas perguntas se referem a como você se deslocou de um lugar para outro, incluindo locais como: trabalho, lojas, cinema, supermercado, etc.
44. Em quantos dias da última semana você usou um veículo motorizado, como carro, ônibus, metrô, trem ou outro, como meio de transporte?
___ Dias por semana
0 Nenhum deslocamento em veículo motorizado
! SE NÃO USOU TRANSPORTE MOTORIZADO, PASSE PARA A QUESTÃO 46
45. Nos dias em que você se deslocou usando carro, ônibus, metrô, trem ou outro tipo de veículo motorizado, quanto tempo você gastou nesse deslocamento?
___ Horas por dia
___ Minutos por dia
46. Em quantos dias da última semana você pedalou por pelo menos 10 minutos seguidos para ir de um lugar para outro?
___ Dias por semana
0 Nenhum uso de bicicleta
! SE NÃO USOU BICICLETA, PASSE PARA A QUESTÃO 48
47. Em geral, quanto tempo você gastou em um desses dias para ir de bicicleta de um lugar para outro?
___ Horas por dia
___ Minutos por dia
48. Em quantos dias da última semana você caminhou por pelo menos 10 minutos seguidos para se deslocar de um lugar para outro?
___ Dias por semana
0 Nenhuma caminhada
49. Em geral, quanto tempo você gastou em um desses dias em que caminhou de um lugar para outro?
___ Horas por dia
___ Minutos por dia PARTE 3c: TAREFAS DOMÉSTICAS, MANUTENÇÃO DA CASA E CUIDADOS COM A FAMÍLIA
Esta seção se refere a algumas das atividades físicas que você pode ter realizado em sua casa nos últimos 7 dias, tais como tarefas domésticas, jardinagem, trabalhar no quintal, fazer trabalhos gerais de manutenção da casa e cuidar da família.
50. Considere mais uma vez apenas as atividades físicas que você fez por pelo menos 10 minutos seguidos. Em quantos dias da última semana você realizou atividades físicas vigorosas como erguer grandes pesos, cortar lenha ou cavar no jardim ou quintal?
___ Dias por semana
0 Nenhuma atividade vigorosa
! SE NÃO FEZ ATIVIDADE VIGOROSA, PASSE PARA A QUESTÃO 52
51. Nos dias em que você fez atividades físicas vigorosas no jardim ou quintal, quanto tempo você gastou, em geral, nessas atividades?
___ Horas por dia
___ Minutos por dia
52. Considere mais uma vez apenas as atividades físicas que você realizou por pelo menos 10 minutos seguidos. Em quantos dias da última semana você fez atividades moderadas, tais como carregar pesos leves, limpar a garagem e limpar o jardim ou quintal?
___ Dias por semana
0 Nenhuma atividade moderada
53. Nos dias em que você realizou atividades físicas moderadas no jardim ou quintal, quanto tempo você gastou, em geral, nessas atividades?
___ Horas por dia
___ Minutos por dia
54. Considere mais uma vez apenas as atividades físicas que você realizou por pelo menos 10 minutos seguidos. Em quantos dias da última semana você realizou atividades moderadas, tais como limpar vidros ou janelas, lavar roupas à mão, limpar banheiro, esfregar ou varrer o chão dentro de sua casa?
___ Dias por semana
0 Nenhuma atividade moderada
! SE NÃO REALIZOU ATIVIDADE MODERADA, PASSE PARA A QUESTÃO 56
55. Nos dias em que você realizou atividades físicas moderadas dentro de casa, quanto tempo você gastou, em geral, nessas atividades?
___ Horas por dia
___ Minutos por dia PARTE 3d: RECREAÇÃO, ESPORTE e ATIVIDADE FÍSICA COMO LAZER
Esta seção é sobre todas as atividades físicas que você fez nos últimos 7 dias apenas para recreação, esporte, exercício ou lazer. Não inclua atividades que você já mencionou.
56. Sem contar as caminhadas que você já mencionou, em quantos dias da última semana você caminhou por pelo menos 10 minutos seguidos nas suas horas de lazer?
___ Dias por semana
0 Nenhuma caminhada
! SE NÃO CAMINHOU, PASSE PARA A QUESTÃO 58
57. Nos dias em que você caminhou nas suas horas de lazer, quanto tempo você gastou, em geral, nessa atividade?
___ Horas por dia
___ Minutos por dia
58. Considere mais uma vez apenas as atividades físicas que você realizou por pelo menos 10 minutos seguidos. Em quantos dias da última semana você realizou atividades físicas vigorosas como exercícios aeróbicos (corrida, pedalar ou nadar em ritmo acelerado, canoagem, remo, musculação ou esportes em geral) nas suas horas de lazer?
___ Dias por semana
0 Nenhuma atividade vigorosa
! SE NÃO REALIZOU ATIVIDADE VIGOROSA, PASSE PARA A QUESTÃO 60
59. Nos dias em que você realizou atividades físicas vigorosas nas suas horas de lazer, quanto tempo você gastou, em geral, nessas atividades?
___ Horas por dia
___ Minutos por dia
60. Considere mais uma vez apenas as atividades físicas que você realizou por pelo menos 10 minutos seguidos. Em quantos dias da última semana você realizou atividades físicas moderadas como pedalar ou nadar num ritmo regular ou jogar bola, praticar hidroginástica, ginástica ou dança nas suas horas de lazer?
___ Dias por semana
0 Nenhuma atividade moderada
! SE NÃO REALIZOU ATIVIDADE MODERADA, PASSE PARA A QUESTÃO 62
61. Nos dias em que você realizou atividades físicas moderadas nas suas horas de lazer, quanto tempo você gastou, em geral, nessas atividades?
___ Horas por dia
Parte 4 – SOBRE SUAS HORAS DE LAZER
As perguntas seguintes serão sobre suas atividades de lazer.
62. Aproximadamente quanto tempo você passa lendo diariamente, incluindo leituras online? 1 Nenhum
2 Menos de uma hora
3 De uma até menos de duas horas
4 De duas a menos de três horas
5 Três ou mais horas
9 Não sei
63. Considerando o último ano, com que frequência você leu jornais, inclusive online? 5 Todos os dias, ou quase todos os dias 4 Várias vezes por semana
3 Várias vezes por mês
2 Várias vezes por ano
1 Uma vez por ano ou menos
9 Não sei
64. Durante o último ano, com que frequência você leu revistas, inclusive online? 5 Todos os dias, ou quase todos os dias 4 Várias vezes por semana
3 Várias vezes por mês
2 Várias vezes por ano
1 Uma vez por ano ou menos
9 Não sei
65. Durante o último ano, com que frequência você leu livros? 5 Todos os dias, ou quase todos os dias
4 Várias vezes por semana
3 Várias vezes por mês
2 Várias vezes por ano
1 Uma vez por ano ou menos
9 Não sei
66. Durante o último ano, com que frequência você jogou damas ou outros jogos de tabuleiro, cartas, fez quebra-cabeças, jogos de palavras, desafios, ou qualquer outro jogo semelhante? (incluindo jogos online)
5 Todos os dias, ou quase todos os dias
4 Várias vezes por semana
3 Várias vezes por mês
2 Várias vezes por ano
1 Uma vez por ano ou menos
9 Não sei
67. Durante o último ano, com que frequência você fez atividades para exercitar o cérebro? 5 Todos os dias, ou quase todos os dias
4 Várias vezes por semana
3 Várias vezes por mês
2 Várias vezes por ano
1 Uma vez por ano ou menos
9 Não sei
68. Durante o último ano, com que frequência você escreveu cartas ou e-mails? 5 Todos os dias, ou quase todos os dias 4 Várias vezes por semana
3 Várias vezes por mês
2 Várias vezes por ano
1 Uma vez por ano ou menos
69. Durante o último ano, com que frequência você usou redes sociais como o Facebook ou
Twitter?
5 Todos os dias, ou quase todos os dias
4 Várias vezes por semana
3 Várias vezes por mês
2 Várias vezes por ano
1 Uma vez por ano ou menos
9 Não sei
70. No último ano, quantas vezes você visitou um museu? 5 Todos os dias, ou quase todos os dias
4 Várias vezes por semana
3 Várias vezes por mês
2 Várias vezes por ano
1 Uma vez por ano ou menos
9 Não sei
71. No último ano, quantas vezes você assistiu a um concerto, peça teatral ou musical? 5 Todos os dias, ou quase todos os dias
4 Várias vezes por semana
3 Várias vezes por mês
2 Várias vezes por ano
1 Uma vez por ano ou menos
9 Não sei
72. No último ano, com que frequência você foi à biblioteca? 5 Todos os dias, ou quase todos os dias
4 Várias vezes por semana
3 Várias vezes por mês
2 Várias vezes por ano
1 Uma vez por ano ou menos
9 Não sei Parte 5 – SOBRE OS SEUS AMIGOS E FAMÍLIA
Gostaríamos de saber sobre seus amigos e parentes.
Considerando todos os seus amigos, incluindo os que moram na vizinhança:
73. Quantos de seus amigos e parentes você vê ou tem notícia no mínimo uma vez por mês? 1 Nenhum
2 Um
3 Dois
4 Três ou quatro
5 Cinco a oito
6 Nove ou mais
74. Você está satisfeito(a) com suas relações com amigos e parentes? 0 Sim
1 Não
75. Com que frequência você participa de cerimônias religiosas ou grupos sociais, políticos ou comunitários?
0 Menos do que uma vez na semana
1 Uma vez na semana ou mais vezes
76. Você mora sozinho(a) ou com outras pessoas? 0 Moro sozinho(a) ou com esposo(a)
Parte 6 – SOBRE SUA COMIDA, BEBIDA e HÁBITOS
Nos últimos 12 meses:
77. Com que frequência você comeu peixe ou frutos do mar defumados (tais como salmão, ostras, truta ou outros)?
1 Nunca
2 1-6 vezes por ano
3 7-11 vezes por ano
4 1 vez por mês
5 2-3 vezes por mês
6 Uma vez por semana
7 Duas vezes por semana
8 3-4 vezes por semana
9 5-6 vezes por semana
10 Uma vez por dia
11 Duas ou mais vezes por dia
78. Com que frequência você comeu sushi ou sashimi (contendo peixe cru ou frutos do mar, inclusive mariscos)?
1 Nunca
2 1-6 vezes por ano
3 7-11 vezes por ano
4 1 vez por mês
5 2-3 vezes por mês
6 Uma vez por semana
7 Duas vezes por semana
8 3-4 vezes por semana
9 5-6 vezes por semana
10 Uma vez por dia
11 Duas ou mais vezes por dia
79. Com que frequência você comeu ostras cruas, mariscos crus ou outro tipo de peixe cru (sem contar o peixe cru no sushi)?
1 Nunca
2 1-6 vezes por ano
3 7-11 vezes por ano
4 1 vez por mês
5 2-3 vezes por mês
6 Uma vez por semana
7 Duas vezes por semana
8 3-4 vezes por semana
9 5-6 vezes por semana
10 Uma vez por dia
11 Duas ou mais vezes por dia
80. Com que frequência você comeu todos os outros tipos de peixe ou frutos do mar (incluindo mariscos) de outra forma que não fritos, defumados ou crus?
1 Nunca
2 1-6 vezes por ano
3 7-11 vezes por ano
4 1 vez por mês
5 2-3 vezes por mês
6 Uma vez por semana
7 Duas vezes por semana
8 3-4 vezes por semana
9 5-6 vezes por semana
10 Uma vez por dia
As próximas perguntas tratam de seu consumo de álcool. Exemplos de dose-padrão:
Vinho Espumante 100ml
Vinho 100ml
Cerveja “light” 425ml
Cerveja normal 285ml
Vinho fortificado 60ml
Bebidas destiladas 30ml
81. Com que frequência você ingere bebida alcoólica? 0 Nunca
1 Uma vez ao mês ou menos
2 2-4 vezes ao mês
3 2-3 vezes na semana
4 4 ou mais vezes na semana
! SE NÃO INGERE ÁLCOOL, PASSE PARA A QUESTÃO 83
82. Quantas doses de bebida você consome num dia típico quando está bebendo? 0 1-2
1 3-4
2 5-6
3 7-9
4 10 ou mais
A pergunta seguinte é sobre o uso de tabaco ou produtos com nicotina.
83. Você fuma ou fumou cigarros, charutos, cachimbo ou outros produtos do tabaco? 1 Sim, atualmente
2 Sim, não atualmente
3 Nunca
A próxima pergunta se refere à sua exposição a toxinas.
84. Você já participou da mistura, aplicação ou carregamento de pesticidas, herbicidas, fumegantes ou fungicidas?
1 Sim
2 Não
8 Recuso-me a responder