○ ○ ○ ○ ○ ○ ○ ○ ○ ○ ○ ○
ABSTRACT
○ ○ ○ ○ ○ ○ ○R
eview Ar
ticle
○ ○ ○ ○ ○ ○ ○ ○ ○ ○ ○ ○ ○ ○ ○ ○ ○ ○ ○ ○
Introduction
The basic principles of magnetic
reso-nance have been known since the 1940s, but
due to technical difficulties the first imaging
of the human body via magnetic resonance
was only achieved at the beginning of the
1980s. In contrast, between the development
of the principles of x-rays and the first images
produced by that method there was a time
interval of only four months.
1Magnetic resonance imaging is an
excel-lent method for anatomical and structural
di-agnosis of the brain, but it does not provide
functional or metabolic information. At the
beginning of the 1990s, one of the options
for assessing the metabolic and functional
ac-tivity of the brain was positron emission
tom-ography or functional magnetic resonance
(diffusion, perfusion and spectroscopy),
2,3which was used mainly in research institutes.
The equipment necessary for this purpose was
expensive and inaccessible for most medical
centers of the world and still is, in the case of
positron emission tomography.
In the mid-1990s, however, the
devel-opment of computer software for
spectros-copy coupled to the previously existing
magnetic resonance equipment contributed
towards reducing prices. For this reason, the
clinical use of spectroscopy using
in vivo
magnetic resonance has become routine in
many hospitals.
4Magnetic resonance spectroscopy
Magnetic resonance spectroscopy is used
to detect the metabolic and biochemical
pro-file of brain areas.
4Several chemical elements
• Antonio Ronaldo Spotti
spectroscopy: clinical
applications in patients
with brain lesions
Department of Neurological Sciences, Faculdade de Medicina de São José
do Rio Preto, São José do Rio Preto, São Paulo, Brazil
CONTEXT: Proton spectroscopy has been recognized as a safe and noninvasive diagnostic method that, coupled with magnetic resonance imaging tech-niques, allows for the correlation of anatomical and physiological changes in the metabolic and biochemical processes occurring within previously-determined volumes in the brain. There are two methods of proton magnetic resonance spectros-copy: single voxel and chemical shift imaging
OBJECTIVE: The present work focused on the clinical applications of proton magnetic resonance spectroscopy in patients with brain lesions.
CONCLUSIONS: In vivo proton spectroscopy allows the detection of certain metabolites in brain tissue, such as N-acetyl aspartate, creatine, choline, myoinositol, amino acids and lipids, among oth-ers. N-acetyl aspartate is a neuronal marker and, as such, its concentration will decrease in the pres-ence of aggression to the brain. Choline increase is the main indicator of neoplastic diseases. Myoinositol is raised in patients with Alzheimer’s disease. Amino acids are encountered in brain abscesses. The presence of lipids is related to necrotic processes.
KEY WORDS: Proton. Spectroscopy. Magnetic reso-nance. Brain.
can be used to obtain magnetic resonance
spectroscopy such as phosphorus,
5-7carbon
8,9and hydrogen.
10The first
in vivo
magnetic resonance
spectroscopy was performed at the beginning
of the 1980s and was done using resonance of
the phosphorus nucleus (
31P), thereby
reveal-ing the energy metabolism of the tissue cells
studied.
7However, this method had the
dis-advantages of low magnetic sensitivity, low
concentration of
31P atoms and also
inad-equate spatial resolution in focal brain lesions
with small and mild dimensions,
7and it has
been replaced by proton (hydrogen)
spec-troscopy, especially in brain studies.
10Proton (
1H) resonance is nowadays the
method most frequently used in
neuros-pectroscopy, because hydrogen is the most
abundant atom in the human body and its
nucleus emits the most intense
radio-frequency signal, when in an external
mag-netic field, in relation to other nuclei.
10Moreover, proton magnetic resonance
spectroscopy is more quickly accomplished
and easily interpreted.
In vivo
proton magnetic
resonance spectroscopy
In 1989, Frahm et al
.
11,12published the first
reports of
in vivo
proton magnetic resonance
spectroscopy, describing the methodology used
in the detection and measurement of metabolite
concentrations in the human brain.
corre-lation of anatomical and physiological
changes in the metabolic and biochemical
processes occurring within
previously-deter-mined volumes in the brain.
13Proton magnetic resonance spectroscopy
of the brain is useful whenever biochemical
or metabolic assessment may be necessary,
such as in differential diagnosis of focal brain
lesions (neoplastic and non-neoplastic
dis-eases);
14-20brain lesions in patients with
ac-quired immunodeficiency syndrome;
21-23di-agnosis of dementia
24-26and other
degenera-tive diseases;
27follow-up radiation therapy for
patients with brain neoplasms;
28-30demyelinat-ing diseases such as multiple sclerosis
31-33and
leukodystrophy;
6,34diagnosis and prognosis of
brain ischemic
35,36and traumatic lesions;
37-42assessment of epilepsy;
43-45biochemical
altera-tions in hepatic encephalopathies;
46,47and
neuropediatric affections such as brain tumors,
inborn errors of metabolism and hypoxic
en-cephalopathy.
48-50Magnetic resonance examinations,
includ-ing spectroscopy, are absolutely
contraindi-cated in patients with heart pacemakers or
other electronic appliances implanted in the
body, and those with steel clips in brain
aneu-rysms. Individuals with claustrophobia and
children need sedation.
51Techniques
There are two methods of proton
mag-netic resonance spectroscopy: single voxel and
multivoxel, with or without spectroscopic
imaging. Single voxel proton magnetic
reso-nance spectroscopy provides a rapid
biochemi-cal profile of a lobiochemi-calized volume within a
re-gion of interest that may be determined,
es-pecially in brain studies.
4,16,52,53Spectroscopic
imaging provides biochemical information
about multiple, small and contiguous volumes
focalized on a particular region of interest that
may allow the mapping of metabolic tissue
distribution. By using this method, the data
obtained may be manipulated by computer
and superimposed on the image of an
abnor-mality, thereby illustrating the distribution of
such metabolites within that area.
54-56The two localization methods commonly
used in clinical proton magnetic resonance
spectroscopy are PRESS (point-resolved
spectroscopy) and STEAM (stimulated echo
acquisition mode). Both methods stimulate
protons within the volume of interest with
minimal stimulation outside of this
vol-ume.
11,13,36,52,57-61Another essential variable in the
acquisi-tion of proton magnetic resonance
spec-troscopy is the choice of echo time. With short
echo times (less than 30 milliseconds), the
magnetic resonance spectrum detects larger
numbers of metabolites, but it is more likely
that peak superimposition will occur, thereby
causing difficulty in spectroscopic curve
in-terpretation. Short echo times are indicated
for the study of metabolic and diffuse
dis-eases.
52By using long echo times (more than
135 milliseconds), smaller numbers of
metabolites are detected, but with better
defi-nition of peaks, thereby facilitating graphic
analysis. Long echo times are more used in
focal brain lesions.
62Metabolites: localization and importance
In vivo
proton magnetic resonance
spectroscopy allows the presence of certain
metabolites in brain tissue to be detected if
the minimum concentrations are between 0.5
and 1.0 mM.
6Some of these present clinical
importance,
25,48,49,63-72such as:
1. N-acetyl aspartate (Naa) – this is a
neu-ronal marker that is present in neuron
bodies and axons, and indicates their
den-sity and viability. Its production takes
place in the mitochondria of brain tissue.
Because of these factors, the Naa peak in
proton spectroscopy will be decreased
whenever there is neuron loss, such as in
glioma, ischemia and degenerative
dis-eases. Naa presence resonates at 2.02 parts
per million (ppm)
2. Creatine (Cr) – this is a marker of the
aerobic energy metabolism of the brain
cells, and is present in larger
concentra-tions in the gray matter than in the white.
The creatine peak is practically constant
and may be used as a control value in
re-lation to other metabolites. Creatine
phos-phate also contributes to the Cr peak.
Occasionally, a reduction in the Cr peak
occurs in brain tumors, mainly in
metastases. The peak for Cr is seen at 3.02
ppm; however, an additional peak for
crea-tine may be visible at 3.94 ppm
3. Choline (Cho) – this is a constituent
molecule of the phospholipid metabolism
of cell membranes and reflects membrane
turnover. Its concentration is slightly
greater in white matter than in gray
mat-ter. Increased choline indicates greater
membrane synthesis and cell proliferation.
Its concentration is normally greatly
in-creased in cases of brain neoplastic
expan-sible processes. Phosphocholine and
glycerophosphocholine also contribute to
the representation of the Cho peak, which
occurs at 3.2 ppm
4. Lactate – this is not commonly detected
in proton spectroscopy of brain tissue. Its
presence indicates a pathological
condi-tion with regard to the final products of
anaerobic metabolism. Lactate can be
identified in cysts, hypoxic/ischemic
tis-sues and some neoplasms. It is visible as
an inverted double peak on the
spectroscopic curve (echo time of 136 ms)
at 1.33 ppm
5. Lipids – these metabolites are usually not
detected by proton magnetic resonance
spectroscopy, either. In pathological
situ-ations in which necrosis occurs, such as
in malignant neoplasms and
inflamma-tory/infectious processes, there is an
ac-centuated lipid peak, signifying cell
mem-brane degradation. This peak is located
at 0.9 and 1.3 ppm
6. Myoinositol – this is considered to be a
glial function marker, and it is an
impor-tant osmotic agent regulator for cell
vol-ume. It generally presents reduction in
hepatic encephalopathy and elevation in
Alzheimer’s disease. The myoinositol peak
occurs at 3.56 ppm.
In pathological cases, other metabolites
that can be detected via proton magnetic
reso-nance spectroscopy include the following
amino acids: a) alanine, as an inverted double
peak in meningiomas and brain abscesses (at
1.48 ppm with an echo time of 136 ms); b)
acetates and succinates in abscesses and
neurocysticercosis (at 1.92 and 2.4 ppm,
re-spectively); and c) cytosols in abscesses (at
0.9 ppm).
Interpretation of the spectroscopic curve
The spectrum represents radiofrequency
signals emitted from the proton nuclei of the
different metabolites into the region of
inter-est. Specific metabolites always appear at the
same frequencies, expressed as parts per
mil-lion, and are represented on the horizontal axis
of the graph. The vertical axis shows the
heights of the metabolite peaks, represented
on an arbitrary intensity scale. Figure 1 shows
proton spectroscopic curves for the magnetic
resonance of normal brain tissue, with the
N-acetyl aspartate, creatine and choline peaks.
R
eview Ar
ticle
Main clinical applications
Brain tumors
Proton magnetic resonance spectroscopy
is a very sensitive method for detecting brain
tumors. Decreased intensity of the N-acetyl
aspartate peak and increased choline occur in
gliomas (Figure 2).
25Lactate peaks may be
found in such tumors, independent of their
malignancy grade,
33,53thereby indicating
hy-poxia. There is controversy regarding the
ca-pacity of proton spectroscopy to distinguish
between different histological grades of
glio-mas; however, the detection of lipids is
typi-cal of multiform glioblastoma, i.e. tissue
necro-sis.
14When the image obtained by magnetic
resonance does not succeed in differentiating
glioma from infection, the proton magnetic
resonance spectroscopy is useful, because in
neoplastic processes there is a remarkable
in-crease in the choline peak.
73,74Moreover, this
method is important in monitoring responses
to the treatment of gliomas.
75Although the diagnosis of meningioma is
easily done by means of magnetic resonance
imaging, proton magnetic resonance
spectroscopy may be useful in atypical cases.
Figure 1. Normal brain curve from proton magnetic resonance spectroscopy of the brain, showing peaks of the metabolites
N-acetyl aspartate (Naa), creatine (Cr) and choline (Cho), with echo time of 136 milliseconds.
Figure 2. A- Magnetic resonance imaging in the axial,
sagittal and coronal planes of the brain (T1-weighted), showing hypointense frontoparietal lesion without
postgadolinium enhancement, in voxel position, typical of low-grade astrocytoma. B- Spectroscopic curve from proton magnetic resonance with echo time of 136 milliseconds.
Note inverted double peak of lactate (1.33 ppm), decrease
in the N-acetyl aspartate peak (2.02 ppm) and pro-nounced increase in the choline peak (3.2 ppm).
In such tumors there is a pronounced rise in
choline levels, associated with absence or
con-siderable reduction of N-acetyl aspartate.
4Presence of an alanine peak can confirm the
diagnosis (Figure 3).
65Inflammatory and infectious processes
The main application of proton magnetic
resonance spectroscopy in inflammatory and
infectious processes is the establishment of
differential diagnoses between these processes
and brain tumors.
In focal inflammatory processes in patients
with acquired immunodeficiency syndrome
(aids), such as toxoplasmosis (Figure 4),
tu-berculosis or cryptococcosis, proton
spectroscopy shows a broad lipid peak and
occasionally a lactate peak, with a decrease or
absence of N-acetyl aspartate and slight
in-crease of choline (Figure 4).
20,22In pyogenic abscesses, N-acetyl aspartate,
creatine and choline peaks are not detected
and the spectroscopic curve presents amino
acid peaks, especially succinate, acetate and
cytosolic peaks, due to the great quantity of
hydrolytic enzymes produced by bacteria,
which results in elevated concentrations of
proteins and amino acids.
20,41,63Alzheimer’s disease
Proton magnetic resonance spectroscopy
shows a reduction of N-acetyl aspartate in the
frontoparietal, temporal and hippocampus
regions, due to the neuron loss and increase
in myoinositol concentration.
25,26These results
can be found even in light and mild cases of
dementia, thus reinforcing the importance of
this method for early diagnosis of Alzheimer’s
disease.
24However, there is still controversy
regarding the sensitivity of proton magnetic
resonance spectroscopy in such cases.
Ischemic lesions
Hepatic encephalopathy
The diagnosis of hepatic encephalopathy
in most cases is difficult and, moreover, many
patients have a subclinical form of the
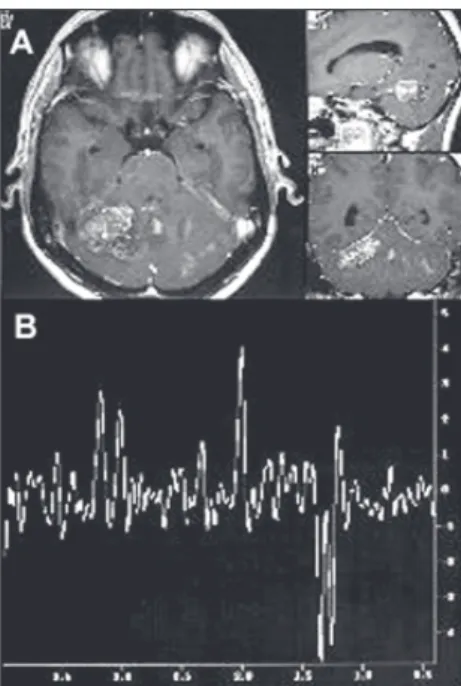
dis-Figure 5. A- Magnetic resonance imaging of the brain in the axial, sagittal and coronal planes (T1-weighted),
show-ing lesion in the right cerebellar hemisphere with heterogene-ous postgadolinium enhancement and voxel position, in
patient with acute ischemia. B- Spectroscopic curve from proton magnetic resonance with echo time of 136
millisec-onds, demonstrating inverted double peak of lactate (1.33 ppm), decrease in N-acetyl aspartate peak (2.02 ppm) and
slight increase in the choline peak (3.2 ppm). Figure 3. A- Magnetic resonance imaging of the brain in
the axial, sagittal and coronal planes (T1-weighted),
show-ing parietal lesion with homogeneous postgadolinium enhancement, typical of meningioma. B- Spectroscopic curve
from proton magnetic resonance with echo time of 136 milliseconds, demonstrating inverted double peak of alanine
(1.48 ppm), accentuated decrease in the N-acetyl aspartate peak (2.02 ppm) and pronounced increase in the choline
peak (3.2 ppm).
Figure 4. A- Magnetic resonance imaging of the brain in the axial, sagittal and coronal planes (T1-weighted),
showing frontoparietal ring-like postgadolinium lesion enhancement and voxel position, in patient with
toxoplas-mosis. B- Spectroscopic curve from proton magnetic resonance with echo time of 136 milliseconds,
demonstrat-ing accentuated lipid peak (1.3 ppm), absence of N-acetyl aspartate peak (2.02 ppm) and slight increase in the
choline peak (3.2 ppm).
ease. Proton magnetic resonance
spectros-copy shows an elevation of glutamate and
glutamine levels (peak between 2.1 and 2.5
ppm) and a reduction in choline and
1. Lenkinski RE, Schnall MD. MR Spectroscopy and the biochemi-cal basis of neurologibiochemi-cal disease. In: Atlas SW, editor. Magnetic resonance imaging of the brain and spine. Philadelphia: Lippincott-Raven; 1996. p.1619-53.
2. Alger JR, Frank JA, Bizzi A, et al. Metabolism of human
glio-mas: assessment with H-1 MR spectroscopy and F-18 fluorodeoxyglucose PET. Radiology 1990;177(3):633-41.
3. Luyten PR, Marien AJ, Heindel W, et al. Metabolic imaging of
patients with intracranial tumors: H-1 MR spectroscopic imaging and PET. Radiology 1990;176(3):791-9.
4. Norfray J, Byrd SE, Schwalm CA. Magnetic resonance
spectroscopy. In: McLone DG, ed. Pediatric neurosurgery. Phila-delphia: WB Saunders; 2001. p.1189-203.
5. Kuzniecky R. Magnetic resonance spectroscopy in focal
epi-lepsy: 31P and 1H spectroscopy. Rev Neurol 1999;155(6-7):495-8.
6. Ross B, Michaelis T. MR spectroscopy of the brain:
neurospectroscopy. In: Hesselink JR, Zlatkin MB, Edelman RR, editors. Clinical magnetic resonance imaging. Philadelphia: WB Saunders; 1996. p.928-81.
7. van der Knaap MS, van der Grond J, van Rijen PC, Faber JA,
Valk J, Willemse K. Age-dependent changes in localized proton and phosphorus MR spectroscopy of the brain. Radiology 1990;176(2):509-15.
8. Peeling J, Sutherland G, Marat K, Tomchuk E, Bock E. 1H and
13C nuclear magnetic resonance studies of plasma from pa-tients with primary intracranial neoplasms. J Neurosurg 1988;68(6):931-7.
9. Gruetter R. Localized 13C NMR spectroscopy in vivo. In:
Week-end Educational Courses: MR spectroscopy. Honolulu: Inter-national Society for Magnetic Resonance in Medicine; 2002. p.88-95.
10. Weiner MW, Hetherington HP. The power of the proton. Ra-diology 1989;172(2):318-20.
11. Frahm J, Bruhn H, Gyngell ML, et al. Localized high-resolu-tion proton NMR spectroscopy using stimulated echoes: initial applications to human brain in vivo. Magn Reson Med 1989;9(1):79-83.
12. Frahm J, Bruhn H, Gyngell ML, et al. Localized proton NMR spectroscopy in different regions of the human brain in vivo. Relaxation times and concentrations of cerebral metabolites. Magn Reson Med 1989;11(1):47-63.
13. Kwock L. Localized MR spectroscopy: basic principles. Neuroimaging Clin N Am 1998;8(4):713-31.
14. Butzen J, Prost R, Chetty V, Donahue K, Neppl R, Bowen W, et al. Discrimination between neoplastic and nonneoplastic brain lesions by use of proton MR spectroscopy: the limits of accu-racy with a logistic regression model. AJNR Am J Neuroradiol 2000;21(7):1213-9.
15. Wilken B, Dechent P, Herms J, et al. Quantitative proton mag-netic resonance spectroscopy of focal brain lesions. Pediatr Neurol 2000;23(1):22-31.
16. Adamson AJ, Rand SD, Prost RW, et al. Focal brain lesions: effect of single-voxel proton MR spectroscopic findings on treat-ment decisions. Radiology 1998;209(1):73-8.
17. Simone IL, Federico F, Tortorella C, et al. Localised 1H-MR spectroscopy for metabolic characterisation of diffuse and focal brain lesions in patients infected with HIV. J Neurol Neurosurg Psychiatry 1998;64(4):516-23.
18. Poptani H, Kaartinen J, Gupta RK, et al. Diagnostic assess-ment of brain tumours and non-neoplastic brain disorders in vivo using proton nuclear magnetic resonance spectroscopy and artificial neural networks. J Cancer Res Clin Oncol 1999;125(6):343-9.
19. Kaibara T, Tyson RL, Sutherland GR. Human cerebral neo-plasms studied using MR spectroscopy: a review. Biochem Cell Biol 1998;76(2-3):477-86.
20. Cecil KM, Lenkinski RE. Proton MR spectroscopy in inflam-matory and infectious brain disorders. Neuroimaging Clin N
○ ○ ○ ○ ○ ○ ○ ○ ○ ○ ○ ○ ○ ○ ○ ○ ○ ○ ○ ○ ○ ○ ○ ○ ○ ○ ○ ○ ○ ○ ○ ○ ○ ○ ○ ○ ○ ○ ○ ○ ○ ○ ○ ○ ○ ○ ○ ○ ○ ○ ○ ○ ○ ○ ○ ○ ○ ○ ○ ○ ○ ○ ○ ○
REFERENCES
Am 1998;8(4):863-80.
21. Chang L, Miller BL, McBride D, et al. Brain lesions in pa-tients with AIDS: H-1 MR spectroscopy. Radiology 1995;197(2):525-31.
22. Chinn RJ, Wilkinson ID, Hall-Craggs MA, et al. Toxoplasmo-sis and primary central nervous system lymphoma in HIV in-fection: diagnosis with MR spectroscopy. Radiology 1995;197(3):649-54.
23. Chang L, Ernst T. Proton MRS to assess HIV-related brain dis-eases. In: Weekend Educational Courses: MR spectroscopy. Honolulu: International Society for Magnetic Resonance in Medicine; 2002. p.48-55.
24. Shonk TK, Moats RA, Gifford P, et al. Probable Alzheimer dis-ease: diagnosis with proton MR spectroscopy. Radiology 1995;195(1):65-72.
25. Castillo M, Kwock L, Mukherji SK. Clinical applications of proton MR spectroscopy. AJNR Am J Neuroradiol 1996;17(1):1-15.
26. Ross BD, Bluml S, Cowan R, et al. In vivo MR spectroscopy of human dementia. Neuroimaging Clin N Am 1998;8(4):809-22.
27. Cwik VA, Hanstock CC, Allen PS, et al. Estimation of brainstem neuronal loss in amyotrophic lateral sclerosis with in vivo pro-ton magnetic resonance spectroscopy. Neurology 1998;50(1):72-7.
28. Bizzi A, Movsas B, Tedeschi G, et al. Response of non-Hodgkin lymphoma to radiation therapy: early and long-term assessment with H-1 MR spectroscopic imaging. Radiology 1995;194(1):271-6.
29. Davidson A, Tait DM, Payne GS, et al. Magnetic resonance spectroscopy in the evaluation of neurotoxicity following cra-nial irradiation for childhood cancer. Br J Radiol 2000;73(868):421-4.
30. Yoshino E, Ohmori Y, Imahori Y, et al. Irradiation effects on the metabolism of metastatic brain tumors: analysis by posi-tron emission tomography and 1H-magnetic resonance spectroscopy. Stereotact Funct Neurosurg 1996;66(Suppl 1):240-59.
31. Bruhn H, Frahm J, Merboldt KD, et al. Multiple sclerosis in children: cerebral metabolic alterations monitored by localized proton magnetic resonance spectroscopy in vivo. Ann Neurol 1992;32(2):140-50.
32. De Stefano N, Caramanos Z, Preul MC, et al. In vivo differ-entiation of astrocytic brain tumors and isolated demyelinat-ing lesions of the type seen in multiple sclerosis usdemyelinat-ing 1H magnetic resonance spectroscopic imaging. Ann Neurol 1998;44(2):273-8.
33. Rovira A, Pericot I, Alonso J, Rio J, Grive E, Montalban X. Serial diffusion-weighted MR imaging and proton MR spectroscopy of acute large demyelinating brain lesions: case report. AJNR Am J Neuroradiol 2002;23(6):989-94. 34. Bonavita S, Di Salle F, Tedeschi G. Proton MRS in
neurologi-cal disorders. Eur J Radiol 1999;30(2):125-31.
35. Ricci PE Jr. Proton MR spectroscopy in ischemic stroke and other vascular disorders. Neuroimaging Clin N Am 1998:8(4):881-900.
36. Malisza KL, Kozlowski P, Peeling J. A review of in vivo 1H magnetic resonance spectroscopy of cerebral ischemia in rats. Biochem Cell Biol 1998;76(2-3):487-96.
37. Wang Z, Zimmerman RA, Sauter R. Proton MR spectroscopy of the brain: clinically useful information obtained in assessing CNS diseases in children. AJR Am J Roentgenol 1996;167(1):191-9.
38. Friedman SD, Brooks WM, Jung RE, et al. Quantitative pro-ton MRS predicts outcome after traumatic brain injury. Neu-rology 1999;52(7):1384-91.
39. Schuhmann MU, Stiller D, Thomas S, Brinker T, Samii M. 1H-MR spectroscopic monitoring of posttraumatic metabolism following controlled cortical impact injury: pilot study. Acta
Neurochir Suppl 2000;76:3-7.
40. Sinson G, Bagley LJ, Cecil KM, et al. Magnetization transfer imaging and proton MR spectroscopy in the evaluation of ax-onal injury: correlation with clinical outcome after traumatic brain injury. AJNR Am J Neuroradiol 2001;22(1):143-51. 41. Garnett MR, Blamire AM, Rajagopalan B, Styles P,
Cadoux-Hudson TA. Evidence for cellular damage in normal-appearing white matter correlates with injury severity in patients follow-ing traumatic brain injury: a magnetic resonance spectroscopy study. Brain 2000;123(Pt 7):1403-9.
42. Gupta RK, Vatsal DK, Husain N, et al. Differentiation of tu-berculous from pyogenic brain abscesses with in vivo proton MR spectroscopy and magnetization transfer MR imaging. AJNR Am J Neuroradiol 2001;22(8):1503-9.
43. Kuzniecky R, Hetherington H, Pan J, et al. Proton spectroscopic imaging at 4.1 tesla in patients with malformations of cortical development and epilepsy. Neurology 1997;48(4):1018-24. 44. Cendes F, Caramanos Z, Andermann F, Dubeau F, Arnold DL.
Proton magnetic resonance spectroscopic imaging and magnetic resonance imaging volumetry in the lateralization of temporal lobe epilepsy: a series of 100 patients. Ann Neurol 1997;42(5):737-46.
45. Mendes-Ribeiro JA, Soares R, Simões-Ribeiro F, Guimarães ML. Reduction in temporal N-acetylaspartate and creatine (or choline) ratio in temporal lobe epilepsy: does this 1H-magnetic resonance spectroscopy finding mean poor seizure control? J Neurol Neurosurg Psychiatry 1998;65(4):518-22. 46. Kreis R, Ross BD, Farrow NA, Ackerman Z. Metabolic
disor-ders of the brain in chronic hepatic encephalopathy detected with H-1 MR spectroscopy. Radiology 1992;182(1):19-27. 47. Ross BD, Jacobson S, Villamil F, et al. Subclinical hepatic
en-cephalopathy: proton MR spectroscopic abnormalities. Radi-ology 1994;193(2):457-63.
48. Sutton LN, Wang Z, Gusnard D, et al. Proton magnetic reso-nance spectroscopy of pediatric brain tumors. Neurosurgery 1992;31(2):195-202.
49. Taylor JS, Ogg RJ, Langston JW. Proton MR spectroscopy of pediatric brain tumors. Neuroimaging Clin N Am 1998;8(4):753-79.
50. Hunter JV, Wang ZJ. MR spectroscopy in pediatric neuroradiology. Magn Reson Imaging Clin N Am 2001;9(1):165-89.
51. Westbrook C, Kaut C. Ressonância magnética prática. Rio de Janeiro: Guanabara Koogan; 2000.
52. Barker PB. Fundamentals of clinical MRS. In:. Weekend Edu-cational Courses: MR spectroscopy. Honolulu: International Society for Magnetic Resonance in Medicine; 2002. p.1-9. 53. Negendank WG, Sauter R, Brown TR, et al. Proton magnetic
resonance spectroscopy in patients with glial tumors: a multicenter study. J Neurosurg 1996;84(3):449-58. 54. Maudsley AA. Spectroscopic imaging. In: Weekend Educational
Courses: MR spectroscopy. Honolulu: International Society for Magnetic Resonance in Medicine; 2002. p.7-23. 55. Dowling C, Bollen AW, Noworolski SM, et al. Preoperative
proton MR spectroscopic imaging of brain tumors: correlation with histopathologic analysis of resection specimens. AJNR Am J Neuroradiol 2001;22(4):604-12.
56. Fulham MJ, Bizzi A, Dietz MJ, et al. Mapping of brain tumor metabolites with proton MR spectroscopic imaging: clinical relevance. Radiology 1992;185(3):675-86.
57. Moonen CT, von Kienlin M, van Zijl PC, et al. Comparison of single-shot localization methods (STEAM and PRESS) for in vivo proton NMR spectroscopy. NMR Biomed 1989;2(5-6):201-8.
58. Hwang JH, Egnaczyk GF, Ballard E, et al. Proton MR spectroscopic characteristics of pediatric pilocytic astrocytomas. AJNR Am J Neuroradiol 1998;19(3):535-40.
sequences. J Comput Assist Tomogr 1991;15(6):915-22. 60. Norfray JF, Tomita T, Byrd SE, et al. Clinical impact of MR
spectroscopy when MR imaging is indeterminate for pediatric brain tumors. AJR Am J Roentgenol 1999;173(1):119-25. 61. Bottomley PA. Spatial localization in NMR spectroscopy in vivo.
Ann N Y Acad Sci 1987;508:333-48.
62. Alger JR. Magnetic resonance spectroscopy and neuro-oncol-ogy. In:. Weekend Educational Courses: MR Espectroscopia de prótin. Honolulu: International Society for Magnetic Resonance in Medicine; 2002. p.39-43.
63. Brandão LA, Domingues RC. Espectroscopia de próton do encéfalo: princípios e aplicações. Rio de Janeiro: Revinter; 2002. 64. Le Bas JF, Estève F, Grand S, et al. Spectroscopie RMN et pathologie cérébrale. Applications cliniques. [NMR spectroscopy and brain diseases. clinical applications]. J Neuroradiol 1998;25(1):55-69.
65. Grand S, Passaro G, Ziegler A, et al. Necrotic tumor versus
brain abscess: importance of amino acids detected at 1H MR spectroscopy - initial results. Radiology 1999;213(3):785-93. 66. Byrd SE, Tomita T, Palka PS, et al.. Magnetic resonance
spectroscopy (MRS) in the evaluation of pediatric brain tumors, Part II: Clinical analysis. J Natl Med Assoc 1996;88(11):717-23.
67. Kinoshita Y, Kajiwara H, Yokota A, Koga Y. Proton magnetic resonance spectroscopy of brain tumors: an in vitro study. Neu-rosurgery 1994;35(4):606-13; discussion 613-4. 68. Kim DG, Choe WJ, Chang KH, et al. In vivo proton magnetic
resonance spectroscopy of central neurocytomas. Neurosurgery 2000;46(2):329-33; discussion 333-4.
69. Norfray JF, Darling C, Byrd S, et al. Short TE proton MRS and neurofibromatosis type 1 intracranial lesions. J Comput Assist Tomogr 1999;23(6):994-1003.
70. Auer DP, Gössl C, Schirmer T, Czisch M. Improved analysis of 1H-MR spectra in the presence of mobile lipids. Magn Reson
Med 2001;46(3):615-8.
71. Hakumäki JM, Kauppinen RA. 1H NMR visible lipids in the life and death of cells. Trends Biochem Sci 2000;25(8):357-62. 72. Castillo M, Smith JK, Kwock L. Correlation of myo-inositol levels and grading of cerebral astrocytomas. AJNR Am J Neuroradiol 2000;21(9):1645-9.
73. Kimura T, Sako K, Gotoh T, Tanaka K, Tanaka T. In vivo sin-gle-voxel proton MR spectroscopy in brain lesions with ring-like enhancement. NMR Biomed 2001;14(6):339-49. 74. Kadota O, Kohno K, Ohue S, Kumon Y, Sakaki S, Kikuchi K,
et al. Discrimination of brain abscess and cystic tumor by in vivo proton magnetic resonance spectroscopy. Neurol Med Chir 2001;41(3):121-6.
75. Schlemmer HP, Bachert P, Herfarth KK, Zuna I, Debus J, van Kaick G. Proton MR spectroscopic evaluation of suspicious brain lesions after stereotactic radiotherapy. AJNR Am J Neuroradiol 2001;22(7):1316-24.
Espectroscopia de prótons por ressonância
mag-nética: aplicações clínicas em pacientes com
lesões encefálicas
CONTEXTO:
A espectroscopia de prótons é
re-conhecidamente um método não invasivo
que, quando associada à imagem por
resso-nância magnética, possibilita a correlação de
alterações metabólicas e bioquímicas com
mudanças fisiológicas e anatômicas dentro de
um volume previamente determinado no
encéfalo. Existem dois métodos de
espectroscopia de prótons por ressonância
magnética: volume único de interesse (
single
voxel
) e imagem espectroscópica (
chemical
shift imaging
).
OBJETIVO:
Este trabalho discute as aplicações
clínicas da espectroscopia de prótons por
res-○ ○ ○ ○ ○ ○ ○ ○ ○ ○ ○ ○ ○ ○ ○ ○ ○ ○ ○ ○ ○ ○ ○ ○ ○ ○ ○ ○ ○ ○ ○ ○ ○ ○ ○ ○ ○ ○ ○ ○ ○ ○
RESUMO
Acknowledgments: The authors are grateful to Ilydio Polachini Júnior (in memoriam) for his support in the devel-opment of proton magnetic resonance spectroscopy in São José do Rio Preto, São Paulo State, Brazil, and to Carlos Daghlian (Universidade Estadual Paulista – São José do Rio Preto) for reviewing the English text.
Sérgio Luiz Ramin, MD. Discipline of Neurosurgery, De-partment of Neurological Sciences, Faculdade de Medicina de São José do Rio Preto, São José do Rio Preto, São Paulo, Brazil.
Waldir Antônio Tognola, MD, PhD. Head of the Disci-pline of Neurology, Department of Neurological Sciences, Faculdade de Medicina de São José do Rio Preto, São José do Rio Preto, São Paulo, Brazil.
Antonio Ronaldo Spotti, MD, PhD. Discipline of Neu-rosurgery, Department of Neurological Sciences, Faculdade de Medicina de São José do Rio Preto, São José do Rio Preto, São Paulo, Brazil.
Sources of funding: Not declared
Conflict of Interest: None
Date of first submission: November 21, 2002
Last received: March 7, 2003
Accepted: May 30, 2003
Address for correspondence: Sérgio Luiz Ramin
Av. José Munia, 4850 São José do Rio Preto/SP Brasil — CEP 15090-500 Tel. (+ 55 17) 3216-9999
E-mail: [email protected]
COPYRIGHT © 2003, Associação Paulista de Medicina
○ ○ ○ ○ ○ ○ ○ ○ ○ ○ ○ ○ ○ ○ ○ ○ ○ ○ ○ ○