Cone beam tomographic study of facial structures characteristics
at rest and wide smile, and their correlation with the facial types
Luciana Flaquer Martins1, Julio Wilson Vigorito2
How to cite this article: Martins LF, Vigorito JW. Cone beam tomographic study of facial structures characteristics at rest and wide smile, and their correlation with the facial types. Dental Press J Orthod. 2013 Nov-Dec;18(6):38-44.
Submitted: September 15, 2010 - Revised and accepted: September 15, 2011
Contact address: Luciana Flaquer Martins
Rua das Caneleiras, 1074. B. Jardim, Santo André/SP —Brazil — CEP: 09.090-050 E-mail: [email protected]
1 Visiting professor, Ciodonto College.
2 Full professor of Orthodontics, University of São Paulo (USP).
» The authors report no commercial, proprietary or financial interest in the prod-ucts or companies described in this article.
Objective: To determine the characteristics of facial soft tissues at rest and wide smile, and their possible relation to the facial type. Methods: We analyzed a sample of forty-eight young female adults, aged between 10, 19 and 40 years old, with a mean age of 30.9 years, who had balanced profile and passive lip seal. Cone beam computed tomographies were performed at rest and wide smile postures on the entire sample which was divided into three groups according to individual facial types. Soft tissue features analysis of the lips, nose, zygoma and chin were done in sagittal, axial and frontal axis tomographic views. Results: No differences were observed in any of the facial type variables for the static analysis of facial structures at both rest and wide smile postures. Dynamic analysis showed that brachifacial types are more sensitive to movement, presenting greater sagittal lip contraction. However, the lip movement produced by this type of face results in a narrow smile, with smaller tooth exposure area when compared with other facial types. Con-clusion: Findings pointed out that the position of the upper lip should be ahead of the lower lip, and the latter, ahead of the pogonion. It was also found that the facial type does not impact the positioning of these structures. Additionally, the use of cone beam computed tomography may be a valuable method to study craniofacial features.
Keywords: Diagnosis. Cone beam computed tomography. Smile.
» The patient displayed in this article previously approved the use of her facial and intraoral photographs.
Objetivos: determinar as características dos tecidos moles faciais nas fases em repouso e em sorriso amplo, e sua pos-sível relação com o tipo facial. Métodos: foi analisada uma amostra de 48 adultos jovens, com idade variando entre 19,10 e 40 anos, com média de 30,9 anos, do sexo feminino, apresentando faces equilibradas e selamento labial passivo. Tomografias computadorizadas de feixe cônico em repouso e em sorriso amplo foram efetuadas em toda a amostra, que foi segmentada em três grupos de acordo com o tipo facial. A análise das características tegumentares de lábios, nariz, malar e mento foi feita em cortes tomográficos sagitais, axiais e em vista frontal. Resultados:
na análise estática das estruturas faciais, em repouso e em sorriso amplo, não houve diferenciação entre os tipos faciais em nenhuma das variáveis estudadas. A análise dinâmica evidenciou que o tipo braquifacial é mais sensível à movimentação, apresentando maior contração sagital do lábio superior, porém, o deslocamento labial apresentado por esse tipo facial produz um sorriso pouco amplo, com menor área de exposição dentária quando comparado aos demais tipos faciais. Conclusão: constatou-se que, em uma face equilibrada, a posição do lábio superior deve ser à frente do lábio inferior, e esse à frente do pogônio, e que o tipo facial não exerce influência sobre o posiciona-mento dessas estruturas. Observamos que a utilização de tomografias computadorizadas de feixe cônico pode ser de grande valia para o estudo de características craniofaciais.
INTRODUCTION
One of the irst facial esthetic concepts in
Ortho-dontics was conceived by Angle,1 who related perfect
tooth intercuspation to the existing harmony between
dental skeletal and facial structures. Case2 has stated that
even in face of lack of tooth contact and adequate mas-ticatory function cases, patients could occasionally pres-ent reasonable facial esthetics. He also observed that all “beautiful” faces exhibited the following features: pas-sive labial seal, good relation between the zygoma and the upper lips, lower lips slightly retracted in relation to the upper lips, and protruded chin.
Diagnosis and orthodontic planning were developed based on cephalometric studies, using lines, planes and angles aiming at quantifying the features of the cranio-facial complex in addition to determining normality parameters and goals to be achieved at the end of the
orthodontic treatment.3-6
From the 70’s onwards, esthetic parameters assess-ments have been described as essential to treatment planning, associating Orthodontics to Orthognatic Surgery. Nevertheless, using cephalometric radiographs only is considered insuicient, since sot tissue
charac-teristics would be better visualized by pictures.7-12
The incorporation of cone beam computed tomog-raphy (CBCT) techniques to Dentistry allowed com-parison between sot and hard tissue structures, without overlaps or magniications, providing data that
corre-spond to the patient’s real measurements.14,15
The possibility of a better appreciation of craniofa-cial structures improved not only the accuracy in land-marks demarcation, but also the precision of
conven-tional cephalometric analysis16,17,18,19,20,21 and it is likely
that new assessment techniques might come up and
change the current craniofacial analysis paradigms.16,17,19
Our purpose in this paper was to assess the sot tissue features of the face, nose, lips, zygoma and chin, both at rest and during wide smile positions, and their possible relation to the facial type. In order to accomplish that, we used cone beam computed tomographies, once they provide us with a better visualization and a more com-prehensive approach for orthodontic diagnosis when
compared with traditional methods.18-21
MATERIAL AND METHODS
The project for this article was approved by the Uni-versity of Sao Paulo College of Dentistry Institutional
Review Board, under report number 17/2008. This re-search assessed 48 female subjects aged between 19.10 and 40 years old, with a mean age of 30.9 years old, caucasian, who had passive lip seal . None of the patients had previously taken part on research activities, facial surgeries (plastic or orthognatic) and had never under-gone any facial esthetic intervention.
Facial Index was used to determine each patient’s fa-cial type. Patients’ faces were photographed with fafa-cial
sot tissues at rest and with guided NHP,22 according to
Vigorito e Martins.26
Each patient’s image was inserted into the Ra-diocef Studio 2 computer software (Radio Memory Ltda, Belo Horizonte — Brazil), by means of which the facial type was obtained according to the anthro-pometric Facial Index.
Calculations were done using the following formula: N’-Me’x 100 / ZiR’-ZiL’
Once Facial Index had been determined, patients were classiied as brachifacial, mesofacial or dolicofacial
according to the following parameters:23,26
- Brachifacial: between 80.0 and 84.9%. - Mesofacial: between 85.0 and 89.9%.
- Dolicofacial: between 90.0 and 95.0% or higher. Following the aforementioned proportions, sample was subdivided into three groups with sixteen subjects each (Brachifacial, Mesofacial and Dolicofacial).
Ater the facial type had been determined, cone beam computed tomographies were taken by an i-Cat (Imaging Sciences International Hatield, PA — USA) digital tomography scanner, at two stages: 1- With facial sot tissues at rest; 2- Wide smile.
All measurements were obtained through the i-CAT Vision (Imaging Sciences International Hatield, PA — USA) computer sotware at the MPR visualiza-tion screen, (multi-plane reconstrucvisualiza-tion).
For the purpose of this study, true horizontal de-termination was chosen by means of a single intra-cranial landmark (Sela), tracing a perpendicular line
departing from it, this being the true vertical.24 This
technique, together with guided natural head posi-tion, is suggested to avoid that possible variations be-tween intracranial planes and lines diverge from the
true horizontal line.23,24
Variables used in tomographic soft tissue cephalometric assessment
Axial section (Fig. 1):
1) Zygomatic thickness (Zygoma point; zygo-matic soft tissue point, left and right sides); 2) Nose width (left and right alar); 3) Base of the nose width (left to right nasal base)
Sagittal section (Fig. 2):
1) Snv-Ul (upper lip position in relation to the vertical subnasal line); 2) Snv-Ll (lower lip position in relation to the vertical subnasal line); 3) Snv-Pog’ (pogonion position in relation to the vertical subnasal line); 4) H-nose (distance from the tip of the nose to line H); 5) Nose height (distance from pro-nasal to the true horizontal line); 6) Collumela height (distance from collumela to true horizontal); 7) Upper lip height (distance from the stomion to subnasal point); 8) Lower lip height (distance from stomion to mental lip point); 9) Upper lip thickness (distance between vertical prosthion to the tip of the upper lip); 10) Lower lip thickness (distance from
vertical infradentale to the tip of lower lip); 11) Dis-tance between labial apexes (disDis-tance between upper and lower lip width lines); 12) E-Ll (distance from line E and the lower lip).
Frontal view (Figs 4 and 5):
1) Upper lip vermilion height (distance between the most central upper lip point to the stomion, marked over the midline); 2) Lower lip vermilion height (dis-tance between the stomion and the inferior portion of the lower lip, marked over the midline); 3) Distance be-tween right and let labial comissures; 4) Labial height (distance between the upmost part of the upper lip and the lowest part of the lower lip, marked over the mid-line); 5) Labial index (proportional distance between comissures and labial height, at rest); 6) Smile index (proportional distance between the comissures and la-bial height, at wide smile); 7) Teeth exposure area.
STATISTICAL METHOD
Facial structures movements were calculated for each patient by subtracting the value at rest from the
Figure 1 - Variables studied in axial section at rest (A) and wide smile (B).
Figure 2 - Variables studied in sagittal section at rest.
wide smile value. Each facial movement measurement was compared between facial types by means of analysis
of variance (one-way ANOVA),25 followed by
Bonfer-roni25 multiple comparisons when the ANOVA
pre-sented statistically signiicant diferences while checking which facial types presented distinct facial movement.
In order to assess the relationship between smile index and teeth exposure area, Pearson’s correla-tions were calculated separately for each face type, for the whole sample.
RESULTS
Results are shown in Tables 1 to 8.
Figure 3 - Variables studied in sagittal section during wide smile.
Figure 5 - Tooth exposure area, calculated by tridimensional view of the face during wide smile.
Figure 4 - Variables studied in tridimensional view of the face at rest (A and B) and during wide smile (C).
Table 1 - ANOVA analysis of variance of the difference between facial types at rest and wide smile, in axial tomographic section.
Variable
Facial type
Brachifacial Mesofacial Dolicofacial P
Mean ± SD n Mean ± SD n Mean ± SD n
Left zygomatic thickness 5.11 ± 2.48 16 3.93 ± 2.28 16 3.11 ± 1.64 16 0.04 Right zygomatic thickness 5.25 ± 2.34 16 3.83 ± 2.22 16 3.17 ± 1.84 16 0.027
Nose width 4.42 ± 3.54 16 3.74 ± 2.83 16 3.12 ± 2.59 16 0.479 Nasal base width 5.24 ± 2.68 16 4.3 ± 1.93 16 4.13 ± 2.12 16 0.336
Table 2 - Bonferroni analysis of measurements presenting statistically significant differences between rest and wide smile, in axial tomographic section.
Variable Comparison Mean
diference Standard Error P
CI (95%)
Lower Upper
Left zygomatic thickness
Brachifacial Mesofacial 1.18 0.76 0.388 -0.72 3.08
Brachifacial Dolicofacial 2 0.76 0.036 0.1 3.9
Mesofacial Dolicofacial 0.82 0.76 0.87 -1.08 2.72
Right zygomatic thickness
Brachifacial Mesofacial 1.42 0.76 0.203 -0.47 3.3
Brachifacial Dolicofacial 2.08 0.76 0.026 0.2 3.97
Mesofacial Dolicofacial 0.66 0.76 1 -1.22 2.55
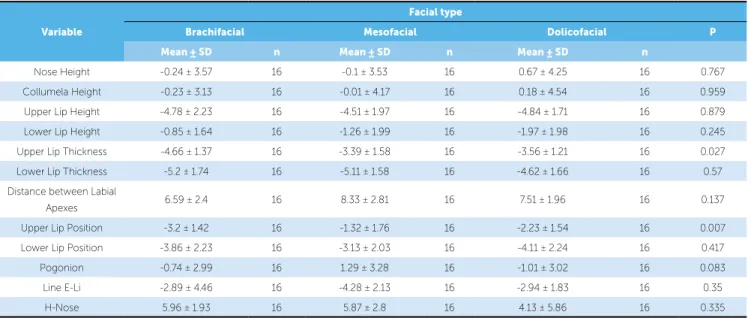
Table 3 - ANOVA analysis of variance of the difference between facial types at rest and wide smile, in sagittal tomographic section.
Variable
Facial type
Brachifacial Mesofacial Dolicofacial P
Mean ± SD n Mean ± SD n Mean ± SD n
Nose Height -0.24 ± 3.57 16 -0.1 ± 3.53 16 0.67 ± 4.25 16 0.767 Collumela Height -0.23 ± 3.13 16 -0.01 ± 4.17 16 0.18 ± 4.54 16 0.959 Upper Lip Height -4.78 ± 2.23 16 -4.51 ± 1.97 16 -4.84 ± 1.71 16 0.879 Lower Lip Height -0.85 ± 1.64 16 -1.26 ± 1.99 16 -1.97 ± 1.98 16 0.245 Upper Lip Thickness -4.66 ± 1.37 16 -3.39 ± 1.58 16 -3.56 ± 1.21 16 0.027 Lower Lip Thickness -5.2 ± 1.74 16 -5.11 ± 1.58 16 -4.62 ± 1.66 16 0.57 Distance between Labial
Apexes 6.59 ± 2.4 16 8.33 ± 2.81 16 7.51 ± 1.96 16 0.137 Upper Lip Position -3.2 ± 1.42 16 -1.32 ± 1.76 16 -2.23 ± 1.54 16 0.007 Lower Lip Position -3.86 ± 2.23 16 -3.13 ± 2.03 16 -4.11 ± 2.24 16 0.417 Pogonion -0.74 ± 2.99 16 1.29 ± 3.28 16 -1.01 ± 3.02 16 0.083 Line E-Li -2.89 ± 4.46 16 -4.28 ± 2.13 16 -2.94 ± 1.83 16 0.35
H-Nose 5.96 ± 1.93 16 5.87 ± 2.8 16 4.13 ± 5.86 16 0.335
Table 4 - Bonferroni analysis of measurements presenting statistically significant differences between rest and wide smile, in sagittal section.
Variable Comparison Mean
diference Standard Error p
CI (95%)
Lower Upper
Upper Lip Thickness
Brachifacial Mesofacial -1.27 0.49 0.04 -2.49 -0.04 Brachifacial Dolicofacial -1.11 0.49 0.089 -2.33 0.12
Mesofacial Dolicofacial 0.16 0.49 1 -1.06 1.39
Upper Lip Position
Brachifacial Mesofacial -1.87 0.56 0.005 -3.26 -0.48 Brachifacial Dolicofacial -0.96 0.56 0.274 -2.35 0.43
Mesofacial Dolicofacial 0.91 0.56 0.335 -0.48 2.3
Table 5 - ANOVA analysis of variance of the difference between facial types at rest and wide smile, in frontal view.
Variable
Facial type
Brachifacial Mesofacial Dolicofacial p
Mean ± SD n Mean ± SD n Mean ± SD n
Table 6 - Bonferroni analysis of upper lip vermilion height presenting statistically significant differences between facial types at rest and wide smile, in frontal view.
Variable Comparison Mean
diference Standard Error p
CI (95%)
Lower Upper
Upper lip vermilion Height
Brachifacial Mesofacial -0.04 0.37 1 -0.96 0.89
Brachifacial Dolicofacial -1.38 0.37 0.002 -2.3 -0.45 Mesofacial Dolicofacial -1.34 0.37 0.002 -2.26 -0.42
Table 7 - ANOVA analysis of variance of teeth exposure area between different facial types, in frontal view.
Variable
Facial type
Brachifacial Mesofacial Dolicofacial p
Mean ± SD n Mean ± SD n Mean ± SD n
Teeth exposure area 288.7 ± 158.4 16 435.04 ± 101.38 16 431.9 ± 102.14 16 0.002
Table 8 - Bonferroni analysis of teeth exposure area that presented statistically significant difference between facial types at rest and wide smile, in frontal view.
Variable Comparison Average
Diference Standard Error p
IC (95%)
Lower Upper
Teeth exposure
area
Brachifacial Mesofacial -146.37 43.69 0.005 -255.01 -37.73 Brachifacial Dolicofacial -143.21 43.69 0.006 -251.85 -34.57 Mesofacial Dolicofacial 3.16 43.69 1 -105.48 111.8
DISCUSSION
Considering the fact that the methodology applied to assess facial sot tissues is considerably diferent from the methodologies described in the literature, the dis-cussion of this paper is restricted to a description of the indings, supplying data so that further researches may be developed and compared to the present one.
For the study of axial section tomographic images, for both rest and wide smile positions, measurements presented no statistically signiicant diference between the three facial types.
In the dynamic assessment of these structures, de-termined by the axial section, it was veriied that nei-ther the nose width nor the nose base width sufered any changes in diferent facial types. On the other hand, sot tissues thickness around the zygomatic structures was inluenced by wide smile position when comparing diferent facial types, suggesting that brachifacial sub-jects present greater muscle movement, translated by in-creased thickness around the zygoma if compared with dolicofacial subjects (Tables 1 and 2).
When comparing all variables assessed by the sagit-tal section, both at rest and wide smile, no statistically signiicant diferences were found between facial types.
However, it was found that at both rest and wide smile, upper lip, lower lip and pogonion positions re-mained invariable: the lower lip with discrete retrusion
if compared with the upper lip, and the pogonion slight-ly retruded if compared with the lower lip, as reported by the literature.2,4,5,8,24
Except for the tip of the nose, the nasal collumela and the pogonion, dynamic assessment revealed that height and width of both upper and lower lips as well as the es-thetic positioning of these structures, presented signii-cant diference between the two phases (Table 3). Ex-cept for upper lip thickness and positioning, which tend to thin out as the smile expands in brachifacial subjects, other measurements did not particularize any facial type. In frontal view, at rest and wide smile, lips and their features were analyzed and no statistical diference was found between measurements and the facial types.
Dynamic assessment of diferent variables in frontal view revealed a peculiar behavior with regard to the fa-cial types, as follows:
» Brachifacial, the distance between lip comissures and lip height presented signiicant alteration. Lower lip vermilion height decreased due to vertical muscle con-traction (Table 4).
» Mesofacial, all variables studied revealed signiicant alteration (Table 4).
The dynamic behavior between labial and smile indexes presented a statistical signiicant diference for mesofacial and dolicofacial types, with labial index ex-ceeding the smile index. These results demonstrate that although muscle movements take place during wide smile , they do not equally involve vertical and horizon-tal lip distancing, with a larger distance for horizonhorizon-tal distancing if compared with the vertical one.
Bonferroni analysis of upper lip vermilion height (Ta-ble 5) revealed that the upper lip vermilion height was greater for brachifacial patients than for dolicofacial ones, and when comparing dolicofacial with mesofacial sub-jects, this parameter was higher for mesofacial individuals
On comparing the tooth exposure area variable be-tween facial types, as an attempt to distinguish their fea-tures, it was observed that there was a statistical signii-cant diference (Table 6) that, when submitted to Bon-ferroni analysis (Table 7), demonstrated that brachifacial subjects presented lower values if compared with mesio and dolicofacial ones, with no signiicant diference be-tween the two latter patterns.
Observation of tooth exposure behavior in compari-son with the smile index showed no relation between
those two variables (Table 8). That conirms the fact that the range of lip movement does not impact total tooth exposure.
CONCLUSION
The results obtained from this research led to the conclusion that in balanced faces, the facial type does not distinguish lip, nose, pogonion or zygoma positioning in soft tissues, neither at rest nor at wide smile position.
That reinforces the importance of orthodontic plan-ning that in addition to being based on bone structures relation, facial growth and dental intercuspation, should also be able to assess sot tissue accommodation towards dental and skeletal tissues as well as facial esthetics, al-ways seeking for the balance between these structures as a inal goal of the treatment.
The use of cone beam computed tomography may be a great adjuvant in diagnostic studies that attribute equal weight to both hard and sot tissues analysis, since it allows the assessment of lateral, sagittal and coronal views as well as frontal and proile appreciations of the facial sot tissues.
1. Angle EH. Treatment of malocclusion of the teeth. 7a ed. Philadelphia: SS White; 1907.
2. Case CS. Orthodontic principles of diagnosis and general rules of treatment of all malocclusions. Chicago: CS Case; 1921.
3. Tweed CH. The Frankfort-mandibular plane angle in orthodontic diagnosis, classiication, treatment planning, and prognosis. Am J Orthod Oral Surg. 1946;32(4):175-230.
4. Downs WB. Analysis of the dentofacial proile. Angle Orthod. 1956;26(4):191-212. 5. Holdaway RA. Changes in relationships of points A and B during orthodontic
treatment. Am J Orthod. 1956;42(3):176-93.
6. Ricketts RM. Planning treatment on the basis of the facial pattern and an estimate of its growth. Angle Orthod. 1957;27(1):14-37.
7. Legan HL, Burstone CJ. Soft tissue cephalometric analysis for orthognathic surgery. J Oral Surg. 1980;38(10):744-51.
8. Lündstrom A, Forsberg CM, Peck S, McWilliam J. A proportional analysis of the soft tissue facial proile in young adults with normal occlusion. Angle Orthod. 1992;62(2):127-33; discussion 144-4.
9. Cox NJ, van der Linden FPGM. Facial harmony. Am J Orthod Dentofacial Orthop. 1971;60(2):175-83.
10. Wylie GA, Fish LC, Epker BN. Cephalometrics: a comparison of ive analyses currently used in the diagnosis of dentofacial deformities. Int Adult Orthodon Orthognath Surg. 1987;2(1):15-36.
11. Jacobson A. Planning for orthognathic surgery-art or science? Int J Adult Orthod Orthognath Surg. 1990;5(4):217-24.
12. Matteson SR, Deahl ST, Alder ME, Nummikoski PV. Advanced imaging methods. Crit Rev Oral Biol Med. 1996;7(4):346-95.
13. Farman AG, Scarfe WC, Hilgers MJ, Bida O, Moshiri M, Sukovic P. Dentomaxillofacial cone beam CT for orthodontic assessment. Int Congress Series. 2005;1281:1187-90.
14. Sukovic P. Cone beam computed tomography in craniofacial imaging. Orthod Craniofac Res. 2003;6(1):31-6.
REFERENCES
15. Schulze D, Heiland M, Schmelzle R, Rother UJ. Diagnostic possibilities of cone beam computed tomography in facial skeleton. Int Cong Series. 2004;1268:1179-83.
16. Halazonetis DJ. From 2-dimensional cephalograms to 3-dimensional computed tomography scans. Am J Orthod Dentofacial Orthop. 2005;127(5):627-37.
17. Farman AG, Scarfe WC, Hilgers MJ, Bida O, Moshiri M, Sukovic P. Dentomaxillofacial cone beam CT for orthodontic assessment. Int Congress Series. 2005;1281:1187-90.
18. Rino-Neto J, Accorsi MAO, Ribeiro A, Paiva JB, Cavalcanti MGP. Imagens craniofaciais em ortodontia: O estágio atual da documentação ortodôntica tridimensional. Ortodontia SPO. 2006;39(2):144-54.
19. Garib DG, Raymundo Jr R, Raymundo MV, Raymundo DV, Ferreira SN. Tomograia computadorizada de feixe cônico (Cone beam): entendendo este novo método de diagnóstico por imagem com promissora aplicabilidade na Ortodontia. Rev Dental Press Ortod Ortop Facial. 2007;12(2):139-56.
20. Kumar V, Ludlow JB, Cevidanes LH. Comparison of conventional and cone beam CT synthesized cephalograms. Dentomaxillofac Radiol. 2007;36(5):263-9. 21. Ludlow JB, Gubler M, Cevidanes L, Mol A. Precision of cephalometric
landmark identiication: Cone-beam computed tomography vs conventional cephalometric views. Am J Orthod Dentofacial Orthop. 2009;136(3):312.e1-10; discussion 312-3.
22. Paiva JB, Rino-Neto J, Lopes KB. Análise do lábio superior após o tratamento ortodôntico. Ortodontia. 2004;37(2):8-13.
23. Daruge E, Zalaf CF. A biometria aplicada na identiicação. RGO. 1985;33(2):153-5. 24. Lopes KB. Avaliações tegumentares, esqueléticas e dentárias do peril
facial [dissertação]. São Paulo (SP): Universidade de São Paulo; 2004. 25. Neter J, Kutner MH, Nachtsheim CJ, Wasserman W. Applied linear statistical
models. Ilinois: Richard D Irwing; 1996.