DOI: http://dx.doi.org/10.5007/1980-0037.2017v19n4p436
Clusters of negative health-related physical
itness indicators and associated factors
in adolescents
Combinação de indicadores negativos da aptidão física
e fatores associados em adolescentes
Tiago Rodrigues de Lima1
Diego Augusto Santos Silva1
Abstract - Inadequate levels in health-related physical itness components are associated with early cardiovascular mortality in adult life. he aim of this study was to analyze the association between clusters of negative physical itness indicators with sociodemographic and lifestyle variables in adolescents. he survey was conducted with 866 students (14-19 years) from public schools of São José, Santa Catarina, Brazil. Aerobic itness was assessed by the modiied Canadian aerobic itness test; muscle strength was measured by handgrip dynamometer; lexibility was assessed by the sit-and-reach test; body fat was measured by the sum of triceps and subscapular skinfolds. Sociodemographic and lifestyle variables were veriied by questionnaire. he simultaneity of behaviors was evaluated by the ratio between observed and expected prevalence of inadequate physical itness levels. he combination of negative physical itness indicators was analyzed through multinomial logistic regression. he prevalence observed for the simultaneity of four negative physical itness indicators was 30% higher than expected. Female adolescents were more susceptible to the presence of two, three and four negative physical itness indicators. Adolescents who presented risk behavior in relation to screen time were more likely to present one, three and four negative physical itness indicators. Female gender and risk behavior in relation to screen time were factors associated with the simultaneity of negative physical itness indicators.
Key words: Adolescent health; Cross-sectional studies; Epidemiology; Prevention and control.
Resumo - Níveis inadequados nos componentes da aptidão física relacionada à saúde estão as-sociados à mortalidade cardiovascular precoce na vida adulta. Objetivou-se analisar a associação entre a combinação de indicadores negativos da aptidão física com variáveis sociodemográicas e do estilo de vida em adolescentes. Pesquisa realizada com 866 estudantes (14-19 anos) de escolas públicas de São José, Santa Catarina, Brasil. A aptidão aeróbia foi avaliada pelo teste canadense modiicado de aptidão aeróbia; a força muscular foi mensurada por dinamômetro de preensão manual; a lexibilidade foi avaliada pelo teste de sentar e alcançar; a gordura corporal foi men-surada pelo somatório das dobras cutâneas do tríceps e subescapular. Variáveis sociodemográicas e do estilo de vida foram veriicadas por questionário. A simultaneidade de comportamentos foi avaliada pela razão entre a prevalência observada e a esperada de níveis inadequados de aptidão física. A combinação de indicadores negativos da aptidão física foi analisada por meio de regressão logística multinomial. A prevalência observada para a simultaneidade de quatro indicadores negativos da aptidão física foi 30% maior que a esperada. Adolescentes do sexo feminino foram mais suscetíveis a presença de dois, três e quatro indicadores negativos da apti-dão física. Adolescentes que apresentavam comportamento de risco em relação ao tempo de tela tiveram maiores chances de apresentar um, três e quatro indicadores negativos da aptidão física. Sexo feminino e comportamento de risco em relação ao tempo de tela foram os fatores associados a simultaneidade de indicadores negativos da aptidão física.
1 Federal University of Santa Catari-na. Physical Education Department. Florianópolis, SC. Brazil.
Received: 09 March 2017
INTRODUCTION
Physical itness composed of physiological components such as aerobic itness, muscle strength, lexibility and body composition, is directly as-sociated with health and well-being1. Inadequate levels in health-related
physical itness components are directly related to early cardiovascular mortality in adulthood and the development of chronic diseases (high blood pressure, metabolic syndrome and type 2 diabetes)2-4, whose treatment
costs worldwide were approximately US$ 863 billion in the year 20104.
High prevalence of adolescents with low aerobic itness levels were observed in surveys conducted in North America (Canada and USA) and Europe (Spain), with values ranging from 13.0% to 32.0%3.5,6. A
popula-tion-based study with adolescents in Canada found that approximately half of respondents had low strength levels3. In studies carried out with the
partici-pation of children and adolescents from countries such as Portugal, Hungary and Canada, the prevalence of low lexibility levels ranged from 38.4% to 68.0%3,7,8. Another physical itness indicator presenting high prevalence in
the adolescent population was excess body fat3, 6. In survey conducted with
schoolchildren in the USA, 44.2% had excess body fat6. Research conducted
with adolescents in cities in southern Brazil found that approximately eight out of ten boys and nine out of ten girls had unsatisfactory health levels for at least one physical itness indicator; in addition, the percentage of adolescents with negative physical itness indicators was 23.8%, 34.4% and 30.5% for body fat, muscle itness and aerobic itness, respectively9,10.
Although several surveys have been conducted to investigate the re-lationship between physical itness indicators with sociodemographic and lifestyle factors in adolescents9-11, such studies did not investigate the four
physical itness indicators (muscle strength, aerobic itness, lexibility and body fat) simultaneously, although there is evidence of the interrelation of these components12. Investigating the negative health-related physical
itness indicators with sociodemographic and lifestyle factors in adolescents is justiied, since in addition to verifying to what extent this particular group of schoolchildren can be screened, information in literature regarding these constructs is presented in their majority, bidirectionally3,5,11. Likewise,
the veriication of negative physical itness indicators simultaneously is important because it is possible that the potential negative health efect caused by the combination of these indicators may be greater than the sum of each independent factor13. In addition, health problems associated with
negative physical itness indicators usually manifest throughout adult life; however, their development seems to begin in childhood and adolescence14.
hus, the early identiication of modiiable aspects associated with health problems such as negative physical itness indicators is important for the elaboration of strategies to prevent the onset of these diseases.
METHODOLOGICAL PROCEDURES
his cross-sectional epidemiological school-based survey was carried out in the second half of 2014 in the city of São José, Southern Brazil. he municipality has Human Development Index (HDI) of 0.809 and a GINI index of 0.4415.
he population of this research consisted of 5,182 students aged 14-19 years from public high school of São José, distributed in 11 eligible schools and 170 high school classes. he sampling process was determined in two stages: 1) stratiied by state public high schools (n = 11); 2) conglomerate of classes, considering the study shift and teaching series (n = 170 classes). In stage two, all high school students who were present in classroom on the days of data collection were invited to participate in the study. he probabilistic sample consisted of 1,132 students. For the present study, only students who had all measures for the dependent variable (combination of negative physical itness indicators - low aerobic itness, low handgrip strength levels, low lexibility and excess body fat) and independent vari-ables (gender, age, maternal schooling, breakfast, sleep hours / day, screen time and overall physical activity) were included, resulting in a sample of 866 individuals. Details on the estimates for sample size calculation and the entire sampling process (inclusion, exclusion criteria, eligibility) can be found in literature16.
Since the present study used data to examine distinct issues of a broader research, statistical power was calculated, in which values between 83.2% and 100% were checked to test for associations between combinations of negative physical itness indicators and gender, screen time and overall physical activity. For the other associations investigated (age, maternal schooling, breakfast and sleep hours), power was below 80%.
he study was approved by the Ethics Research Committee with Human Beings of the Federal University of Santa Catarina under CAAE protocol: 33210414.3.0000.0121. Only subjects who returned the informed consent form signed by parents (<18 years) or by themselves (≥18 years), to-gether with the consent form signed by themselves, participated in the study. he dependent variable was the combination of the following negative physical itness indicators: low aerobic itness, low handgrip strength levels, low lexibility and excess body fat. To classify individuals in relation to negative physical itness indicators, scores ranging from 0 (with no negative physical itness indicator) to four (four negative physical itness indicators) were generated.
Aerobic itness was measured using the modiied Canadian Aerobic Fitness Test - mCAFT (1), validated in comparison to indirect calorim-etry in Canadian men and women aged 15-69 years17, and with suicient
discriminatory power to detect elevated blood pressure levels in young Brazilians16. Adolescents had to complete one or more stages of three
when the subject reached 85% of maximal heart rate1, which was veriied
by means of a Polar® frequency meter model H7 Bluetooth® (Kempele, Finland). Oxygen expenditure and reference values for aerobic itness were determined by the Canadian battery1. he equation of the aerobic
itness score is: Score = 10 [17.2 + (1.29 x oxygen expenditure) - (0.09 x body weight in kg) - (0.18 x age in years). From this score, each participant was classiied in one of ive categories: (a) “Needs improvement”; (b) “Regular”; (c) “Good”; (d) “Very good”; (e) excellent”. In this study, aerobic itness was considered “adequate” for adolescents in categories (c), (d) and (e), and “low” for categories (a) and (b), where low aerobic itness levels are inversely associated with blood pressure in adolescents16.
Handgrip strength (FPM) was measured using a Saehan® manual grip dynamometer (Seoul, South Korea). During evaluation, the adoles-cent stood with his arms outstretched at the side of the body, without the equipment leaning against his thigh. he equipment was located between the distal phalanges and the palm of the hand; then the adolescent was asked to take inspiration and maximum expiration, followed by the greatest pressure with the hand in the equipment1. he test was performed on both
hands alternately, twice, and the best result of each hand was scored and added to obtain total force. FPM was classiied according to gender. For boys, those with FPM less than or equal to 83 kgf were classiied as “low”, those with higher FPM were classiied as “adequate”1. Girls with FPM
results less than or equal to 53 kgf were classiied as “low”, and those with higher results were classiied as “adequate”1.
Flexibility was measured through the Wells bench using the sit-and-reach test. he test was performed twice and the highest value sit-and-reached in the test was considered1. Flexibility was classiied according to gender,
and boys with lexibility less than or equal to 23 cm were classiied as with “low lexibility”, and those with higher lexibility were classiied as with “adequate lexibility”1. Girls with lexibility results less than or equal to 28
cm were classiied as with “low lexibility”, and those with higher results were classiied as with “adequate lexibility”1.
Excess body fat was measured by two skinfolds (triceps and subscapular) with a Cescorf® adipometer (Porto Alegre, Brazil), through standardiza-tions of the International Society of the Advancement of Kinanthropometry (ISAK). Anthropometric measurements were taken by a single level-1 ISAK certiied evaluator. he results of skinfolds were summed and ana-lyzed as proposed by Lohman18, according to sex. Adolescents with sum
≥ 30 mm and ≥ 35 mm for boys and girls, respectively, were considered to have excessive body adiposity18.
he questioning regarding breakfast is part of the “Fantastic Lifestyle” questionnaire, translated and validated for the Brazilian population19. his
variable was collected by the question related to the usual week: “During the past 7 days, how many days did you have breakfast?” It was considered “frequent” breakfast individuals who said they had the meal from three to seven days per week20. Individuals who reported having breakfast from zero
to two days per week were classiied as having “infrequent” consumption20.
his variable was classiied in this way since there is an inverse relationship between breakfast intake and cardiometabolic risk factors20.
he results in relation to the number of sleep hours / day were obtained based on a structured questionnaire through the question “What is your bedtime and wake time?” Based on this information, the following score was calculated: ((sleep hours from Monday to Friday x 4) + (number of sleep hours from Friday to Monday x 3)) / 721. he result was subsequently
cate-gorized into <eight hours of sleep / day and ≥ eight hours of sleep / day, since there is a direct relationship between few sleep hours (<8 hours / day) and increased health risk factors21.
he time spent watching TV, using the computer (PC) and video game (VG), was collected through six questions used in a study in Brazil22,
refer-ring to the number of hours and minutes of use of the equipment durefer-ring the periods from Monday to Friday and on weekends. For the deinition of total TV, PC and VG time, the sum of the number of hours during the week and weekends was divided by the seven days of the week. hese variables were later categorized into less than 4 hours / day of screen time and time greater than or equal to 4 hours / day of screen time, since periods above 4 hours / day are considered behaviors unsuitable for health and are associated with increased risk of cardiovascular diseases23. hese questions
regarding screen time presented good reliability and reproducibility in Brazilian adolescents (ICC = 0.76, 95% CI: 0.70-0.81, kappa = 0.52)22.
Overall physical activity was assessed by the following question of the Brazilian version of the Youth Risk Behavior Surveillance (YRBSS) questionnaire used in the United States, translated and validated for Bra-zil24: “During the past seven days, on how many days were you physically
active for at least 60 minutes a day? (Consider moderate and / or vigorous physical activity)”. his questioning had answers categorized as not meeting recommendations (zero to four days) and meets recommendations (ive days or more)25.
Associations between the dependent variable “combination of negative physical itness indicators” and other independent variables were analyzed using multinomial logistic regression, with odds ratio (OR) and conidence intervals (CI 95%), and category “without negative physical itness indi-cator” was considered as a reference. Interactions among all independent variables were tested; however, no statistical signiicance was detected for interactions. In the adjusted analysis between combination of negative physical itness indicators and sociodemographic and lifestyle variables, all variables were inserted at the same level, regardless of p value in the crude analysis, remaining in the model those with p value ≤ 0.20, according to the backward method. Moreover, such analyses were controlled by all independent variables tested in that model. For the evaluation of the inal model, a saturated model was estimated, so that the adjustment parame-ters could be compared to each other. In these comparisons, the multiple determination coeicient (R2), the Akaike Information Criterion (AIC)
and the Bayesian Information Criterion (BIC) were estimated. Signiicance level of p <0.05 was adopted for all statistical tests. Statistical analysis was performed using Stata 13.0 software (STATA Corp. College Station, Texas, USA), considering the sample weight and the design efect.
RESULTS
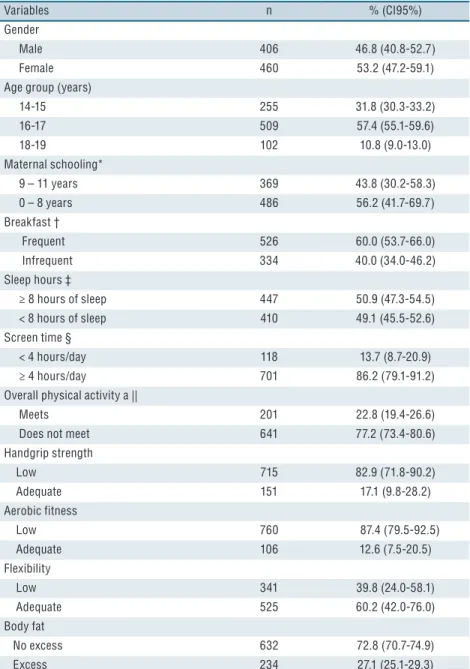
Of the 866 students evaluated in this research, nine out of ten (87.4%) had low aerobic itness and eight out of ten had low FPM levels (82.9%). A little less than two ifths of subjects had low lexibility (39.8%) and approximately one quarter had excess body fat (27.1%). he other sample characteristics are shown in Table 1.
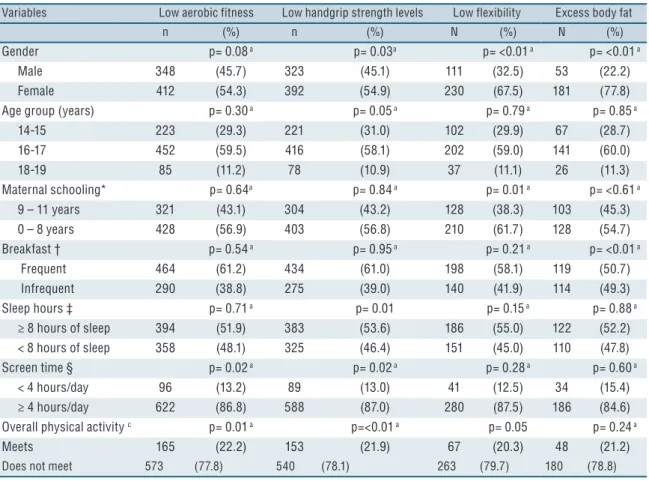
In relation to the low aerobic itness, higher prevalence was observed for individuals who remained 4 hours / day or more in front of the screen and who did not comply with recommendations regarding the practice of overall physical activity. In relation to the low FPM levels, higher preva-lence was observed in girls, in students who slept more than or equal to 8 hours / day and in those showing risk factor in relation to screen time (≥ 4 hours / day) and who did not meet recommendations regarding the practice of overall physical activity. For low lexibility, higher prevalence was observed for students whose mothers had higher schooling. Female adolescents presented higher prevalence of overweight (Table 2).
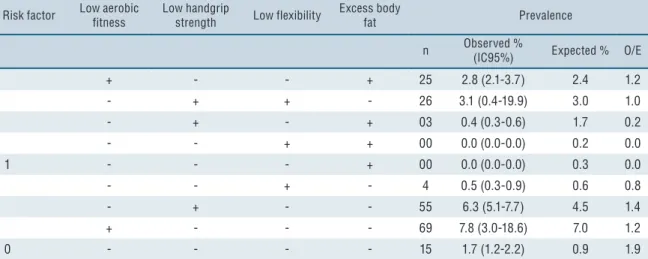
one risk factor, the most prevalent was low aerobic itness (7.8%) followed by low FPM (6.3%), with values 20% and 40% higher than expected. he prevalence observed for individuals without risk factor was 1.7%, 90% higher than expected (0.9%) (Table 3).
Table 1. Distribution of students from state public schools of São José, SC, Brazil, 2014.
Variables n % (CI95%)
Gender
Male 406 46.8 (40.8-52.7)
Female 460 53.2 (47.2-59.1)
Age group (years)
14-15 255 31.8 (30.3-33.2)
16-17 509 57.4 (55.1-59.6)
18-19 102 10.8 (9.0-13.0)
Maternal schooling*
9 – 11 years 369 43.8 (30.2-58.3)
0 – 8 years 486 56.2 (41.7-69.7)
Breakfast †
Frequent 526 60.0 (53.7-66.0)
Infrequent 334 40.0 (34.0-46.2)
Sleep hours ‡
≥ 8 hours of sleep 447 50.9 (47.3-54.5)
< 8 hours of sleep 410 49.1 (45.5-52.6)
Screen time §
< 4 hours/day 118 13.7 (8.7-20.9)
≥ 4 hours/day 701 86.2 (79.1-91.2)
Overall physical activity a ||
Meets 201 22.8 (19.4-26.6)
Does not meet 641 77.2 (73.4-80.6)
Handgrip strength
Low 715 82.9 (71.8-90.2)
Adequate 151 17.1 (9.8-28.2)
Aerobic fitness
Low 760 87.4 (79.5-92.5)
Adequate 106 12.6 (7.5-20.5)
Flexibility
Low 341 39.8 (24.0-58.1)
Adequate 525 60.2 (42.0-76.0)
Body fat
No excess 632 72.8 (70.7-74.9)
Excess 234 27.1 (25.1-29.3)
CI = confidence interval; a = physically active at least 60 minutes per day on five or more days of the week; * Variable with 11 missing data; † Variable with 6 missing data; ‡ Variable with 9 missing data § Variable with 47 missing data; || Variable with 24 missing data.
who presented screen time equal to or greater than 4 hours / day, when compared to those without negative physical itness indicator. Higher odds ratio of simultaneously presenting three negative physical itness indicators, compared to those with no negative indicators, were found in female stu-dents (OR: 7.5; 95% CI = 2.5-22.8). In addition, female stustu-dents and those who presented risk behavior in relation to screen time were approximately 19.5 and 8.8 times more likely of simultaneously presenting four negative physical itness indicators.
Table 2. Characteristics of negative physical fitness indicators according to sociodemographic and lifestyle variables of students from state public schools of São José, SC, Brazil, 2014.
Variables Low aerobic fitness Low handgrip strength levels Low flexibility Excess body fat
n (%) n (%) N (%) N (%)
Gender p= 0.08 a p= 0.03a p= <0.01 a p= <0.01 a
Male 348 (45.7) 323 (45.1) 111 (32.5) 53 (22.2)
Female 412 (54.3) 392 (54.9) 230 (67.5) 181 (77.8)
Age group (years) p= 0.30 a p= 0.05 a p= 0.79 a p= 0.85 a
14-15 223 (29.3) 221 (31.0) 102 (29.9) 67 (28.7)
16-17 452 (59.5) 416 (58.1) 202 (59.0) 141 (60.0)
18-19 85 (11.2) 78 (10.9) 37 (11.1) 26 (11.3)
Maternal schooling* p= 0.64a p= 0.84 a p= 0.01 a p= <0.61 a
9 – 11 years 321 (43.1) 304 (43.2) 128 (38.3) 103 (45.3)
0 – 8 years 428 (56.9) 403 (56.8) 210 (61.7) 128 (54.7)
Breakfast † p= 0.54 a p= 0.95 a p= 0.21 a p= <0.01 a
Frequent 464 (61.2) 434 (61.0) 198 (58.1) 119 (50.7)
Infrequent 290 (38.8) 275 (39.0) 140 (41.9) 114 (49.3)
Sleep hours ‡ p= 0.71 a p= 0.01 p= 0.15 a p= 0.88 a
≥ 8 hours of sleep 394 (51.9) 383 (53.6) 186 (55.0) 122 (52.2)
< 8 hours of sleep 358 (48.1) 325 (46.4) 151 (45.0) 110 (47.8)
Screen time § p= 0.02 a p= 0.02 a p= 0.28 a p= 0.60 a
< 4 hours/day 96 (13.2) 89 (13.0) 41 (12.5) 34 (15.4)
≥ 4 hours/day 622 (86.8) 588 (87.0) 280 (87.5) 186 (84.6)
Overall physical activity c p= 0.01 a p=<0.01 a p= 0.05 p= 0.24 a
Meets 165 (22.2) 153 (21.9) 67 (20.3) 48 (21.2)
Does not meet 573 (77.8) 540 (78.1) 263 (79.7) 180 (78.8)
a = Chi-square test; b = Minimum wage of R$ 724,00; c = physically active at least 60 minutes a day on five or more days of the week
Table 3. Prevalence of combination of negative physical fitness indicators in students from state public schools of São José, SC, Brazil, 2014.
Risk factor Low aerobic fitness Low handgrip strength Low flexibility Excess body fat Prevalence
n Observed % (IC95%) Expected % O/E
4 + + + + 87 9.9 (4.2-13.7) 7.8 1.3
3 + + + - 183 21.1 (11.5-35.5) 21.0 1.0
+ + - + 101 11.4 (8.5-15.2) 11.8 1.0
+ - + + 15 1.7 (1.0-2.7) 1.6 1.1
- + + + 03 0.4 (0.3-0.4) 1.1 0.4
2 + + - - 257 30.4 (20.4-39.8) 31.8 0.9
DISCUSSION
he main indings of this study were that students had high prevalence of
Risk factor Low aerobic fitness Low handgrip strength Low flexibility Excess body fat Prevalence
n Observed % (IC95%) Expected % O/E
+ - - + 25 2.8 (2.1-3.7) 2.4 1.2
- + + - 26 3.1 (0.4-19.9) 3.0 1.0
- + - + 03 0.4 (0.3-0.6) 1.7 0.2
- - + + 00 0.0 (0.0-0.0) 0.2 0.0
1 - - - + 00 0.0 (0.0-0.0) 0.3 0.0
- - + - 4 0.5 (0.3-0.9) 0.6 0.8
- + - - 55 6.3 (5.1-7.7) 4.5 1.4
+ - - - 69 7.8 (3.0-18.6) 7.0 1.2
0 - - - - 15 1.7 (1.2-2.2) 0.9 1.9
CI: Confidence interval; + presence of risk factor; - absence of risk factor; O: Prevalence observed; E: Prevalence expected; O / E: Ratio between observed and expected prevalence.
Table 4. Association between negative physical fitness indicators and sociodemographic and lifestyle variables of students from state public schools of São José, SC, Brazil, 2014.
One negative indicator a Two negative indicators a Three negative indicators a Four negative indicators a
n (%) RC (IC95%) n (%) RC (IC95%) n (%) RC (IC95%) n (%) RC (IC95%) Gender
Male 91 (70.4) 1 183 (55.1) 1 106 (34.9) 1 15 (16.9) 1
Female 37 (29.6) 1.3 (0.3-6.1) 151 (44.9) 2.9 (1.4-6.2) 196 (65.1) 7.5 (2.5-22.8) 72 (83.1) 19.5 (4.6-82.6) Age group
14-15 years 33 (25.4) 1 105 (31.7) 1 90 (29.5) 1 25 (26.3) 1
16-17 years 77 (60.2) 0.7 (0.1-.5.8) 188 (56.1) 0.3 (0.1-3.3) 178 (59.1) 0.4 (0.1-2.7) 56 (63.7) 0.4 (0.1-4.4) 18-19 years 18 (14.4) 0.5 (0.1-1.8) 41 (12.2) 0.3 (0.1-6.5) 34 (11.4) 0.3 (0.1-8.6) 6 (7.0) 0.2 (0.1-1.9) Maternal schooling
9-11 years 60 (47.3.) 1 141 (43.2) 1 130 (43.8) 1 31 (36.5) 1
0-8 years 66 (52.7) 0.7 (0.2-4.0) 188 (56.8) 1.4 (0.3-7.1) 169 (56.2) 1.2 (0.2-6.1) 55 (63.5) 1.5 (0.3-7.0) Breakfast
Frequent 84 (65.0) 1 215 (64.4) 1 171 (57.4) 1 47 (53.1) 1
Infrequent 44 (35.0) 1.0 (0.2-.13.1) 117 (35.6) 0.9 (0.1-11.1) 127 (42.6) 1.1 (0.5-27.8) 40 (46.9) 1.2 (0.6-26.3) Sleep hours
≥ 8 hours of sleep 60 (46.8) 1 173 (51.4) 1 161 (53.9) 1 49 (56.1) 1
< 8 hours of sleep 67 (53.2) 0.5 (0.3-1.1) 159 (48.6) 0.5 (0.4-6.5) 137 (46.1) 0.5 (0.4-7.3) 37 (43.9) 0.5 (0.1-7.1) Screen time
< 4 hours/day 25 (20.7) 1 36 (11.2) 1 41 (14.3) 1 10 (11.7) 1
≥ 4 hours/day 96 (79.3) 3.4 (1.3-8.6) 280 (88.8) 7.3 (2.1-25.8) 244 (85.7) 6.8 (0.7-64.8) 72 (88.3) 8.8 (3.9-19.9) Overall physical activity
Meets 41 (32.8) 1 83 (25.2) 1 58 (19.7) 1 13 (15.9) 1
Does mot meet 85 (67.2) 1.3 (0.3-5.3) 241 (74.8) 1.2 (0.2-8.3) 235 (80.3) 1.5 (0.2-11.3) 71 (84.1) 1.8 (0.4-7.8)
OR = Odds ratio; CI = confidence interval; a = Adjusted analysis for all independent variables; b = the reference category corresponds to no negative physical fitness indicator. The final model formed by variables gender, age, screen time and overall physical activity presented pseudo R2 = 0.0579; AIC = 10,062.18 and BIC = 10,171.65. In comparison to the subsaturated model (pseudo R2 = 0.0623, AIC = 10.031,75 and BIC = 10.177.70) and the null model (pseudo R2 = 0, AIC = 13.619,64, BIC = 13.638.69). By means of the likelihood ratio test, it was verified that the final model is approximate to the subsaturated model (p = 0.58) and different from the null model (p = <0.01).
negative physical itness indicators. he observed prevalence of simultaneity of four negative physical itness indicators was 30% higher than expected. In addition, approximately nine out of ten students had simultaneously one or more negative physical itness indicators. Female students were more likely to have simultaneously two, three and four negative physical itness indicators. In addition, it was veriied that to have risk behavior in relation to screen time was associated with the simultaneous presence of one, two and four negative physical itness indicators.
Regarding the prevalence of negative physical itness indicators in the population-based study conducted in Canada with students similar to the present study, lower values in relation to the prevalence of low aero-bic itness, low FPM levels and excess body fat and higher values for the prevalence of low lexibility were found3. In another study conducted with
adolescents in the city of Florianópolis, Brazil, lower prevalence was veri-ied for body fat, muscular itness and aerobic itness compared to results veriied in this study10. In the study that gathered information regarding
the aerobic itness levels of children and adolescents from 27 countries, an annual decline of 0.36% in the levels of this component was observed during the period from 1958 to 200326. In another study carried out with
a representative sample of children and adolescents in Canada, there was a decrease in the FPM levels in the period from 1981 to 20083. In addition,
the consumption of industrialized foods rich in empty calories by children and adolescents27 is increasing, which directly contributes to increase body
fat, and these factors (decline in aerobic itness, FPM levels and consump-tion of processed foods rich in empty calories) could possibly justify the high prevalence of low aerobic itness, low FPM levels and excess body fat identiied in the study.
Despite the lower values regarding the prevalence of low lexibility levels, in the present study, 39.8% of students presented low lexibility, a result that should be analyzed with care by health managers, since low lex-ibility levels in adolescents are inversely associated with motor competence, which may negatively relect the performance in sports and other physical itness indicators7. In addition, in the present study, girls presented higher
prevalence of low lexibility compared to boys, results that diverge from indings in literature3. A possible justiication for these indings is the
cutof point adopted by the test battery used in the present study, with a higher value for the classiication of lexibility in girls in relation to boys. Such classiication had a Canadian population as reference and may not be suitable for individuals from other countries such as Brazil. However, the use of cutof points of the applied instrument is justiied, since in ad-dition to providing classiication for lexibility and other physical itness indicators in isolation according to sex and age, the values obtained in each test alone are attributed to a score that allows classifying the individual in relation to the general physical itness level1.
physical itness indicators. hese indings should be carefully observed by health managers, since in addition to the fact that behaviors adopted during adolescence tend to remain during adult life, negative physical itness indicators are directly associated with chronic non-communicable diseases, which in turn represent the highest cause of mortality world-wide14. Moreover, the identiication of the highest prevalence observed
in relation to that expected for the simultaneity of four negative physical itness indicators is of concern, since the negative health efect due to the combination of diferent negative indicators tends to be greater than the exposure to only one Indicator12. hus, the indings of the present study
reinforce the need to carry out interventions that take into account factors related to the combination of negative physical itness components such as restricting the period that adolescents spend in sedentary behavior aiming at improving these physical itness indicators14.
Approximately nine out of 10 students had one or more negative physi-cal itness indicators simultaneously. hese results corroborate indings in literature, which veriied high prevalence of students with negative physical itness indicators3,9. A survey conducted in a city in southern Brazil with
students of the same age group as the present study found that 75.4% of boys and 88.5% of girls presented low physical itness in at least one physical itness indicator (body composition, muscle and cardiorespiratory itness). he increasing urbanization of developing countries such as Brazil has been directly related to the presence of negative physical itness indicators11,
considering the reduction of spaces for the practice of physical activity and sports. In addition, higher age (> 13 years) among adolescents was directly associated with lower participation in sports, which may have contributed to the high prevalence of individuals with one or more negative physical itness indicators28.
he population subgroup most prevalent for the simultaneity of two, three and four negative physical itness indicators was composed of female students. Other surveys have also shown lower performance of women in relation to physical itness indicators5,8. During systematic (regular)
physical activity, physiological adaptations such as cardiac hypertrophy and increase in the number of oxygen and organic transporters, such as increased muscle recruitment, increased joint mobilization and increased energy expenditure are generated, and the lower involvement in physical activity of girls (18.8%) compared to boys (27.6%) in the present study (data not shown) could imply lower magnitude of these adaptations, relecting worse prognoses regarding aerobic itness, muscular strength, lexibility and body fat29.
Students who were at risk for screen time were more likely to have one, two, and four negative physical itness indicators simultaneously. he long period in front of the screen is associated with increased caloric intake and excess body fat23, which in turn is directly related to lower maximum
oxygen consumption and low aerobic itness levels30. In addition, body
the organism14, which may contribute to a decrease in muscular strength
levels and lexibility29.
he results identiied in the present study in relation to the high preva-lence of students who individually and simultaneously presented negative physical itness indicators should be observed with caution, since the large number of cutof points used to classify physical itness indicators indicate a lack of consensus on the standardization to be used1,2,6,9. hus, further
studies should be carried out to determine speciic cutof points based on reference parameters in order to allow the comparison of results.
he insuicient statistical power of the sample to test some associations (age, maternal schooling, breakfast and sleep hours) is a study limitation, and future studies with adjustments in relation to the sample size are nec-essary to allow the extrapolation of results for the population of interest. However, it should be highlighted that this study followed methodological strictness by means of previous training of the team and the use of validated instruments for data collection, which provide reliability to results. An-other study limitation was the use of cutof points developed in countries other than Brazil. he collection of information regarding aspects related to lifestyle was carried out by means of a questionnaire, which allows a response bias, is also considered a limitation of the present investigation, as well as the cross-sectional design, which prevents the establishment of causal relationships. However, the present study presents contributions to the health area, as it identiied subgroups susceptible to the simultaneity of negative physical itness indicators, which allows prioritizing these individuals in terms of strategies aimed at the maintenance of adequate physical itness indicators. Interventions in the school environment such as increasing the number of physical education classes, encouraging sports practices through extracurricular projects, lectures for adolescents, parents and tutors regarding the importance of maintaining healthy habits can positively contribute to physical itness indicators.
CONCLUSIONS
It could be concluded that the observed prevalence of students who simul-taneously presented four negative indicators of physical itness was 30% higher than expected. In addition, approximately nine out of ten students had simultaneously one or more negative physical itness indicators and being female and risk behavior in relation to screen time were the factors associated with the simultaneity of negative physical itness indicators.
REFERENCES
1. CSEP. he Canadian Physical Activity, Fitness and Lifestyle Approach (CPAFLA) CSEP - Health and Fitness Program’s Health-Related Appraisal and Counselling Strategy: Canadian Society for Exercise Physiology; 2003.
3. Tremblay MS, Shields M, Laviolette M, Craig CL, Janssen I, Gorber SC. Fitness of Canadian children and youth: results from the 2007-2009 Canadian Health Measures Survey. Health Rep 2010;21(1):7-20.
4. Feign VL, Forouzanfar MH, Krishnamurthi R, Mensah GA, Connor M, Ben-nett DA, et al. Global Burden of Diseases, Injuries, and Risk Factors Study 2010 (GBD 2010) and the GBD Stroke Experts Group. Global and regional burden of stroke during 1990-2010: indings from the global burden of disease study 2010. Lancet 2014;383(9913):245-54.
5. Clark BR, White ML, Royer NK, Burlis TL, DuPont NC, Wallendorf M, et al. Obesity and aerobic itness among urban public school students in elementary, middle, and high school. PloS One 2015;10(9):e0138175.
6. Esteban-Cornejo I, Tejero-González CM, Martinez-Gomez D, Del-Campo J, González-Galo A, Padilla-Moledo C, et al. Independent and combined inluence of the components of physical itness on academic performance in youth. J Pediatr 2014;165(2):306-12.
7. Lopes L, Póvoas S, Mota J, Okely A, Coelho-e-Silva M, Clif D, et al. Flexibility is associated with motor competence in schoolchildren. Scand J Med Sci Sports 2016. [Epub ahead of print]
8. Welk GJ, Saint-Maurice PF, Csányi T. Health-related physical itness in Hungarian youth: Age, sex, and regional proiles. Res Q Exerc Sport 2015;86(sup1):S45-S57.
9. Minatto G, Petroski EL, Silva DAS. Exposure to concomitant low health-related physical itness components and associated sociodemographic factors in Brazilian adolescents. Hum Mov 2012;13(4):303-12.
10. Petroski EL, Silva DAS, De Lima ES, Pelegrini A. Health-related physical it-ness and associated sociodemographic factors in adolescents from a Brazilian state capital. Hum Mov 2012;13(2):139-46.
11. Petroski EL, Silva A, Rodrigues AB, Pelegrini A. Associação entre baixos níveis de aptidão física e fatores sociodemográicos em adolescentes de área urbanas e rurais. Motri 2012;8(1):5-13.
12. Cuenca-García M, Huybrechts I, Ruiz JR, Ortega FB, Ottevaere C, González-Gross M, et al. Clustering of multiple lifestyle behaviors and health-related itness in European adolescents. J Nutr Educ Behav 2013;45(6):549-57.
13. Schuit AJ, van Loon AJM, Tijhuis M, Ocké MC. Clustering of lifestyle risk factors in a general adult population. Prev Med 2002;35(3):219-24.
14. Andersen LB, Mota J, Di Pietro L. Update on the global pandemic of physical inactivity. Lancet 2016;388(10051):1255.
15. United Nations, 2013. Available from: www.pnud.org.br/IDH/Atlas2013. aspx?indiceAccordion=1&li=li_Atlas2013 (Acess on 18 Dec. 2016).
16. Silva DA, Tremblay MS, Pelegrini A, Silva RJ, Cabral de Oliveira AC, Petroski EL. Association Between Aerobic Fitness And High Blood Pressure in Adoles-cents in Brazil: Evidence for Criterion-Referenced Cut-Points. Pediatr Exerc Sci 2016;28(2)312-20.
17. Weller IM, homas SG, Gledhill N, Paterson D, Quinney A. A study to validate the modiied Canadian Aerobic Fitness Test. Can J Appl Physiol 1995;20(2):211-21.
18. Lohman T. he use of skinfold to estimate body fatness on children and youth. Am J Health Educ 1987;58(9):98-103.
19. Rodriguez Añez CR, Reis RS, Petroski EL. Brazilian version of a lifestyle questionnaire: translation and validation for young adults. Arq Bras Cardiol 2008;91(2):92-8.
20. Shaiee G, Kelishadi R, Qorbani M, Motlagh ME, Taheri M, Ardalan G, et al. Association of breakfast intake with cardiometabolic risk factors. J Pediatr 2013;89(6):575-82.
CORRESPONDING AUTHOR
Diego Augusto Santos Silva Universidade Federal de Santa Catarina
Centro de Desportos, Departamento de Educação Física
Campus Universitário –Trindade – Caixa Postal 476.
CEP 88040-900 – Florianópolis/ SC, Brasil.
E-mail: diegoaugustoss@yahoo. com.br
22. Oliveira Martins M, Cavalcante VLF, dos Santos Holanda G, de Oliveira CG, Maia FES, de Meneses Júnior JR, et al. Associação entre comportamento sedentário e fatores psicossociais e ambientais em adolescentes da região nordeste do Brasil. Rev Bras Ativ Fis Saúde 2012;17(2):143-50.
23. Wijndaele K, Brage S, Besson H, Khaw K-T, Sharp SJ, Luben R, et al. Television viewing time independently predicts all-cause and cardiovascular mortality: the EPIC Norfolk study. Int J Epidemiol 2011;40(1):150-9.
24. Guedes DP, Lopes CC. Validação da versão brasileira do Youth Risk Behavior Survey 2007. Rev Saúde Pública 2010;44(5):840-50.
25. Strong WB, Malina RM, Blimkie CJ, Daniels SR, Dishman RK, Gutin B, et al. Evidence based physical activity for school-age youth. J Pediatr 2005;146(6):732-7.
26. Tomkinson GR, Olds TS. Secular changes in pediatric aerobic itness test perfor-mance: the global picture. Med Sport Sci 2007;(50):46-66
27. Larson N, Story M, Eisenberg ME, Neumark-Sztainer D. Secular Trends in Meal and Snack Patterns among Adolescents from 1999 to 2010. J Acad Nutr Diet 2016;116(2):240-50.
28. Coledam DHC, Ferraiol PF, Pires Junior R, Santos JW, Oliveira AR. Prática es-portiva e participação nas aulas de educação física: fatores associados em estudantes de Londrina, Paraná, Brasil. Cad Saúde Pública 2014;30(3):533-45.
29. Pontzer H, Durazo-Arvizu R, Dugas LR, Plange-Rhule J, Bovet P, Forrester TE, et al. Constrained total energy expenditure and metabolic adaptation to physical activity in adult humans. Curr Biol 2016;26(3):410-7.