DOI: http://dx.doi.org/10.5007/1980-0037.2017v19n5p545
Prediction of cardiorespiratory itness from
self-reported data in elderly
Predição da aptidão cardiorrespiratória através de dados
auto-relatados em idosos
Geraldo A Maranhao Neto1
Aldair J Oliveira1,2
Rodrigo Pedreiro1
Silvio Marques Neto1,3
Leonardo G Luz4
Henrique C Silva3
Paulo TV Farinatti1,5
Abstract – Cardiorespiratory itness (CRF) is associated with several health outcomes. Some non-exercise equations are available for CRF estimation. However, little is known about the validation of these equations among elderly. he aim of this study was to exam the validity of non-exercise equations with self-reported information in elderly. Participants (n= 93) aged 60 to 91 years measured CRF using maximal cardiopulmonary exercise test. Five non-exercise equations were selected. Data included in the equations (age, sex, weight, height, body mass index, physical activity and smoking) were self-reported. Coeicient of determination (R2) of linear regressions with laboratory-measured VO
2 peak ranged from
0.04 to 0.64. he Bland-Altman plots showed higher agreement between achieved and predicted CRF obtained by Jackson and colleagues, and Wier and colleagues equations. On the other hand, the other equations showed lower agreement and overestimation. Our indings provide evidences that two non-exercise equations, previously developed, could be used on the prediction of CRF among elderly.
Key words: Physical itness; Regression Analysis; Aged .
Resumo – A aptidão cardiorrespiratória (ACR) está associada a vários desfechos de saúde. Algumas equações sem exercício estão disponíveis para estimar a ACR. No entanto, pouco se sabe sobre a validação dessas equações entre os idosos. Objetivo: O estudo foi desenvolvido com o objetivo de examinar a validade de equações sem exercício com informações auto-relatadas em idosos. Métodos: Os participantes (n = 93) com idades entre 60 e 91 anos foram submetidos ao teste de exercício cardiopulmonar máximo para avaliar a ACR. Cinco equações sem exercício foram selecionadas. Os dados incluídos nas equações (idade, sexo, peso, altura, índice de massa corporal, atividade física e tabagismo) foram auto-relatados. Resultados: O coeiciente de determinação
(R2) das regressões lineares com o VO
2 pico, medido em laboratório, variou de 0,04 a 0,64. Os
gráicos de Bland-Altman mostraram maior concordância entre a ACR obtida e prevista por Jackson e colaboradores, e equações de Wier e colaboradores. Por outro lado, as demais equações mostraram menor concordância e superestimação. Conclusões: Nossos resultados fornecem evi-dências de que duas equações sem exercício, previamente desenvolvidas, poderiam ser usadas na
1 Universidade Salgado de Oliveira. Laboratório de Ciências da Atividade Física. Programa de Pós Graduação em Ciências da Atividade Física. Niterói, RJ. Brasil.
2 Universidade Federal Rural do Rio de Janeiro. Departamento de Educa-ção Física e Desportos. Seropédica, RJ. Brasil.
3 Universidade do Grande Rio. Rio de Janeiro, RJ. Brasil.
4 Universidade Federal de Alagoas. Laboratório de Cineantropometria, Atividade Física e Promoção da Saúde. Maceió, AL. Brasil.
5 Universidade do Estado do Rio de Janeiro. Laboratório de Atividade Física e Promoção da Saúde. Rio de Janeiro, RJ. Brasil.
Cardiorespiratory fitness in elderly Maranhã Neto et al.
INTRODUCTION
Cardiorespiratory itness (CRF) has been linked to numerous health condi-tions, including coronary heart disease1, stroke2, high blood pressure3 and all-cause mortality4. In fact, low levels of CRF reduce the overall eiciency of the cardiovascular system. Additionally, CRF is directly associated with muscle strength5 and lexibility6 and inversely associated with age7.
here are diferent strategies to evaluate the CRF. he most accurate one is to determinate objectively CRF using progressive tests of maximum efort with the direct oxygen consumption measured (VO2max). his form of measurement is considered the “gold standard”. However, in large populations this method shall not be indicated due to the high costs for im-plementation and time spent on test. CRF can also be estimated by indirect tests that typically use physical exercise concomitantly with equations which estimate CRF based on information such as predicted maximum heart rate (e.g. 220 – age), age, sex. Despite the indirect tests having less accurate results than direct ones, they require a lower cost and logistic involved to their achievement. An interesting alternative to evaluate the CRF would be through prediction model without performing exercises. his method was developed with the application of multiple regression equations containing information on the weight, height, sex, age and lifestyle habits related to CRF. When compared to the maximal tests, the results are less accurate, however, when compared to submaximal tests presents similar estimate of power and greater applicability in more numerous sample groups8.
he assessment of the CRF is an important physiological indicator of the functional capacity among elderly9. However, the application of exercise tests in elderly may be limited due to orthopedic problems and a high prevalence of frailty in this population10. he use of non-exercise equa-tion for CRF evaluaequa-tion could be a reasonable alternative. In this context, identifying a simple, lower-cost and lower risk alternative assessment of CRF would be of considerable importance to evaluate elderly.
he non-exercise equations have been an important alternative to eas-ily predict the CRF by means of regression-based equations that usually include variables of simple and quick assessment, such as anthropometric measures, demographic characteristics, and daily life habits11,12. In this sense, several authors13-16 have developed equations using only self-reported data which have the advantages of been practicality and a low-cost alter-native. However, the validation attributes of these non-exercise equations were not further investigated among elderly. herefore, the study was designed with the aim of examining the validity of self-reported non-exercise equations in elderly.
METHODOLOGICAL PROCEDURES
Subjects
en-evaluation including maximal exercise cardiopulmonary test, a wide ki-nanthropometric evaluation and a clinical investigation, performed by specialized physicians before starting the exercise program. In addition, they also illed in the questionnaire about physical activity level. Individuals presenting one or more of the following conditions were excluded: a) stable or rest angina pectoris; b) paroxysmal or complex ventricular arrhythmias; c) acute myocarditis or pericarditis; d) atrioventricular block of high-grade and low ventricular rate; e) acute myocardial infarction within the previous two years; f) severe aortic stenosis; g) severe hypertension or reactive to exercise one; h) important injury on the left main coronary artery; i) his-tory of pulmonary embolism, j) any acute disease, k) physical or emotional limitations, l) drug intoxication; m) inability to understand the proposed procedures and n) orthopedic problems that incapacitate the individual to the participate or could be made worse by it. hus, the study had the par-ticipation of 93 individuals (54 men and 39 women ranged 60 to 91 years old) that written informed consent was obtained from all participants, and the research protocols were approved by the Ethics Committee of Social Medicine Institute (CEP-IMS) from the Rio de Janeiro State University. he research was conducted in Rio de Janeiro State University.
Procedures
he physical activity level was assessed using a Brazilian Portuguese ver-sion of the Physical Activity Rating (PA-R). he PA-R is a progressive scale with scores from 0 to 10 in which must be signaled the most suitable option to the physical activity history in the last 30 days. Individuals with “zero score” were classiied as “physically inactive”; those with 1 point as “slightly active”; those from 2 to 3 as “moderately active” and those with 4 points or more on the levels were moderate to high intensity. Detailed information about the procedure is available in a previous publication17.
Cardiorespiratory fitness in elderly Maranhã Neto et al.
maximum voluntary exhaustion. here was no limit imposed on the value of heart rate (HR) to be achieved.
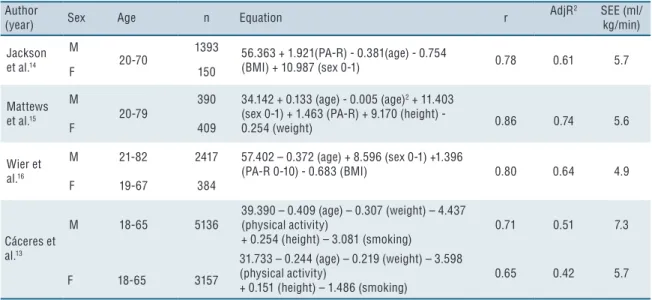
In order to assess the non-exercise equations which would be ap-plied in the study, we used the literature search. In this sense, inclusion criteria were adopted for the selection, as follows: (1) included elderly in their sample, (2) validation of models through maximum efort tests with direct oxygen consumption measured (“Gold Standard”), (3) provided relevant information regarding the models adjustments (at least R square and standard error of estimate - SEE), (4) include variables not only for its statistical signiicance, but for its theoretical justiication. his strategy was used in a previous study19. In addition, the models should include variables that could be self-reported by the respondent. he selected equations are shown in Table 1 along with their respective standard error of estimate (SEE), correlation and determination coeicients (R2).
Table 1. Non-exercise Models Included in the present study.
Author
(year) Sex Age n Equation r
AdjR2 SEE (ml/ kg/min)
Jackson et al.14
M
20-70
1393 56.363 + 1.921(PA-R) - 0.381(age) - 0.754
(BMI) + 10.987 (sex 0-1) 0.78 0.61 5.7
F 150
Mattews et al.15
M
20-79
390 34.142 + 0.133 (age) - 0.005 (age)2 + 11.403 (sex 0-1) + 1.463 (PA-R) + 9.170 (height) -
0.254 (weight) 0.86 0.74 5.6
F 409
Wier et al.16
M 21-82 2417 57.402 – 0.372 (age) + 8.596 (sex 0-1) +1.396
(PA-R 0-10) - 0.683 (BMI) 0.80 0.64 4.9
F 19-67 384
Cáceres et al.13
M 18-65 5136
39.390 – 0.409 (age) – 0.307 (weight) – 4.437 (physical activity)
+ 0.254 (height) – 3.081 (smoking)
0.71 0.51 7.3
F 18-65 3157
31.733 – 0.244 (age) – 0.219 (weight) – 3.598 (physical activity)
+ 0.151 (height) – 1.486 (smoking)
0.65 0.42 5.7
r- multiple correlation coefficient; Adj – adjusted; R2- Coefficient of determination; SEE-Standard Error of Estimate; M-male; F- female; sex: female=0 male=1;PA-R – Physical Activity Rating; physical activity: sedentary=0; active=1; BMI-Body Mass Index
Statistics Analysis
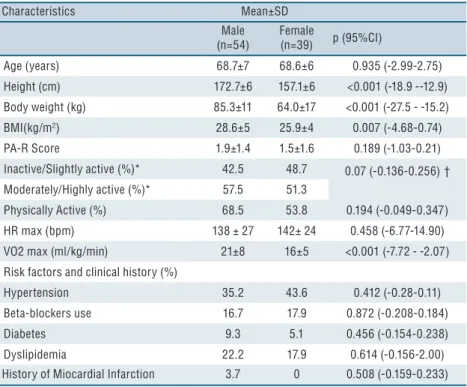
A summary of the descriptive statistics for all variables according to sex were included in Table 2. It is also provides results from the signiicance tests. In this line, signiicantly (p<0.05) diferences were detected across sex in the following variables: height, weight, BMI, and VO2 max. More details can be seen in Table 2.
Table 2. Physical and demographic characteristics of participants (n = 93).
Characteristics Mean±SD
Male (n=54)
Female
(n=39) p (95%CI)
Age (years) 68.7±7 68.6±6 0.935 (-2.99-2.75)
Height (cm) 172.7±6 157.1±6 <0.001 (-18.9 --12.9)
Body weight (kg) 85.3±11 64.0±17 <0.001 (-27.5 - -15.2)
BMI(kg/m2) 28.6±5 25.9±4 0.007 (-4.68-0.74)
PA-R Score 1.9±1.4 1.5±1.6 0.189 (-1.03-0.21)
Inactive/Slightly active (%)* 42.5 48.7 0.07 (-0.136-0.256)†
Moderately/Highly active (%)* 57.5 51.3
Physically Active (%) 68.5 53.8 0.194 (-0.049-0.347)
HR max (bpm) 138 ± 27 142± 24 0.458 (-6.77-14.90)
VO2 max (ml/kg/min) 21±8 16±5 <0.001 (-7.72 - -2.07)
Risk factors and clinical history (%)
Hypertension 35.2 43.6 0.412 (-0.28-0.11)
Beta-blockers use 16.7 17.9 0.872 (-0.208-0.184)
Diabetes 9.3 5.1 0.456 (-0.154-0.238)
Dyslipidemia 22.2 17.9 0.614 (-0.156-2.00)
History of Miocardial Infarction 3.7 0 0.508 (-0.159-0.233)
*Generated from PA-R Score; BMI: body mass index; PA-R-Physical Activity Rating; HR max: maximum resting heart rate; SD: standard deviation; VO2 max: maximal oxygen consumption;†difference between Inactive/Slightly active and Moderately/Highly active; p: p-value; significant for p<0.05; CI: confidence interval.
he results of the simple linear regressions relating laboratory-measure VO2 MAX and VO2 max based on non-exercise equations are shown in Table 3. he model which used VO2 max estimated by Matthews et al.15 explained 64% of the variance in laboratory-measure VO2max. However, there was a 12% drop in the determination coeicient. On the other hand, the models developed by Jackson et al.14 and Wier et al.16 showed only a 3% and 5% drop, respectively. he CRF estimated by Cáceres et al.13 equations explained only 17% for men and 4% for women.
Cardiorespiratory fitness in elderly Maranhã Neto et al.
Table 3. Coefficients of correlation and determination and standard error of estimate (SEE) from simple linear regressions between cardiopulmonary fitness estimated by equations (independent variable) and laboratory-measure VO2 max.
Author (Year) r Adj R2 SEE
(ml/kg/min)
Jackson et al.14 0.76 0.57 4.6
Mathews et al.15 0.79 0.64 4.4
Wier et al.16 0.77 0.58 4.6
Cáceres et al.13 Men 0.43 0.17 7.8
Cáceres et al.13 Women 0.22 0.04 4.7
r- correlation coefficient; Adj – adjusted; R2- Coefficient of determination; SEE- standard error of estimate
Figure 1. Bland Altman Plot between Achieved and Predicted ACR
he present study examined the validation of ive non-exercise equations (e.g., Jackson et al.14, Wier et al.16 and Matthews et al.15, Cáceres et al.13 for men and women) on predicting CRF in Brazilian elderly. Our results showed reasonable indications of two equations: Jackson et al.14 and Wier et al.16 which could be helpful on the determination of CRF among elderly. On the other hand, the other three equations showed weaker validation performance, and consequently, and should be avoided in this group. In fact, Jackson et al.14 and Wier et al.16 had alreadly suggested that their equation could be more accurate for low it subjects and people older than 50 years. his study is the irst to assess the validity of only self-reported non-exer-cise models in elderly. Mailey et al.20 tested the validity of the model proposed by Jurca et al.21 in an elderly sample (60-80 years). he model included the variables sex, age, BMI, self-reported physical activity and resting heart rate (R2 adjusted=0.51). Maranhão Neto et al.22 developed a model in a sample of 60-91 year, including the variables age, self-reported itness and relative handgrip strength (R2 adjusted=0.79). Variables such as resting heart rate and handgrip strength demand appropriate equipment and preparation, which limit the applicability of the models in population-based studies. Speciically, the heart rate responses could be afected by hypertensive medications and the handgrip test demand “motivation” from the subjects.
Our predictive values were slightly lower than the laboratory-measured CRF for most equations. Some explanations for these indings could be pos-tulated. First, our sample was smaller than the ones in which the original equations were developed. Second, given that the equations were validated for a large age spectrum, it is plausible to consider that the precision of the estimates may not be identical in diferent age groups.
Taking into account the Bland-Altman plots, Jackson et al.14 and Wier et al.16 equations had most of the points around zero highlighting a reasonable validation without bias. Both equations used easily self-report information (e.g., age, sex, weight, height and physical activity) and could be used in a population approach. On the other hand, the Bland-Altman plots of the other equations showed overestimation bias. hese indings reinforce the importance of comparing equations, even though they use similar variables, aiming to access accurately CRF.
Although the equation developed by Matthews et al.15 explained 64% of the laboratory-measure VO2 MAX variability, Bland-Altman plots revealed an overestimation, and consequently, the lower accuracy of this equation on estimate VO2 MAX in this group.
hrough this research we found that many studies have been performed in order to estimate CRF without exercise for the general population. he main advantages found in this alternative are the lowest cost, the easier applicability and the speed of data acquisition, mainly in large populations19.
sys-Cardiorespiratory fitness in elderly Maranhã Neto et al.
tematically lower. All the original equations were validated against VO2 max obtained from maximal treadmill tests treadmill tests which are known to engage larger muscle mass and therefore elicit higher VO2 values23. he adoption of a cycloergometer maximal exercise testing protocol to assess the CRF is justified, mainly for safety reasons24,25.
Further, the indings of the study should be observed carefully due to the speciic sample. he subjects were interested in engaging in project which involves physical activities and may present higher values of CRF compared with the general population. In this sense, it is not possible to state that the performance of these equations would be the same in other populations.
he use of non-exercise equations in elderly has two major justiica-tions: (1) the physical health problems which may limit the participation in exercise tests26; (2) even in people without physical impairments, the exercise tests could not be feasible due to high-cost, especially in low- and middle-income countries.
CONCLUSION
his research provides evidence to support the use of a low-cost procedure of estimating CRF based on two equations previously developed (e. g. Jackson et al. (1990)14 and Wier et al.(2006)16). he prediction does not involve any exercise testing, it provides reasonable estimates of CRF, and could be useful in research settings. Future studies should address whether non-exercise equations based on self-reported data could be used to follow changes in CRF of elderly.
Acknowledgments
he authors report no declarations of interest. his study was partially supported by grants from the Brazilian Council for the Technological and Research Development (CNPq), National Council for the Improve-ment of Higher Education (CAPES) and Carlos Chagas Foundation for the Research Support in the State of Rio de Janeiro (FAPERJ) no. E-26/203.237/2016.
REFERENCES
1. Pacheco MM, Teixeira LA, Franchini E, Takito MY. Functional vs. Strength training in adults: speciic needs deine the best intervention. Int J Sports Phys her 2013;8(1):34-43.
2. Cadore EL, Casas-Herrero A, Zambom-Ferraresi F, Idoate F, Millor N, Gomez M, et al. Multicomponent exercises including muscle power training enhance muscle mass, power output, and functional outcomes in institutionalized frail nonagenarians. Age 2014;36(2):773-85.
3. Milton D, Porcari JP, Foster C, Gibson M, Udermann B. he efect of functional exercise training on functional itness levels of older adults. Gund Lutheran Med J 2008;5(1):4–8.
CORRESPONDING AUTHOR Geraldo de Albuquerque Maranhão Neto
Universidade Salgado de Oliveira Pós Graduação em Ciências da Atividade Física
Rua Marechal Deodoro, 263, Centro - Niterói/RJ. Brasil
CEP: 24030-060
E-mail: [email protected]
biomechanical mechanism of how strength and power training improves walking speed in old adults remains unknown. Ageing Res Rev 2013;12(2):618-27.
7. de Vreede PL, Samson MM, van Meeteren NL, van der Bom JG, Duursma SA, Verhaar HJ. Functional tasks exercise versus resistance exercise to improve daily function in older women: a feasibility study. Arch Phys Med Rehabil 2004;85(12):1952-61.
8. Minick KI, Kiesel KB, Burton L, Taylor A, Plisky P, Butler RJ. Interrater reli-ability of the functional movement screen. J Strength Cond Res 2010;24(2):479-86.
9. Da-Silva Grigoletto ME, Brito CJ, Heredia JR. Functional training: functional for what and for whom? Rev Bras Cineantropom Desempenho Hum 2014;16(6):714-9.
10. Reid KF, Fielding RA. Skeletal muscle power: a critical determinant of physical functioning in older adults. Exerc Sport Sci Rev 2012;40(1):4-12.
11. Sayers SP, Guralnik JM, hombs LA, Fielding RA. Efect of leg muscle contrac-tion velocity on funccontrac-tional performance in older men and women. J Am Geriatr Soc 2005;53(3):467-71.
12. homas JR, Nelson JK, Silverman SJ. Métodos de pesquisa em atividade física, 5ª Ed. Porto Alegre: ArtMed, 2007.
13. Da-Silva Grigoletto ME, Viana-Montaner B, Heredia J, Mata Ordóñez F, Peña G, Brito C, et al. Validación de la escala de valoración subjetiva del esfuerzo OMNI-GSE para el control de la intensidad global en sesiones de objetivos múltiples en personas mayores. Kronos 2013;12(1): 32-40.
14. Ribeiro AC, Oliveira KES, Rodrigues ML, Costa TH, Schmitz BA. Validação de um questionário de freqüência de consumo alimentar para população adulta. Rev Nutr 2006;19(5): 553-62.
15. Folstein MF, Folstein SE, McHugh PR. “Mini-mental state”. A practical method for grading the cognitive state of patients for the clinician. J Psychiatr Res 1975;12(3):189-98.
16. Fleck MP, Louzada S, Xavier M, Chachamovich E, Vieira G, Santos L, et al. Apli-cação da versão em português do instrumento abreviado de avaliação da qualidade de vida” WHOQOL-bref”. Rev Saude Publica 2000;34(2):178-83.
17. Cook G, Burton L, Hoogenboom BJ, Voight M. Functional movement screen-ing: the use of fundamental movements as an assessment of function - part 1. Int J Sports Phys her 2006;9(3):396-409.
18. Cook G, Burton L, Hoogenboom BJ, Voight M. Functional movement screening: the use of fundamental movements as an assessment of function-part 2. Int J Sports Phys her 2014;9(4):549-63.
19. Cohen J. hings I have learned (so far). Am psychol 1990;45(12):1304.
20. Krebs DE, Scarborough DM, McGibbon CA. Functional vs. strength training in disabled elderly outpatients. Am J Phys Med Rehabil 2007;86(2):93-103.
21. Bassey EJ, Fiatarone MA, O’Neill EF, Kelly M, Evans WJ, Lipsitz LA. Leg extensor power and functional performance in very old men and women. Clin Sci 1992;82(3):321-7.
22. Byrne C, Faure C, Keene DJ, Lamb SE. Ageing, Muscle Power and Physical Func-tion: A Systematic Review and Implications for Pragmatic Training Interventions. Sports Med 2016;46(9):1311-32.
23. Pucci GCMF, Rech CR, Fermino RC, Reis RS. Associação entre atividade física e qualidade de vida em adultos. Rev Saude Publica 2012;46(1):166-79.
24. De Oliveira Leal SM, da Silva Borges EG, Fonseca MA, Junior EDA, Cader S, Dantas EHM. Efeitos do treinamento funcional na autonomia funcional, equilíbrio e qualidade de vida de idosas. Rev Bras Cienc Mov 2010;17(3):61-9.
25. Whitehurst MA, Johnson BL, Parker CM, Brown LE, Ford AM. he beneits of a functional exercise circuit for older adults. J Strength Cond Res 2005;19(3):647-51.