Geospatial analysis applied
to epidemiological studies of
dengue: a systematic review
Análise geoespacial aplicada em
estudos epidemiológicos de dengue:
uma revisão sistemática
Maria Aparecida de OliveiraI
Helena RibeiroI
Carlos Castillo-SalgadoII
IDepartment of Environmental Health, School of Public Health, Universidade de
São Paulo – São Paulo (SP), Brazil.
IIDepartment of Epidemiology, Bloomberg School of Public Health, Johns
Hopkins University – Baltimore (MD), USA.
Corresponding author: Helena Ribeiro. Departamento de Saúde Ambiental, Faculdade de Saúde Pública, Universidade de São Paulo. Avenida Doutor Arnaldo, 715, Cerqueira César, CEP: 01246-904, São Paulo, SP, Brazil. E-mail: [email protected]
Conlict of interests: nothing to declare.
Abstract
A systematic review of the geospatial analysis methods used in the dengue fever studies published between January 2001 and March 2011 was undertaken. In accordance with speciic selection criteria thirty-ive studies were selected for inclusion in the review. The aim was to assess the types of spatial methods that have been used to analyze dengue transmission. We found twenty-one diferent methods that had been used in dengue fever epidemiological studies in that period, three of which were most frequently used. he results show that few articles had applied spatial analysis methods in dengue fever studies; however, whenever they were applied they contributed to a better understanding of dengue fever geospatial difusion.
Resumo
Foi realizada uma revisão sistemática dos métodos de análises geoespaciais que têm sido utilizados em estudos de dengue nos artigos publicados entre janeiro de 2001 a março de 2011. Depois de seguir critérios especíicos de seleção, trinta e cinco estudos foram selecionados para inclusão na revi-são. No total o presente estudo identiicou vinte e um métodos diferentes que têm sido utilizados em estudos epidemiológicos de dengue, três dos quais foram utilizados com maior frequência.
Os resultados apontam um número pequeno de artigos, que aplicaram métodos de aná-lise espacial em estudos epidemiológicos de dengue. No entanto, estes métodos contri-buem para melhor compreensão da difusão geo-espacial da dengue.
Palavras-chave: Dengue. Análise Espacial. Sistema de informação geográica. Mapeamento geográfico. Estudos de séries temporais. Geograia médica
Introduction
People, place and time are the basic elements of epidemiological investigations. According to Moore and Carpenter1, the
development of the Geographic Information System (GIS) has, over the last twenty years, boosted the development of the analysis of spatial patterns and processes in public health.
A general interest in spatial data analysis has developed rapidly over the last few decades, mainly because of the need for better public health tools. Greater interest and the subsequent improvements made have enabled researchers to tackle new urban diseases such as the dengue fever.
Geographical factors and information from diferent sources and formats can be spatially combined by GIS, both in epidemiology and public health — as, for example, in the studies of Briggs2, Albert et al.3, Aron et al.4, Elliot
et al.5 and Khan et al.6.
With the growing number of studies such as these in public health research, new methods of geospatial analysis have been developed speciically for applications in epidemiological studies and have been incorporated in diferent analytical software packages around the world. Moreover, currently, it is possible to access several innovative geospatial analysis tools via Internet.
he objective of this review was to provide an overview regarding the types of geospatial methods that have been used to analyze epidemiological data for dengue transmission over the ten years quoted.
Methods
Selection of studies
clustering dengue”, and “spatio-temporal clustering dengue” were used because they had appeared in the articles found in the irst search.
We selected every article published between January 2001 and March 2011 that contained the keywords at some point in it. We selected studies published in English or Portuguese that focused on dengue fever and used spatial analysis methods. First,
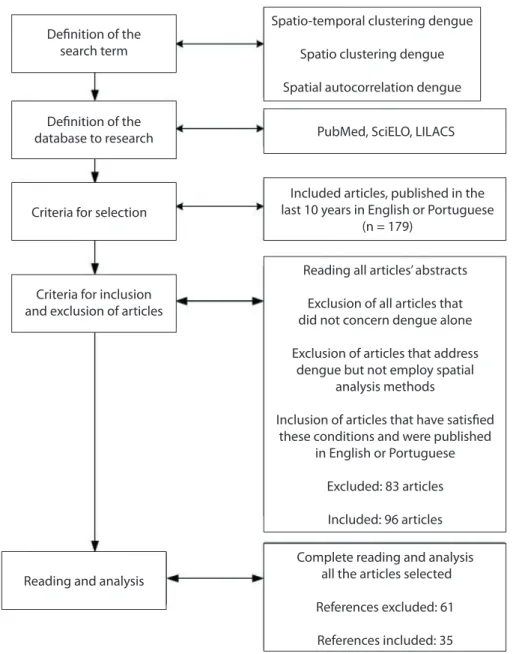
each abstract was appraised to determine whether the article could be included in the review. he criterion of inclusion was that the articles should have applied methods of spatial analysis to dengue data. he criteria adopted are presented in Figure 1.
he analysis focused on papers according to the unit of analysis of data, typology of representation, spatial methods applied, and the main results of the analysis of spatial data.
Figure 1 - Selection process used in a systematic review of Geospatial analysis applied to dengue epidemiological studies, 2001 – 2011.
Figura 1 - Processo de seleção utilizado na revisão sistemática dos métodos de análise geoespacial aplicados em estudos epidemiológicos da dengue, 2001 – 2011.
Definition of the search term
Definition of the database to research
Criteria for selection
Included articles, published in the last 10 years in English or Portuguese
(n = 179)
Spatio-temporal clustering dengue
Spatio clustering dengue
Spatial autocorrelation dengue
PubMed, SciELO, LILACS
Reading and analysis
Complete reading and analysis all the articles selected
References excluded: 61
References included: 35 Reading all articles’ abstracts
Exclusion of all articles that did not concern dengue alone
Exclusion of articles that address dengue but not employ spatial
analysis methods
Inclusion of articles that have satisfied these conditions and were published
in English or Portuguese
Excluded: 83 articles
Included: 96 articles Criteria for inclusion
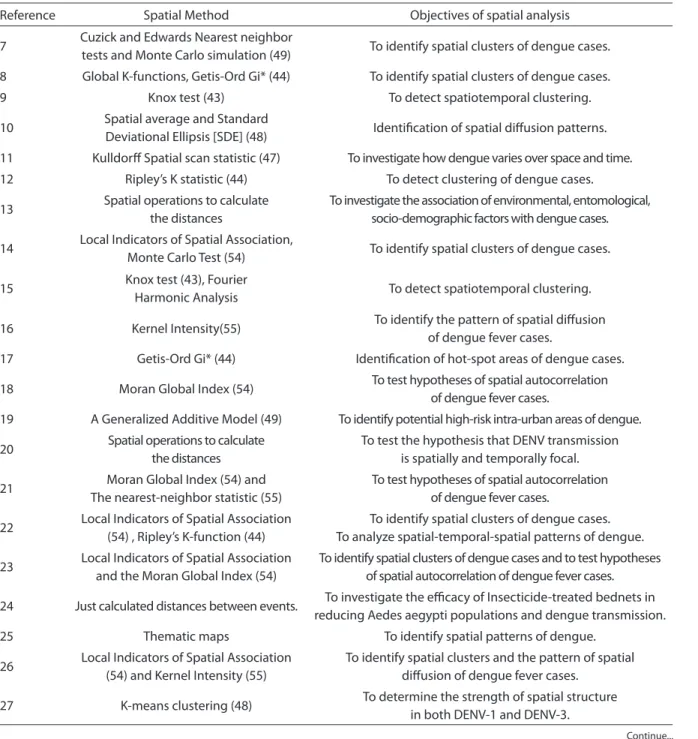
Table 1 - Review of the spatial analysis method used in the selected articles.
Tabela 1 - Métodos de análises espaciais utilizados nos artigos selecionados.
Reference Spatial Method Objectives of spatial analysis
7 Cuzick and Edwards Nearest neighbor
tests and Monte Carlo simulation (49) To identify spatial clusters of dengue cases.
8 Global K-functions, Getis-Ord Gi* (44) To identify spatial clusters of dengue cases.
9 Knox test (43) To detect spatiotemporal clustering.
10 Spatial average and Standard
Deviational Ellipsis [SDE] (48) Identification of spatial difusion patterns. 11 Kulldorf Spatial scan statistic (47) To investigate how dengue varies over space and time.
12 Ripley’s K statistic (44) To detect clustering of dengue cases.
13 Spatial operations to calculate
the distances
To investigate the association of environmental, entomological, socio-demographic factors with dengue cases.
14 Local Indicators of Spatial Association,
Monte Carlo Test (54) To identify spatial clusters of dengue cases.
15 Knox test (43), Fourier
Harmonic Analysis To detect spatiotemporal clustering.
16 Kernel Intensity(55) To identify the pattern of spatial difusion
of dengue fever cases.
17 Getis-Ord Gi* (44) Identification of hot-spot areas of dengue cases.
18 Moran Global Index (54) To test hypotheses of spatial autocorrelation
of dengue fever cases.
19 A Generalized Additive Model (49) To identify potential high-risk intra-urban areas of dengue.
20 Spatial operations to calculate
the distances
To test the hypothesis that DENV transmission is spatially and temporally focal.
21 Moran Global Index (54) and
The nearest-neighbor statistic (55)
To test hypotheses of spatial autocorrelation of dengue fever cases.
22 Local Indicators of Spatial Association (54) , Ripley’s K-function (44)
To identify spatial clusters of dengue cases. To analyze spatial-temporal-spatial patterns of dengue.
23 Local Indicators of Spatial Association and the Moran Global Index (54)
To identify spatial clusters of dengue cases and to test hypotheses of spatial autocorrelation of dengue fever cases.
24 Just calculated distances between events. To investigate the eicacy of Insecticide-treated bednets in reducing Aedes aegypti populations and dengue transmission.
25 Thematic maps To identify spatial patterns of dengue.
26 Local Indicators of Spatial Association (54) and Kernel Intensity (55)
To identify spatial clusters and the pattern of spatial difusion of dengue fever cases.
27 K-means clustering (48) To determine the strength of spatial structure
in both DENV-1 and DENV-3.
Results
Initially, 179 articles, published in either English or Portuguese, between 2001 and 2011, were selected. After reading the abstracts, 83 articles were excluded because they did not satisfy the inclusion criteria. Only 35 of the other 96 articles were found to meet the review criteria.
We found that some authors cited spatial analysis in the abstract but did not use a spatial method to analyze the data. For example, some articles had incorporated the term “spatial” but referred to micro-scale as it applies to genetics. A comparison of the spatial analysis methods used in the selected articles is given in Table 1.
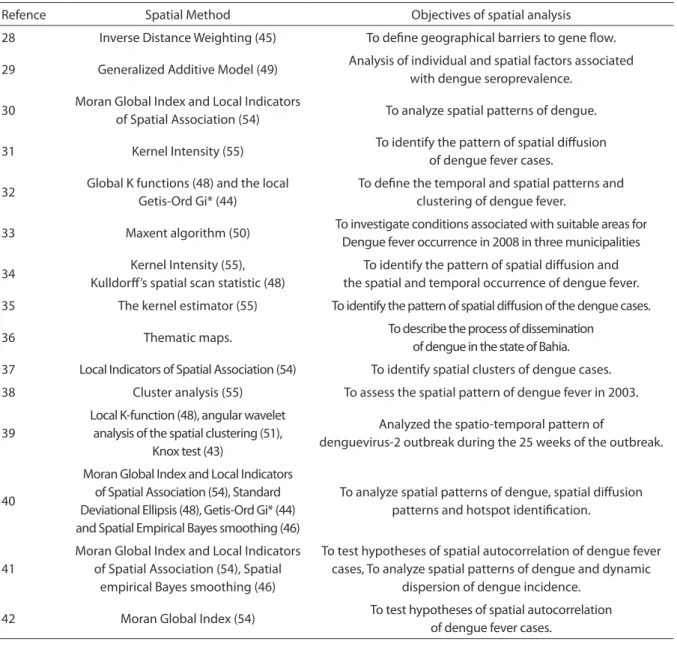
Table 1 - Continuation.
Tabela 1 - Continuação.
Refence Spatial Method Objectives of spatial analysis
28 Inverse Distance Weighting (45) To define geographical barriers to gene low.
29 Generalized Additive Model (49) Analysis of individual and spatial factors associated
with dengue seroprevalence.
30 Moran Global Index and Local Indicators
of Spatial Association (54) To analyze spatial patterns of dengue.
31 Kernel Intensity (55) To identify the pattern of spatial difusion
of dengue fever cases.
32 Global K functions (48) and the local
Getis-Ord Gi* (44)
To define the temporal and spatial patterns and clustering of dengue fever.
33 Maxent algorithm (50) To investigate conditions associated with suitable areas for
Dengue fever occurrence in 2008 in three municipalities
34 Kernel Intensity (55),
Kulldorf’s spatial scan statistic (48)
To identify the pattern of spatial difusion and the spatial and temporal occurrence of dengue fever.
35 The kernel estimator (55) To identify the pattern of spatial difusion of the dengue cases.
36 Thematic maps. To describe the process of dissemination
of dengue in the state of Bahia.
37 Local Indicators of Spatial Association (54) To identify spatial clusters of dengue cases.
38 Cluster analysis (55) To assess the spatial pattern of dengue fever in 2003.
39
Local K-function (48), angular wavelet analysis of the spatial clustering (51),
Knox test (43)
Analyzed the spatio-temporal pattern of
denguevirus-2 outbreak during the 25 weeks of the outbreak.
40
Moran Global Index and Local Indicators of Spatial Association (54), Standard Deviational Ellipsis (48), Getis-Ord Gi* (44) and Spatial Empirical Bayes smoothing (46)
To analyze spatial patterns of dengue, spatial difusion patterns and hotspot identification.
41
Moran Global Index and Local Indicators of Spatial Association (54), Spatial
empirical Bayes smoothing (46)
To test hypotheses of spatial autocorrelation of dengue fever cases, To analyze spatial patterns of dengue and dynamic
dispersion of dengue incidence.
42 Moran Global Index (54) To test hypotheses of spatial autocorrelation
of dengue fever cases.
Year of studies and publication
Variations were reported in the period studied. Most published studies involved an analysis of data covering two years or more. Generally, the articles used data that had been collected four to ten years before publication. About 48% of the studies published used data collected for fewer than three years. Furthermore, more than 52% of the studies were published just four years after the event occurred, and only 8.5% of the studies used data collected less than one year before publication.
Not many papers using spatial analysis6-15
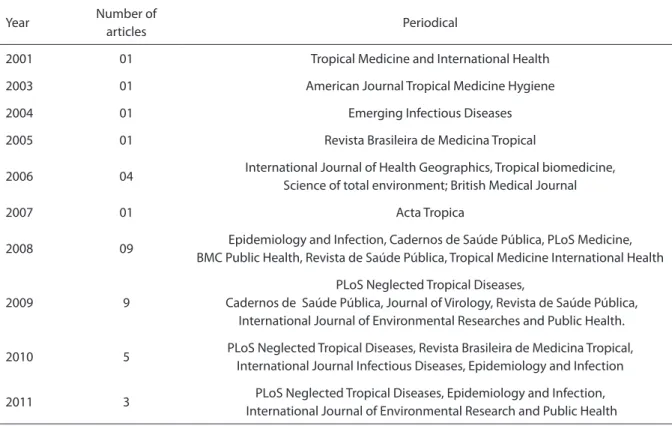
were published between 2001 and 2006, but since 2006 the number of papers based on geospatial studies has increased. Approximately 72% of the relevant papers were published after 200816-42 (Table 2).
Table 2 - Total articles by year and periodical.
Tabela 2 - Total de artigos publicados por ano e periódicos.
Year Number of
articles Periodical
2001 01 Tropical Medicine and International Health
2003 01 American Journal Tropical Medicine Hygiene
2004 01 Emerging Infectious Diseases
2005 01 Revista Brasileira de Medicina Tropical
2006 04 International Journal of Health Geographics, Tropical biomedicine,
Science of total environment; British Medical Journal
2007 01 Acta Tropica
2008 09 Epidemiology and Infection, Cadernos de Saúde Pública, PLoS Medicine,
BMC Public Health, Revista de Saúde Pública, Tropical Medicine International Health
2009 9
PLoS Neglected Tropical Diseases,
Cadernos de Saúde Pública, Journal of Virology, Revista de Saúde Pública, International Journal of Environmental Researches and Public Health.
2010 5 PLoS Neglected Tropical Diseases, Revista Brasileira de Medicina Tropical,
International Journal Infectious Diseases, Epidemiology and Infection
2011 3 PLoS Neglected Tropical Diseases, Epidemiology and Infection,
International Journal of Environmental Research and Public Health
States, on the other hand, the studies were undertaken using other countries’ databases.
he articles were published in the various journals listed in Table 3, most of them being published in just four journals: PLoS Neglected
Tropical Diseases, Cadernos de Saúde Pública,
Revista de Saúde Pública and Revista Brasileira
de Medicina Tropical. hese journals published
78% of the articles which used spatial analysis methods in the investigation of dengue fever transmission.
Nine of the studies included in this review applied spatial methods to analyze e p i d e m i o l o g i ca l a n d e nto m o l o g i ca l i n f o r m a t i o n7 , 8 , 1 0 , 2 0 , 2 1 , 2 4 , 2 6 , 3 5 , 3 6, a n d 2 3
others just analyzed epidemiological information9,11-19,22,23,25,27,30,31,33,34,37-41. Three
articles included analysis of entomological information only29,32,42.
In terms of the geometric or shape representation of data, the studies primarily used polygons and points. he polygons were used to represent administrative frontiers, such as neighborhoods, districts, census tracts, or other administrative frontiers, and
the points were used to represent cases of dengue, households, schools, or vector traps.
here is no predominant type related to the topology utilized because it was common to use more than one type in the articles. For example, often data are collected at household level, but for analysis purposes they are aggregated into areas.
Spatial units
In the articles selected, nine different primary units of analysis were identified. he most-used primary unit of analysis was the household, which was applied in ten articles, or around 28% of the published studies7,8,11-13,19,20,24,29,30.
he dengue case as primary unit was used in ive studies9,15,16,27,33, and census tracts were used in
four studies10,23,24,31. Some studies used more than
one unit of spatial analysis; for example, census tracts and cases were used in ive studies10,22,34,37,39.
Four studies18,25,36,38 used the cities as the unit of
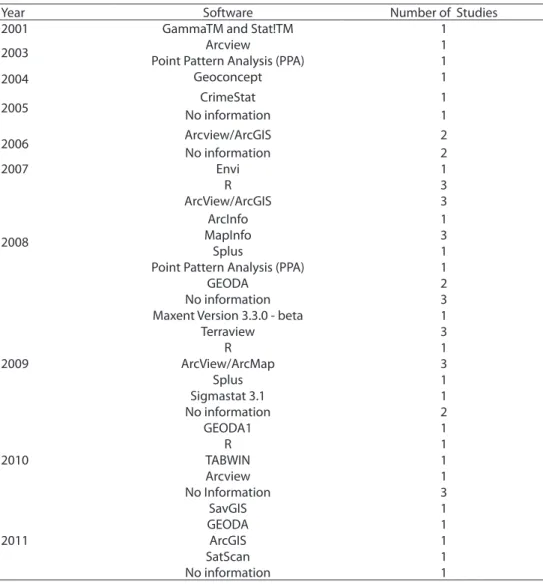
Table 3 - List the software used each year.
Tabela 3 - Softwares utilizados por ano.
Year Software Number of Studies
2001 GammaTM and Stat!TM 1
2003 Arcview 1
Point Pattern Analysis (PPA) 1
2004 Geoconcept 1
2005 No informationCrimeStat 11
2006 Arcview/ArcGIS
No information
2 2
2007 Envi 1
2008
R 3
ArcView/ArcGIS ArcInfo
3 1
MapInfo 3
Splus 1
Point Pattern Analysis (PPA) 1
GEODA 2
No information 3
2009
Maxent Version 3.3.0 - beta 1
Terraview 3
R 1
ArcView/ArcMap 3
Splus 1
Sigmastat 3.1 1
No information 2
2010
GEODA1 1
R 1
TABWIN 1
Arcview 1
No Information 3
2011
SavGIS 1
GEODA 1
ArcGIS 1
SatScan 1
No information 1
Towns or cities were applied in two cases28,40,
administrative districts were used in one17, and
the planning unit was used in one41.
Methods of spatial analysis applied in dengue fever studies
Twenty-one diferent spatial methods used to analyze dengue data were found in the articles. However, some were more common than others. he methods used in selected papers are listed according to the topology of the data used.
Spatial analysis of points
In the analysis of point data, the method used most frequently, in 6 papers16,19,26,31,34,35,
was kernel density estimation. The Knox method43 was applied in three papers9,15,39.
The local Gi* statistic44 was used in three
papers8,17,32. hree papers13,20,36 used only the
distance operations45, without spatial analysis
methods.
Ripley’s K statistic44 was used in two
studies12,22. Bayes smoothing46 was applied in
two papers40,41, while two papers11,34 applied
the Kulldorf analysis47. he Global K statistic44
was applied in two studies8,32. In addition, two
papers used only thematic maps such as the exploratory spatial analysis tool25,36.
Standard deviational ellipse48 was applied in two papers10,40. he generalized additive
model49 was applied in two papers19,29 as
Maxent algorithm50 was applied in one paper33.
Angular wavelet analysis51 was applied in one
study39, the local K-function44 was applied
in a separate study39 and in another study38,
cluster analysis was applied. In one paper27,
local K-means44 was used.
he nearest neighbor statistic51 was applied
in one21, Fourier harmonic analysis52 was used
in another15 and, finally, inverse distance
weighting53 was applied in one study28.
Spatial analysis of area data
L ISA (L ocal indicators of spatial association)54 was the method used most
often in analyzing polygon data22,23,26,30,37,40,41.
Another method commonly used was the Global Moran Index18,21,30,40-42. he Monte Carlo
method was applied in one study14, and the
local Gi* statistic in another17 (Table 1).
Software programs used for spatial analysis of dengue cases
Some articles did not report which software had been used to perform the spatial analysis of data. Further, in some cases, the method of spatial analysis was not referenced; instead, the focus was on the set of operations utilized. For example, it was clear in every article that diferent software had been used; in some cases, one software program was used to create the geographical coordinates (latitude and longitude), and another speciically to perform the spatial analysis.
The software programs used in the selected articles are given in Table 3. he most used were ArcGIS, GeoDa, TerraView and MapInfo. Several other software programs — for example, Satscan, Terrasee, Arc/Info, PPA, S-PLUS, and other customized ones — were used, but not as often.
Discussion
Despite place being a fundamental component of epidemiological investigations, the small number of papers found may indicate that the use of spatial analysis in studies of dengue is still uncommon. Among the possible
reasons that may hinder the application of spatial analysis in the data analysis of dengue is the lack of health information systems that produce georeferenced entomological and epidemiological information, that is, the appropriate scales of analysis.
As from 2008, there was a significant increase in the number of articles that addressed the application of spatial analysis in studies of dengue. 72% of the published articles were found from that year on, perhaps due to the increased severity of the dengue epidemics the world observed during this period. he increase could also be a result of the need to develop new approaches to dengue fever research, to better understand the dynamics of the disease’s transmission, and to formulate strategies to minimize its efects. Among the works selected, there was a significant time interval between the occurrence of events (dengue cases), or even between the execution of serological and entomological surveys, and the publishing of the results of spatial analyses. his time lag might have been due to the natural flow of research, but it might also reflect the complexity and diiculties involved in conducting spatial analyses in countries where dengue is endemic.
he existence of such a long time interval between the collection of entomological and epidemiological information and the analysis and dissemination of results can lead to some bias against the early detection of epidemics and, therefore, to a reduction in the ability to identify the surveillance sites that require public health action.
Although most studies of dengue using spatial analysis were based on data from countries where the disease is endemic, the studies themselves were conducted elsewhere. he exception is Brazil, which has developed most of the spatial analyses, according to articles published in the countries themselves. Brazil and hailand igured most among the countries studied — with 40% of the articles, followed by Peru and Vietnam.
actual characteristics of the entomological and epidemiological studies of dengue, which often focus on the areas surrounding the household because of the ecological characteristics associated with the spread of mosquitoes.
As can be observed in Table 1, twenty-one diferent methods of spatial analysis were found; however, only three of them were used frequently.
In analyzing the polygon data or areas, the most widely used indicator is LISA, and Moran’s global statistic is the commonest way of measuring the degree of spatial autocorrelation in area data52 — perhaps because of the ease
of application and interpretation of results, greater availability of free GIS software, such as GeoDa, or the lack of health information on more greatly detailed scales.
For the analysis of point data, the methods most used have been the intensity estimator kernel. hese methods are essentially graphics55.
Perhaps for this reason, only four studies used just spatial analysis models in the methodology of the article, while the remainder applied various statistical methods in conjunction with the methods of spatial analysis. here were also cases in which the authors did not use any method of spatial analysis. In other words, the spatial analysis of the article was based only on distances calculated using the GIS environment. hese distances were used as independent variables in the regression models. he other eighteen methods of analysis were each used by only one or two articles, and always as a complement to traditional methods of statistical analysis.
Some of the methods might have been more used due to their greater popularization, because of ease of access, as generally they are implemented in commercial software of great difusion capacity with easy-to-handle friendly interfaces, as also in those of the public domain, with a larger number of courses and tutorials which assist the user in their use. On the other hand, although some of the methods least used may be available, both in software of the public domain as also in commercial software, they have as yet been little disseminated and present little didactic material, often having relatively unfriendly interfaces which make their manipulation on the part of users
who have little familiarity with special data, difficult. Although they are commercial software, ArcView/ArcGIS and MapInfo are among the software programs most used, probably because they present more friendly interfaces than do the free software programs and count on a wide range of programs for the dissemination of and training in their use. On the other hand, although they are free (software) programs, GEODA and Terraview are also frequently used, probably because they make the methods commonly used in spatial analyses in public health available free, together with didactic material, and are widely represented at technical and scientiic events. Despite these considerations, it is pertinent to point out that regardless of the degree of sophistication of the method used, the results shown in the papers pointed to the great utility of spatial analysis for the understanding the epidemiology of dengue fever on different continents and in diferent geographical areas. Furthermore, results have shown that the methods such as Kernel Estimation, LISA and Moran’s, can quickly produce eicient information regarding the location of clusters of dengue cases and of hot spot areas of transmission. Such information can be a powerful tool for monitoring dengue transmission at the local level.
Finally, despite the development of the methods of spatial analysis applied in epidemiological studies, they are rarely used in studies of dengue. However, the identiication of spatial patterns in most of the articles discussed above confirms the usefulness of the application of these techniques and the need for development and application of advanced spatial analysis beyond the limits of visualization.
References
1. Moore DA, Carpenter TE. Spatial analytical methods and geographic information systems: use in health research and epidemiology. Epidemiol Rev 1999; 21(2): 143-61.
2. Briggs DJ. Mapping environmental exposure. In: Geographical & Environmental Epidemiology. Methods for Small Area Studies. Ed. By P. Elliot. Great Britain: Oxford Medical publications; 1996. p.158-96.
3 . Albert PD, Gesler WM, Levergood B. Spatial Analysis, GIS, and Remote Sensing. Applications in the Health Sciences. Chelsea: Ann Arbor Press; 2001.
4. Aron JL, Patz JA. Ecosystem Change and Public Health: A Global Perspective. Baltimore: he Johns Hopkins University Press; 2001.
5. Elliot P, Wakeield J, Best N, Briggs D. Spatial Epidemiology. Methods and applications. New York: Oxford University Press; 2006.
6. Khan OA, Davenhall W, Ali M, Castillo-Salgado C, Vazquez-Prokopec G, Kitron U, et al. Geographical information systems and tropical medicine. Ann Trop Med Parasitol 2010; 104(4): 303-18.
7. Reiskind MH, Baisley KJ, Calampa C, Sharp TW, Watts DM, Wilson ML. Epidemiological and ecological characteristics of past dengue virus infection in Santa Clara, Peru. Trop Med Int Health 2001; 6(3): 212-8.
8. Getis A, Morrison AC, Gray K, Scott TW. Characteristics of the spatial pattern of the dengue vector, Aedes aegypti, in Iquitos, Peru. Am J Trop Med Hyg 2003; 69(5): 494-505.
9. Tran A, Deparis X, Dussart P, Morvan J, Rabarison P, Remy F, et al. Dengue spatial and temporal patterns, French Guiana, 2001. Emerg Infect Dis 2004; 10(4): 615-21.
10. Barcellos C, Pustai AK, Weber MA, Brito MR. Identiication of places with potential transmission of dengue fever in Porto Alegre using Geographical Information Systems. Rev Soc Bras Med Trop 2005; 38(3): 246-50.
11. Vanwambeke SO, Van Benthem BH, Khantikul N, Burghoorn-Maas C, Panart K, Oskam L, et al. Multi-level analyses of spatial and temporal determinants for dengue infection. Int J Health Geogr 2006; 5: 5.
12. Kroeger A, Lenhart A, Ochoa M, Villegas E, Levy M, Alexander N, et al. Efective control of dengue vectors with curtains and water container covers treated with insecticide in Mexico and Venezuela: cluster randomised trials. BMJ 2006; 332(7552): 1247-52.
13. Cheah WL, Chang MS, Wang YC. Spatial, environmental and entomological risk factors analysis on a rural dengue outbreak in Lundu District in Sarawak, Malaysia. Trop Biomed 2006; 23(1): 85-96.
14. Wen TH, Lin NH, Lin CH, King CC, Su MD. Spatial mapping of temporal risk characteristics to improve environmental health risk identiication: a case study of a dengue epidemic in Taiwan. Sci Total Environ 2006; 367(2-3): 631-40.
15. Rotela C, Fouque F, Lamfri M, Sabatier P, Introini V, Zaidenberg M, et al. Space-time analysis of the dengue spreading dynamics in the 2004 Tartagal outbreak, Northern Argentina. Acta Trop 2007; 103(1): 1-13.
16. Barreto FR, Teixeira MG, Costa MC, Carvalho MS, Barreto ML. Spread pattern of the irst dengue epidemic in the city of Salvador, Brazil. BMC Public Health 2008; 8: 51.
17. Nagao Y, Svasti P, Tawatsin A, havara U. Geographical structure of dengue transmission and its determinants in hailand. Epidemiol Infect 2008; 136(6): 843-51.
18. Teixeira TR, Medronho RA. Socio-demographic factors and the dengue fever epidemic in 2002 in the State of Rio de Janeiro, Brazil. Cad Saude Publica 2008; 24(9): 2160-70.
19. Siqueira-Junior JB, Maciel IJ, Barcellos C, Souza WV, Carvalho MS, Nascimento NE, et al. Spatial point analysis based on dengue surveys at household level in central Brazil. BMC Public Health 2008; 8: 361.
20. Mammen MP, Pimgate C, Koenraadt CJ, Rothman AL, Aldstadt J, Nisalak A, et al. Spatial and temporal clustering of dengue virus transmission in hai villages. PLoS Med 2008; 5(11): e205.
21. hammapalo S, Chongsuvivatwong V, Geater A, Dueravee M. Environmental factors and incidence of dengue fever and dengue haemorrhagic fever in an urban area, Southern hailand. Epidemiol Infect 2008; 136(1): 135-43.
22. Almeida MC, Assunção RM, Proietti FA, Caiafa WT. Intra-urban dynamics of dengue epidemics in Belo Horizonte, Minas Gerais State, Brazil, 1996-2002. Cad Saúde Pública 2008; 24(10): 2385-95.
23. Galli B, Chiaravalloti Neto F. Temporal-spatial risk model to identify areas at high-risk for occurrence of dengue fever. Rev Saúde Pública 2008; 42(4): 656-63.
24. Lenhart A, Orelus N, Maskill R, Alexander N, Streit T, McCall PJ. Insecticide-treated bednets to control dengue vectors: preliminary evidence from a controlled trial in Haiti. Trop Med Int Health 2008; 13(1): 56-67.
25. Johansson MA, Dominici F, Glass GE. Local and global efects of climate on dengue transmission in Puerto Rico. PLoS Negl Trop Dis 2009; 3(2): e382.
26. Machado JP, Oliveira RM, Souza-Santos R. Spatial analysis of dengue occurrence and living conditions in Nova Iguaçu, Rio de Janeiro State, Brazil. Cad Saude Publica 2009; 25(5): 1025-34.
27. Schreiber MJ, Holmes EC, Ong SH, Soh HS, Liu W, Tanner L, et al. Genomic epidemiology of a dengue virus epidemic in urban Singapore. J Virol 2009; 83(9): 4163-73.
29. Honório NA, Nogueira RM, Codeço CT, Carvalho MS, Cruz OG, Magalhães MA, Almeida AS, et al. Análise espacial da dengue e o contexto socioeconômico no município do Rio de Janeiro. Rev Saúde Pública 2009; 43(4): 666-73.
30. Almeida AS, Medronho Rde A, Valencia LI. Spatial analysis of dengue and the socioeconomic context of the city of Rio de Janeiro (Southeastern Brazil). Rev Saúde Pública 2009; 43(4): 666-73.
31. San Pedro A, Souza-Santos R, Sabroza PC, Oliveira RM. Speciic dengue transmission conditions at the local level: a study in Itaipu, Niterói, Rio de Janeiro State, Brazil. Cad Saúde Pública 2009; 25(9): 1937-46.
32. Jefery JA, hi Yen N, Nam VS, Nghia le T, Hofmann AA, Kay BH, et al. Characterizing the Aedes aegypti population in a Vietnamese village in preparation for a Wolbachia-based mosquito control strategy to eliminate dengue. PLoS Negl Trop Dis 2009;3(11): e552.
33. Arboleda S, Jaramillo-O N, Peterson AT. Mapping
environmental dimensions of dengue fever transmission risk in the Aburrá Valley, Colombia. Int J Environ Res Public Health 2009; 6(12): 3040-55.
34. Flauzino RF, Souza-Santos R, Barcelllos C, Gracie R, Magalhães MA, Oliveira RM. Spatial heterogeneity of dengue fever in local studies, City of Niterói, Southeastern Brazil. Rev Saude Publica 2009; 43(6): 1035-43.
35. Barbosa GL, Lourenço, RW. Analysis on the spatial-temporal distribution of dengue and larval infestation in the municipality of Tupã, State of São Paulo. Rev Soc Bras Med Trop 2010; 43(2): 145-51.
36. Melo MS, Barreto FR, Costa MC, Morato VC, Teixeira MG. Progression of dengue virus circulation in the State of Bahia, Brazil, 1994-2000.Rev Soc Bras Med Trop 2010; 43(2): 139-44.
37. Wen TH, Lin NH, Chao DY, Hwang KP, Kan CC, Lin KC, et al. Spatial-temporal patterns of dengue in areas at risk of dengue hemorrhagic fever in Kaohsiung, Taiwan, 2002. Int J Infect Dis 2010; 14(4): e334-43.
38. hai KT, Nagelkerke N, Phuong HL, Nga TT, Giao PT, Hung LQ, et al. Geographical heterogeneity of dengue transmission in two villages in southern Vietnam. Epidemiol Infect. 2010; 138(4): 585-91.
39. Vazquez-Prokopec GM, Kitron U, Montgomery B, Horne P, Ritchie SA. Quantifying the spatial dimension of dengue virus epidemic spread within a tropical urban environment. PLoS Negl Trop Dis 2010; 4(12): e920.
40. Jeefoo P, Tripathi NK, Souris M. Spatio-temporal difusion pattern and hotspot detection of dengue in Chachoengsao province, hailand. Int J Environ Res Public Health 2011; 8(1): 51-74.
41. Hu W, Clements A, Williams G, Tong S. Spatial analysis of notiied dengue fever infections. Epidemiol Infect 2011; 139(3): 391-9.
42. Wong J, Stoddard ST, Astete H, Morrison AC, Scott TW. Oviposition site selection by the dengue vector Aedes aegypti and its implications for dengue control. PLoS Negl Trop Dis 2011; 5(4): e1015.
43. Knox EG. he detection of space-time interactions. Appl Stat 1964; 13: 25-9.
44. Getis, A. Interaction Modeling Using Second-order Analysis. Environment and Planning 1984; 16: 173-83.
45. Getis A, Ord JK. The analysis of spatial association by use of distance statistics. Geographical Analysis 1992; 24: 189-206.
46. Marshall RJ. Mapping disease and mortality rates using empirical Bayes estimators. J R Stat Soc Ser C Appl Stat 1991; 40(2): 283-94.
47. Kuldorf M, Nagarwalla N. Spatial disease clusters: detection and inference. Stat Med 1995; 14(8): 799-810.
48. Boots BN, Getis A. Point Pattern Analysis. Newbury Park: Sage Publications; 1998.
49. Hastie TJ, Tibshirani RJ. Generalized Additive Models. London: Chapman & Hall/CRC; 1990.
50. Phillips SJ, Anderson RP, Schapire RE. Maximum entropy modeling of species geographic distributions. Ecol. Model 2006; 190: 231-59.
51. Rosenberg M, Kenkel N. Wavelet analysis for detecting anisotropy in point patterns. Journal of Vegetation Science 2004; 15: 277-84.
52. Rogerson PA. Statistical Methods for Geography. London: SAGE Publications; 2001. p. 161-4.
53. Crist EP, Kauth RJ. he tasselled cap demystified. Photogramm. Eng Rem S 1986; 52(1): 81-6.
54. Anselin L. Local indicators of spatial association — LISA. Geogr Anal 1995; 27(2): 93-115.
55. Fotheringham AS, Brunsdon C, Charlton M. Quantitative geography: perspectives on spatial analysis. London: Sage Publications; 2000.