ABSTRACT: The aim of the study was to examine the correlation among diferent indicators of body image; between each one of these and nutritional status; and the association of these indicators with the Body Mass Index (BMI) of adolescents. A random sample of 152 students from public and private schools in the city of Rio de Janeiro, Brazil, was studied. On four occasions, two silhouette scales and two questions regarding the opinion of the student about his/her body and weight were applied and weight and height were measured. The BMI was examined both as a continuous and as a categorical variable. The agreement between the variables was analyzed using the quadratic weighted Kappa statistics. The association between body image variables and BMI was examined by the comparison among median, mean, standard deviation and 95% conidence interval of BMI for each category of the body image variables. In general, the correlation among the body image variables ranged from reasonable to good; between these and the variable nutritional status, correlation ranged from regular to reasonable. Best results were observed among boys and students from private schools. All body image variables showed good discriminatory power for BMI, when it was analyzed as a continuous variable, even when controlling for potential confounders. The question about body seems to be better than that about weight to compose the questionnaire of a surveillance system for risk and protective factors for adolescent health.
Keywords: Adolescent. Body image. Scales. Nutritional status. Association. Surveillance.
Agreement and association between diferent
indicators of body image and body mass index
in adolescents
Concordância e associação entre diferentes indicadores de imagem corporal
e índice de massa corporal em adolescentes
Carla Fernandez dos SantosI, Inês Rugani Ribeiro de CastroI, Letícia de Oliveira CardosoII,
Letícia Ferreira TavaresIII
IInstitute of Nutrition, Universidade do Estado do Rio de Janeiro – Rio de Janeiro (RJ), Brazil.
IINational School of Public Health Sérgio Arouca, Fundação Oswaldo Cruz, Ministry of Health – Rio de Janeiro (RJ), Brazil. IIIInstitute of Nutrition Josué de Castro, Universidade Federal do Rio de Janeiro – Rio de Janeiro (RJ), Brazil.
Corresponding author: Carla Fernandez dos Santos. Instituto de Nutrição, Universidade do Estado do Rio de Janeiro. Rua São Francisco Xavier, 524, sala 12024, 12º andar, bloco D, Maracanã, CEP: 25550-013, Rio de Janeiro, RJ, Brasil. E-mail: [email protected]
Conlict of interests: nothing to declare – Financing source: Foundation for Research Support of the State of Rio de Janeiro (FAPERJ),
Process E-26/110.635/2011) and National Council for Scientiic and Technological Development (CNPq), Process 475782/2011-9.
INTRODUCTION
Body image can be defined as the intellectual reproduction people do with regard to their own physical image, however, it is not only related to body perception, but to a process that is built by the individual throughout life including a set of social, libidinal and physiological aspects1. In this perspective, the concept of body image comprehends three
diferent dimensions: a perceptive dimension, which refers to observing the person’s own body, including aspects such as dimension and body weight; a subjective dimension, concerning satisfaction (or not) with a person’s own body; and a behavioral dimension, characterized by actions people perform or not based on how they perceive their physical appearance2.
An individual’s perception concerning the body can be assessed in all of the moments throughout life. Because of its deep transformations, adolescence deserves special attention, because, at that stage in life, it is possible to expect that the aspects that are present in the three dimensions of body image (perceptive, subjective and behavioral) should be always revisited and reformulated. This is a relevant theme for public health, because, among other reasons, body image has been associated with diferent practices for body changes (weight loss or gain, muscle mass gain). Dietary habits and practice of physical activities are part of such changes (which may or may not be adequate in terms of health), as well as extreme practices, such as use of formulas, laxatives and vomit-inducing3-6.
RESUMO: O objetivo do estudo foi examinar a concordância entre diferentes indicadores de imagem corporal e de cada um desses com o estado nutricional e a associação dos mesmos com o índice de massa corporal (IMC) entre adolescentes. Foi estudada uma amostra aleatória de 152 estudantes de escolas públicas e privadas do município do Rio de Janeiro. Em quatro ocasiões, foram aplicadas duas escalas de silhuetas e duas questões referentes à opinião do estudante sobre seu corpo e seu peso e realizada aferição de peso e estatura. O IMC foi examinado como variável categórica e contínua. Para a análise de concordância entre as variáveis, foi aplicada estatística Kappa com ponderação quadrática. Para exame da associação entre variáveis de imagem corporal e o IMC, foram calculados mediana, média, desvio padrão e intervalo de coniança de 95% de IMC para cada categoria das variáveis de imagem corporal. Em geral, a concordância entre as variáveis de imagem corporal foi de razoável a boa e, entre essas e a variável estado nutricional, foi de regular a razoável. Melhores resultados foram observados entre meninos e entre alunos de escolas privadas. Todas as variáveis de imagem corporal apresentaram bom poder discriminatório para o IMC, quando analisado como variável contínua, mesmo quando controlados potenciais fatores de confusão. A pergunta sobre corpo parece ser melhor do que aquela sobre peso para compor o questionário de um sistema de vigilância de fatores de risco e proteção à saúde para adolescentes.
Therefore, in surveillance systems of risk factors to health involving adolescents in the world, including Brazil, body image has been one of the analyzed themes, assessed by means of questions related to their opinion on weight and body7-11. Up until now, no studies
have been conducted to compare these questions, which becomes a challenge in terms of comparing body image indicators produced in the diferent systems.
Besides questions about body image used in surveillance systems, another instrument has been adopted in epidemiological studies concerning body image among adolescents: the silhouette scales3,5,12, addressed to this population group. At irst, they were conceived
to analyze body image perception and dissatisfaction with body among adults13,14, but now
some of these instruments have been adapted and validated for children and adolescents12,15-18.
Further studies are necessary to inform about the psychometric characteristics of these scales for this population group12.
With the objective of extending the knowledge about the consistency between diferent methods used to measure body image and subsidizing the process of construction of these instruments, which are adopted by surveillance systems that establish public policies addressed to promoting health among adolescents, this study aims at: examining the agreement between four diferent body image indicators (based on questions referring to the student’s opinion on his or her body and weight, used in surveillance systems or silhouette scales), the agreement of these body image indicators with an anthropometric nutritional status (NS) indicator, and the association of body image indicators with body mass index (BMI) (as a continuous variable) among adolescents attending public and private schools in the city of Rio de Janeiro.
METHODS
STUDY DESIGN, POPULATION AND SAMPLING
This study was based on the research “Validation of the questionnaire for the National Adolescent School-Based Survey (PeNSE): physical activity, consumption and dietary habits”. This is a cross-sectional study involving students who attended the 9th grade of elementary
school in 2011, in public and private schools of Rio de Janeiro. The 9th grade was chosen
for being the one used in PeNSE19, study that integrates the Brazilian Surveillance System
of Risk and Protective Factors to the health of adolescents.
In order to deine the sampling size for the research on which this study was based, the results obtained in the study about the reproducibility of the questionnaire used by the surveillance system in the city of Rio de Janeiro in 200720, were adopted. These results
of 126 students was estimated. By assuming there could be a 50% loss in the second stage of the study (telephone interviews), the objective was to compose a sample of 250 students.
Data from the School Census 2010, performed by the National Institute for Educational Studies and Research Anísio Teixeira, from the Ministry of Education (INEP/MEC), were used for rale and selection of groups. According to the School Census 2010, classrooms from public and private schools had an average of 36.2 and 25.7 students, respectively; therefore, it would be necessary to select approximately 9 classrooms in order to reach the established sample size. The distribution of the number of classrooms per type of school (public or private) was based on the proportion of students enrolled in public (75%) and private schools (25%) in the city of Rio de Janeiro. Classrooms were selected by systematic sampling, and interval selection was calculated according to the total number of 9th grade
classrooms in public and private schools. Nine classrooms from nine schools were selected (six public and three private schools), and these institutions were located in diferent regions of the city of Rio de Janeiro.
With the objective of examining whether or not the sample size, calculated for the validation study, would be suicient for the purpose of this study, new calculations were made by combining diferent parameters: (a) Kappa, for the matter referring to body image in the aforementioned reproducibility study (0.74)20; (b) Kappa, calculated for the agreement
between body image and NS based on data from PeNSE-2009 (0.33); (c) proportions of NS categories of adolescents, observed in PeNSE -2009; and (d) proportions of body image proportions of adolescents, observed in PeNSE -2009: thin (22.1%), normal (60.2%), fat (17.7%)4. The sample sizes calculated based on these parameters range from 73 to 127,
which indicates that the sample size of the validation study in which this analysis is based on is suicient. The random selection of classrooms was systematic, and the interval selection was calculated according to the total number of 9th grade classrooms in public
and private schools.
DATA COLLECTION
This stage was conducted on four diferent days, with the objective of preventing a possible inluence between the responses given by the student to each one of the used instruments (two questions and two silhouette scales, as described in this study). The anthropometric evaluation was conducted on the last day, so that this objective data could not inluence the responses of the students in the instruments focusing on their opinion about their bodies.
it was presented in the form of cards measuring 12.5 cm x 6.5 cm, and, after observing them, the students answered the following question in the PDA: “Which igure best represents your body today?”.
On the days following the irst visit to school, two telephone interviews were conducted with students by trained interviewers, which included, respectively, the following questions about body image: “Regarding your body, do you consider yourself to be: very thin, thin, normal, fat, very fat?” and “Regarding weight, do you consider yourself to be: very underweight, a little underweight, proper weight, a little overweight, very overweight?”. In both interviews, the response options were read to the adolescent. Three attempts to reach the interviewee were made for each interview.
The fourth day included a new visit to school for the anthropometric evaluation of students, conducted by trained measurers. Weight was measured with a portable digital electronic scale Caumaq®, with maximum capacity for 150 kg and 0.1 kg accuracy. Height was measured by
a portable stadiometer AlturExata®, with maximum height of 2 meters and 0.1 cm accuracy.
At this time, a second silhouette scale was used, designed by Thompson and Gray13 and
validated for Brazilian adolescents by Conti and Latorre16. As established by the scale authors,
it was presented in a paper sheet measuring 21.6 cm x 27.9 cm. Facing the scale, the students answered the following question: “Which igure best represents your body today?”.
The period of time between the irst and the second visit to each school ranged from 12 to 30 days (weighted mean = 21). Field work lasted 58 days.
VARIABLES OF INTEREST
The variables analyzed in this study were sex, age (in full years), and BMI [weight (kg)/ height (m2)] of the analyzed students, as well as type of school they attended (public or
private), students’ opinion on their bodies and weight, and students’ perception on their position in relation to both silhouette scales.
Body image: examined according to four variables: (a) Opinion on the body (variable called “OpB”): the five response options to the question “Regarding your body, do you consider yourself to be?” were grouped in three different categories: [very thin + thin]; [normal] and [fat + very fat], as established by other studies21,22; (b) Opinion on weight
(variable called “OpW”): the five response options to the question “Regarding your weight, do you consider yourself to be?” were also grouped in three categories: [very underweight + a little underweight]; [proper weight] and [a little overweight; very overweight];
(c) Perception of body image according to the silhouette scale proposed by Kakeshita et al.15 for
adults and validated by Laus et al.18 for adolescents (variable called “Silhouette Scale A”,
“SS_A”): the 15 images composing the scale for each sex represent BMI groups, whose means range from 11.25 kg/m2 (first figure) to 48.75 kg/m2 (last figure) for female
each of them, as follows: Group 1A: silhouettes 1 to 3; Group 2A: 4 to 6; and Group 3A, silhouettes 7 to 15. Since the scale by Kakeshita et al.15 was proposed for adults,
these groups aimed at respecting the nutritional classification proposed by the World Health Organization (WHO) for adults, based on the mean BMI of each figure23; and (d)Perception of body image according to the silhouette scale by Thompeon and Gray13 (from
now on called “Silhouette scale B; “SS_B”): this scale is composed of nine images for each sex, designed by an specialized professional. Even if this scale was not built on empirical basis, that is, even if each figure does not represent a previously known BMI group, Conti and Latorre16 validated this scale for Brazilian adolescents. Given the lack
of empirical base to build this scale, the act of grouping the nine images of each sex in three categories was based on BMI mean (Z scores) of the adolescents, which was observed in our study in each of these categories: Group 1B is constituted of silhouettes numbers 1, 2, 3 and 4 (BMI mean of -0.97 to 0.36); Group 2B involve silhouettes 5 and 6 (BMI mean of 0.34 to 0.73); and Group 3B includes silhouettes 7, 8 and 9 (BMI mean of 1.79 to 3.59).
Nutritional status (from now on named “NS”): Evaluation based on BMI according to age and sex. For agreement analyses, the adopted nutritional classiication was the one established by WHO24. Nutritional status groups were divided in the following categories:
[extreme thinness + thinness], [eutrophia] and [overweight + obesity], being the latter called “excessive weight”. As a complement, for some analyses, BMI was examined as a continuous variable, both in its crude form and in Z scores (standard deviation units) of the reference population.
DATA ANALYSIS
With the objective of investigating the occurrence of a possible selection bias among individuals in the study, the analyzed and the non-analyzed groups were compared according to the following sociodemographic variables: type of school, age and sex. In order to verify the agreement between the proposed categories for each variable of interest (OpB, OpW, SS_A, SS_B and NS), the quadratic weighted Kappa was calculated for ordinal variables, proposed by Fleiss and Cohen25. For the interpretation of weighted Kappa values, a classiication
proposed by Byrt26 was adopted, and the names used here for each Kappa group, proposed
in this classiication, were an adaptation from those presented by Luiz27. For the analysis of
the association between categories of body image variables and BMI of the students, BMI Z-score units were used by age and sex of the reference curves proposed by WHO28. For the
The application WinPepi v.11.18 was used to calculate the weighted Kappa. BMI (crude and Z score) was calculated according to the age of the adolescent on the day of anthropometry, by the application WHO AnthroPlus v.1.0.4. The other analyses were conducted with the statistical package SPSS v.17. This study was approved by the Research Ethics Committee of the Municipal Secretariat of Health in the city of Rio de Janeiro.
RESULTS
Out of the 251 students who initiated the study, 152 were efectively analyzed. From the total number of analyzed students, 63.8% attended public schools, about half of them (48.7%) were 15 years old, and little more than half (53.9%) were girls. There were no statistically signiicant diferences between the studied and the non-studied group concerning the sample distribution according to sex, age and type of school. The distribution of variables of interest for the total number of analyzed students and according to sex and type of school is presented in Table 1.
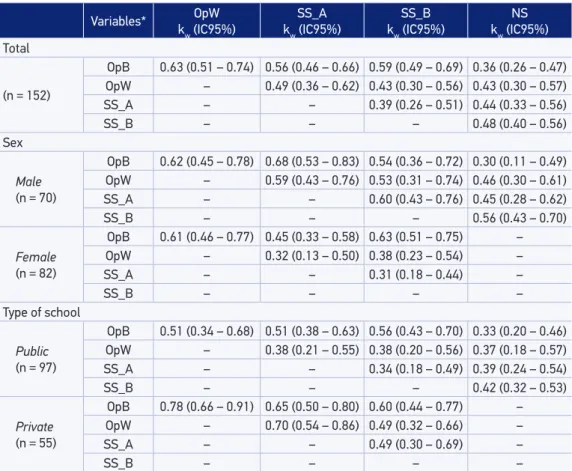
In general, the agreement between body image variables ranged from reasonable (Kappa from 0.41 to 0.60) to good (Kappa from 0.61 to 0.80), and, between these and the NS variable, it ranged from regular (Kappa from 0.21 and 0.40) to reasonable. Better results were observed among boys and students attending private schools (Table 2).
The agreement rate between the variables OpB and OpW was good for the total sample, including boys and girls and students from private schools; and it was reasonable for students attending public schools (Table 2). The analysis of agreement of these two variables with the silhouette scales, for the total sample, indicated that the OpP variable has better agreement rates than OpW, both for SS_A and SS_B (Table 2). In general, this result remained unaltered when data were analyzed by sex and type of school.
By examining the four body image variables with regard to the NS variable, it was observed that, for the total sample and for the strata in which the weighted Kappa could be estimated, OpW presented better results than OpB, and SS_B had better results in relation to SS_A (Table 2).
Table 1. Distribution of responses of each category of variable of interest for the total sample, according to sex and type of school. Rio de Janeiro, Brazil, 2011.
Variables of interest
Total (n = 152)
Sex Type of school
Male
(n = 70) Female (n = 82) (n = 97)Public (n = 55)Private
(%) (%) (%) (%) (%)
Opinion on body
Very thin 2.0 2.9 1.2 2.1 1.8
Thin 20.4 21.4 19.5 22.7 16.4
Normal 59.9 64.3 56.1 62.9 54.5
Fat 17.1 11.4 22.0 12.4 25.5
Very fat 0.7 0.0 1.2 0.0 1.8
Opinion on weight
Very underweight 2.6 2.9 2.4 3.1 1.8
A little underweight 10.5 15.7 6.1 11.3 9.1
Proper weight 63.8 67.1 61.0 67.0 58.2
A little overweight 20.4 11.4 28.0 17.5 25.5
Very overweight 2.6 2.9 2.4 1.0 5.5
Silhouette scale A*
Figure 1 3.3 5.7 1.2 3.1 3.6
Figure 2 3.3 5.7 1.2 3.1 3.6
Figure 3 9.2 14.3 4.9 12.4 3.6
Figure 4 14.5 21.4 8.5 14.4 14.5
Figure 5 14.5 20.0 9.8 11.3 20.0
Figure 6 17.8 20.0 15.9 17.5 18.2
Figure 7 7.2 2.9 11.0 8.2 5.5
Figure 8 13.8 1.4 24.4 16.5 9.1
Figure 9 5.9 0.0 11.0 7.2 3.6
Figure 10 4.6 1.4 7.3 3.1 7.3
Figure 11 3.9 5.7 2.4 2.1 7.3
Figure 13 1.3 1.4 1.2 1.0 1.8
Figure 15 0.7 0.0 1.2 0.0 1.8
Silhouette scale B
Figure 1 0.7 0.0 1.2 1.0 0.0
Figure 2 3.9 0.0 7.3 5.2 1.8
Figure 3 9.2 5.7 12.2 12.4 3.6
Figure 4 14.5 15.7 13.4 16.5 10.9
Figure 5 36.2 45.7 28.0 37.1 34.5
Figure 6 17.8 17.1 18.3 12.4 27.3
Figure 7 11.2 11.4 11.0 9.3 14.5
Figure 8 5.9 4.3 7.3 6.2 5.5
Figure 9 0.7 0.0 1.2 0.0 1.8
Nutritional status
Thinness 0.7 1.4 0.0 1.0 0.0
Eutrophia 69.7 72.9 67.1 74.2 61.8
Overweight 19.7 17.1 22.0 17.5 23.6
Obesity 9.9 8.6 10.9 7.2 14.5
Table 2. Weighted Kappa values for variables of interest with respective 95% conidence intervals for the total of analyzed students, according to sex and type of school. Rio de Janeiro, Brazil, 2011.
Variables* OpW
kw (IC95%)
SS_A kw (IC95%)
SS_B kw (IC95%)
NS kw (IC95%) Total
(n = 152)
OpB 0.63 (0.51 – 0.74) 0.56 (0.46 – 0.66) 0.59 (0.49 – 0.69) 0.36 (0.26 – 0.47) OpW – 0.49 (0.36 – 0.62) 0.43 (0.30 – 0.56) 0.43 (0.30 – 0.57)
SS_A – – 0.39 (0.26 – 0.51) 0.44 (0.33 – 0.56)
SS_B – – – 0.48 (0.40 – 0.56)
Sex
Male
(n = 70)
OpB 0.62 (0.45 – 0.78) 0.68 (0.53 – 0.83) 0.54 (0.36 – 0.72) 0.30 (0.11 – 0.49) OpW – 0.59 (0.43 – 0.76) 0.53 (0.31 – 0.74) 0.46 (0.30 – 0.61)
SS_A – – 0.60 (0.43 – 0.76) 0.45 (0.28 – 0.62)
SS_B – – – 0.56 (0.43 – 0.70)
Female
(n = 82)
OpB 0.61 (0.46 – 0.77) 0.45 (0.33 – 0.58) 0.63 (0.51 – 0.75) –
OpW – 0.32 (0.13 – 0.50) 0.38 (0.23 – 0.54) –
SS_A – – 0.31 (0.18 – 0.44) –
SS_B – – – –
Type of school
Public
(n = 97)
OpB 0.51 (0.34 – 0.68) 0.51 (0.38 – 0.63) 0.56 (0.43 – 0.70) 0.33 (0.20 – 0.46) OpW – 0.38 (0.21 – 0.55) 0.38 (0.20 – 0.56) 0.37 (0.18 – 0.57)
SS_A – – 0.34 (0.18 – 0.49) 0.39 (0.24 – 0.54)
SS_B – – – 0.42 (0.32 – 0.53)
Private
(n = 55)
OpB 0.78 (0.66 – 0.91) 0.65 (0.50 – 0.80) 0.60 (0.44 – 0.77) –
OpW – 0.70 (0.54 – 0.86) 0.49 (0.32 – 0.66) –
SS_A – – 0.49 (0.30 – 0.69) –
SS_B – – – –
OpB: opinion on body [very thin + thin], [normal], [fat + very fat]; OpW: opinion on weight [very underweight + a little underweight], [proper weight], [a little overweight + very overweight]; SS_A: silhouette scale A Group 1A [igures 1, 2 and 3], Group 2A [igures 4, 5 and 6], Group 3A [igures from 7 to 15]; ES_B: silhouette scale B Group 1B [igures 1, 2, 3 and 4], Group 2B [igures 5 and 6], Group 3B [igures 7, 8 and 9]; EN: nutritional status [thinness], [eutrophia], [excessive weight]; Kw: weighted Kappa; 95%CI: 95% conidence interval.
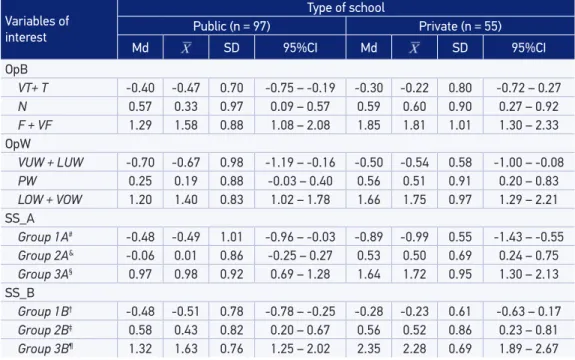
considered to be the cutof point for excessive weight24. In the third category of all of the
variables, most mean and median values, as well as lower conidence interval values of these estimates, were higher to a Z score (Table 3).
It is worth to mention that, generally, the 95%CI in mean BMI Z-scores obtained for each category of each studied variable were not superposed, which suggests statistically signiicant diferences between BMI values in groups of students who chose each of the categories in each variable (Table 3).
Table 3. Median, mean, standard deviation and 95% conidence interval of Z-score body mass index in the total sample, according to body image variables by sex and type of school. Rio de Janeiro, Brazil, 2011.
Variables of interest
Total (n = 152) Male (n = 70) Sex Female (n = 82)
Md SD 95%CI Md SD 95%CI Md SD 95%CI
OpB
VT+ T -0.38 -0.40 0.73 -0.65 – -0.15 -0.36 -0.28 0.88 -0.70 – 0.14 -0.39 -0.52 0.54 -0.78 – -0.26
N 0.57 0.42 0.95 0.22 – 0.62 0.49 0.22 1.01 -0.07 – 0.51 0.64 0.61 0.86 0.36 – 0.86
F + VF 1.65 1.71 0.95 1.35 – 2.07 2.27 2.07 0.70 1.59 – 2.55 1.32 1.56 1.01 1.10 – 2.02
OpW
VUW + LUW -0.64 -0.64 0.86 -1.02 – -0.26 -0.65 -0.84 0.70 -1.22 – -0.46 -0.39 -0.25 1.06 -1.03 – 0.53
PW 0.40 0.29 0.90 0.11 – 0.47 0.56 0.32 0.94 0.05 – 0.59 0.23 0.27 0.87 0.03 – 0.51
LOW + VOW 1.35 1.57 0.90 1.27 – 1.87 1.74 1.78 0.83 1.26 – 2.30 1.32 1.49 0.93 1.12 – 1.86
SS_A
Group 1A1 -0.61 -0.62 0.93 -0.99 – -0.25 -0.67 -0.65 0.94 -1.09 – -0.21 -0.41 -0.51 0.98 -1.29 – 0.27
Group 2A2 0.25 0.21 0.83 0.02 – 0.40 0.56 0.35 0.82 0.11 – 0.59 -0.03 0.00 0.80 -0.30 – 0.30
Group 3A3 1.08 1.24 0.99 0.98 – 1.50 2.25 2.07 0.66 1.64 – 2.50 1.00 1.09 0.97 0.82 – 1.36
SS_B
Group 1B4 -0.40 -0.45 0.75 -0.68 – -0.22 -0.53 -0.67 0.78 -1.07 – -0.27 -0.36 -0.33 0.72 -0.60 – -0.06
Group 2B5 0.57 0.47 0.83 0.29 – 0.65 0.53 0.25 0.91 -0.02 – 0.52 0.72 0.72 0.65 0.51 – 0.93
Group 3B6 1.80 1.92 0.79 1.62 – 2.22 1.72 1.90 0.65 1.51 – 2.29 2.00 1.93 0.89 1.50 – 2.36
Variables of interest
Type of school
Public (n = 97) Private (n = 55)
Md SD 95%CI Md SD 95%CI
OpB
VT+ T -0.40 -0.47 0.70 -0.75 – -0.19 -0.30 -0.22 0.80 -0.72 – 0.27
N 0.57 0.33 0.97 0.09 – 0.57 0.59 0.60 0.90 0.27 – 0.92
F + VF 1.29 1.58 0.88 1.08 – 2.08 1.85 1.81 1.01 1.30 – 2.33 OpW
VUW + LUW -0.70 -0.67 0.98 -1.19 – -0.16 -0.50 -0.54 0.58 -1.00 – -0.08
PW 0.25 0.19 0.88 -0.03 – 0.40 0.56 0.51 0.91 0.20 – 0.83
LOW + VOW 1.20 1.40 0.83 1.02 – 1.78 1.66 1.75 0.97 1.29 – 2.21 SS_A
Group 1A# -0.48 -0.49 1.01 -0.96 – -0.03 -0.89 -0.99 0.55 -1.43 – -0.55
Group 2A& -0.06 0.01 0.86 -0.25 – 0.27 0.53 0.50 0.69 0.24 – 0.75
Group 3A§ 0.97 0.98 0.92 0.69 – 1.28 1.64 1.72 0.95 1.30 – 2.13
SS_B
Group 1B† -0.48 -0.51 0.78 -0.78 – -0.25 -0.28 -0.23 0.61 -0.63 – 0.17
Group 2B‡ 0.58 0.43 0.82 0.20 – 0.67 0.56 0.52 0.86 0.23 – 0.81
Group 3B¶ 1.32 1.63 0.76 1.25 – 2.02 2.35 2.28 0.69 1.89 – 2.67
Md: Median; : mean; SD: standard-deviation; 95%CI: 95% conidence interval; OpB: opinion on body; VT: very thin; T: thin; N: normal; F: fat; VF: very fat; OpW: Opinion on weight; VUW: very underweight; LUE: a little underweight; PW: proper weight; LOW: a little overweight; VOW: very overweight; SS_A: silhouette scale A; #Figures 1, 2 and 3; &Figures
DISCUSSION
The results in this study suggest that OpB and OpW have relatively diferent meanings for adolescents. They also suggest that, in general, OpB presents higher weighted Kappa values than OpW in the analysis of agreement with the variables in silhouette scales, and that OpW presents better results than OpB in the analysis of agreement with NS. But both variables, with this categorization, present good discriminatory power of BMI when being examined as a continuous variable. Therefore, based on this set of results, OpB seems to be better than OpW to compose the group of variables in a surveillance system of risk and protective factors addressed to adolescents.
Other studies compared OpB or OpW with NS3,4,22,29-32. However, only two of them, which
analyzed OpB and NS, adopted the Kappa statistics as a parameter to analyze agreement. In the irst one, which used data from students analyzed by PeNSE 2009, Kappa value was of 0.334. In the second one, which analyzed members of the birth cohort of 1993 in the
city of Pelotas, Rio Grande do Sul, Kappa value was 0.3622. These results are in accordance
with ours, which estimated Kappa value of 0.36 for the total studied group.
In studies comparing body image indicators with NS among adolescents, on the one hand, indings show that boys tend to underestimate their weight3,22,23; they tend to classify
themselves as having a proper silhouette even when presenting with excessive weight34. On
the other hand, indings demonstrate that girls tend to overestimate their weight and classify themselves with excessive weight, when they are in fact eutrophic22,33.
However, Castro et al.4 discussed this interpretation, which is common in literature, by
saying that in the comparison between data referring to NS and body image, the former is taken as the expression of reality, and the latter, as being prone to distortion. These authors state that, for adolescents, this approach should be weighted, and their questioning is based on the limitations of the individual anthropometric nutritional diagnosis for adolescents, because: (a) the available nutritional classiications do not consider the sexual maturation of the adolescent, and such a phenomenon has a huge inluence on body dimensions and proportions; besides, it difers much from one person to another, especially by the age group analyzed here; and (b) it is common that the adopted cutof points for the diagnosis of underweight and excessive weight present diferent sensitivity and speciicity, which leads to diferent proportions of false-positives and false-negatives for the diagnosis.
With regard to diferences according to type of school, even if, in general, better results of agreement have been obtained among private school students, the two analyzed strata demonstrated the two main indings of this study: better OpB performance in relation to OpW, in the comparison with both silhouette scales, and the association between body image categories and BMI gradient. Concerning the external validity of indings and their application on the national scenario, it is worth to mention that, in the studied sample, older students participated more (≥ 15 years old; 63.2%) in comparison with data from PeNSE 2009, in the city of Rio de Janeiro (37.2%), and with the set of analyzed students (28.5%). In the studied sample, it was also possible to observe the higher proportion of students in private schools (36.2%) in relation to Rio de Janeiro and the set of Brazilian capitals and the Federal District in 2009 (23.4 and 20.8%, respectively) 4,10. Since some analyses had better performance of agreement
between the studied indicators for private school students, this diference in the proportion of students in each type of school may have led to the overestimation of results with regard to what would be observed for the set of the population. Anyway, it is worth to mention the fact that results of the association between body image variables and BMI gradient were the same when controlled for age, sex and type of school the students attended.
A second aspect to be considered is the fact that students did not answer the questions about body image on the same day. Given the subjective nature of the subject, it could be possible to suppose that the student’s opinion on his or her body could not be the same on each day, which could potentially introduce a variability component into the analysis of agreement. The time interval between the first and the last visit comprehended four opportunities of contact with the students and, each of these times, they answered one of the questions about body image. We believe that, even if subjective, n this period of time this subject would not present variability to compromise the analyses conducted here.
CONCLUSION
This study was innovative in some ways: (a) possibility to examine, in the same sample, diferent subjective parameters (questions about body image and silhouette scales), and to compare them with an objective parameter (body mass index), and (b) in this comparison, it is interesting to treat the body mass index as a continuous variable and to examine its association with body image variables, to complement the traditional analysis of agreement between these variables and nutritional classiication groups.
1. Schilder P. The Image and Appearance of the Human Body. London: Routledge; 1999.
2. Thompson JK. Body image, eating disorders and obesity. Washington D.C.: American Psychological Association; 1996.
3. Wang Y, Liang H, Chen X. Measured body mass index, body weight perception, dissatisfaction and control practices in urban, low-income African American adolescents. BMC Public Health 2009; 9: 183.
4. Castro IRR, Levy RB, Cardoso LO, Passos MD, Sardinha LMV, Tavares LF, et al. Imagem corporal, estado nutricional e comportamento com relação ao peso entre adolescentes brasileiros. Ciênc Saúde Coletiva 2010; 15(Suppl 2): 3099-3108.
5. Cubrelati BS, Rigoni PAG, Vieira LF, Belem IC. Relação entre distorção de imagem corporal e risco de desenvolvimento de transtornos alimentares em adolescentes. Conexões (Online) 2014; 12(1): 1-15.
6. Kubota LC. Discriminação contra os estudantes obesos e os muito magros nas escolas brasileiras. Instituto de Pesquisa Econômica Aplicada (IPEA) 2014. Disponível em: http://www.ipea.gov.br/portal/index. php?option=com_content&view=article&id=21310. (Acessado em 21 de abril de 2014).
7. World Health Organization (WHO). Inequalities in young people’s health: key indings from the Health Behavior in School-aged Children (HBSC) 2005/2006 survey. Copenhagen: WHO; 2008. Disponível em: http://www.euro.who.int/__data/assets/pdf_ ile/0004/83695/fs_hbsc_17june2008_e.pdf. (Acessado em 8 de junho de 2011).
8. Centers for Disease Control and Prevention (CDC). Youth Risk Behavior Surveillance System (YRBSS). Atlanta: Centers for Disease Control and Prevention, 2011. Disponível em: http://www.cdc. gov/HealthyYouth/yrbs/index.htm. (Acessado em 08 de junho de 2011).
9. Pan American Health Organization (PAHO). Global School-Based Student Health Survey
(GSHS). Washington: PAHO; 2011. Disponível em: http://new.paho.org/hq/index.php?option=com_ content&task=view&id=2721&Itemid=2199. (Acessado em 19 de agosto de 2011).
10. Instituto Brasileiro de Geograia e Estatística (IBGE). Pesquisa Nacional de Saúde do Escolar (PeNSE) 2009. Rio de Janeiro: IBGE; 2009. Disponível em http:// www.ibge.gov.br/home/estatistica/populacao/pense/ default.shtm. (Acessado em 8 de junho de 2011).
11. Malta DC, Sardinha LMV, Mendes I, Barreto SM, Giatti L, Castro IRR, et al. Prevalência de fatores de risco e proteção de doenças crônicas não transmissíveis em adolescentes: resultados da Pesquisa Nacional de Saúde do Escolar (PeNSE), Brasil, 2009. Ciênc Saúde Coletiva 2010; 15(Suppl 2): 3009-19.
12. Côrtes MG, Meireles AL, Friche AAL, Caiafa WT, Xavier CC. O uso de escalas de silhuetas na avaliação da satisfação corporal de adolescentes: revisão sistemática da literatura. Cad Saúde Pública 2013; 29(3): 427-44.
13. Thompson MA, Gray JJ. Development and validation of a new body-image assessment scale. J Pers Assess 1995; 64(2): 258-69.
14. Stunkard AJ, Sorensen T, Schulsinger F. Use of theDanish Adoption Register for the study of obesity and thinness. In: Kety SS, Rowland LP, Sidman RL, Matthysse SW. The genetics of neurological and psychiatric disorders. New York: Raven Press; 1983. p.115-20.
15. Kakeshita IS, Silva AIP, Zanatta DP, Almeida SS. Construção e idedignidade teste-reteste de escalas de silhuetas brasileiras para adultos e crianças. Psic Teor e Pesq 2009; 25(2): 263-70.
16. Conti MA, Latorre MRDO. Estudo de validação e reprodutibilidade de uma escala de silhueta para adolescentes. Psicol Estud 2009; 14(4): 699-706.
17. Galindo EMC. Tradução, adaptação e validação do Eating Behaviours and Body Image Test (EBBIT) em crianças do sexo feminino na cidade de Ribeirão Preto- SP [dissertação de mestrado]. São Paulo: Escola de Enfermagem da USP; 2005.
18. Laus MF, Almeida SS, Murarole MB, Braga-Costa TM. Estudo de validação e idedignidade de escalas de silhuetas brasileiras em adolescentes. Psic Teor Pesq 2013; 29(4): 403-9.
19. Castro IRR, Cardoso LO, Engstrom EM, Levy RB, Monteiro CA. Vigilância de fatores de risco para doenças não transmissíveis entre adolescentes: a experiência da cidade do Rio de Janeiro, Brasil. Cad Saúde Pública 2008; 24(10): 2279-88.
20. Cardoso LO. Fatores associados ao excesso de peso e peris de consumo e comportamento alimentar de adolescentes [tese de doutorado]. Rio de Janeiro: Escola Nacional de Saúde Pública Sérgio Arouca, Fundação Oswaldo Cruz; 2010.
21. El Ansari W, Clausen SV, Mabhala A, Stock C. How do I look? Body image perceptions among university students from England and Denmark. Int J Environ Res Public Health 2010; 7(2): 583-95.
22. Araújo CL, Dumith SC, Menezes AMB, Hallal PC. Peso medido, peso percebido e fatores associados em adolescentes. Rev Panam Salud Publica 2010; 27(5): 360-7.
23. World Health Organization (WHO). Obesity: preventing and managing the global epidemic. Report on WHO Consulation (WHO Technical Report Series 894). Geneva: WHO; 1997.
24. World Health Organization (WHO). Growth reference data for 5-19 years. WHO Reference 2007. Geneva: WHO; 2007. Disponível em: http://www. who.int/growthref/en/. (Acessado em 8 de junho de 2011).
25. Fleiss JL, Cohen J. The equivalence of weighted kappa and the intraclass correlation coefficient as measures of reliability. Educ Psychol Meas 1973; 33: 613-19.
26. Byrt T. How good is that agreement? Epidemiology 1996; 7(5): 561.
27. Luiz RR. Métodos estatísticos em estudos de concordância. In: Medronho RA, Bloch KV, Luiz RR, Werneck GL. Epidemiologia. 2 ed. São Paulo: Editora Atheneu; 2009.
28. De Onis M, Onyango AW, Borghi E, Siyam A, Nishida C, Siekmann J. Development of a WHO growth reference for school-aged children and adolescents. Bull World Health Organ 2007; 85(9): 660-7.
29. Khor GL, Zalilah MS, Phan YY, Ang M, Maznah B, Norimah AK. Perceptions of body image among Malaysian male and female adolescents. Singapore Med J 2009; 50(3): 303-11.
30. Valverde PR, Santos FR, Rodríguez CM. Diferencias de sexo em imagen corporal, control de peso e Índice de Masa Corporal de los adolescentes españoles. Psicothema 2010, 22(1): 77-83.
31. Fonseca H, Matos MG, Guerra A, Gomes-Pedro J. How much does overweight impact the adolescent developmental process? Child Care Health Dev 2010, 37(1): 135-42.
32. Ferreira AA, Nogueira JAD, Wiggers I, Fontana KE. Composição e percepção corporal de adolescentes de escolas públicas. Motricidade 2013; 9(3): 19-29.
33. Branco LM, Hilário MOE, Cintra IP. Percepção e satisfação corporal em adolescentes e a relação com seu estado nutricional. Rev Psiquiatr Clína 2006; 33(6): 56-60.
34. Przysławski J, Stelmach M, Grygiel-Górniak B, Mardas M, Walkowiak J. Nutritional status, dietary habits and body image perception in male adolescents. Acta Sci Pol Technol Aliment 2010, 9(3): 383-91.
35. Adami F, Frainer DES, Almeida FS, Abreu LC, Valenti VE, Demarzo MMP, et al. Construct validity of a igure rating scale for Brazilian adolescents. Nutr J 2012; 11: 24.
Received on: 09/26/2013