*Correspondence: Bala Sekhara Reddy. Challa. Nirmala College of Pharmacy, 3/116-A, Madras Road, Kadapa, A.P, India -516 002. Email: [email protected]; [email protected]
A
rti
Pharmaceutical Sciences vol. 47, n. 1, jan./mar., 2011
Method development and validation for naratriptan determination
in human plasma by HPLC with tandem mass spectrometry
detection, and its application to bioequivalence study
Balasekhara Reddy Challa
1,2*, Bahlul Zayed Shtaiwy Awen
3,
Babu Rao Chandu
3, Rihana Parveen Shaik
11Jawaharlal Nehru Technological University, Anantapur, A.P, India-515002, 2Nirmala College of Pharmacy, Kadapa, A.P, India-516002,
3School of Pharmacy, Al-Jabal Al-Gharbi University, Libya
The authors developed a simple, sensitive and speciic liquid chromatography-tandem mass spectrometry (LC–MS/MS) method for the quantiication of naratriptan (NP) in human plasma using naratriptan-d3 (NPD3) as an internal standard (IS). Chromatographic separation was performed on a Zorbax SB-C18, 75 x 4.6 mm, 3.5 µm column with an isocratic mobile phase composed of 0.1% formic acid : acetonitrile
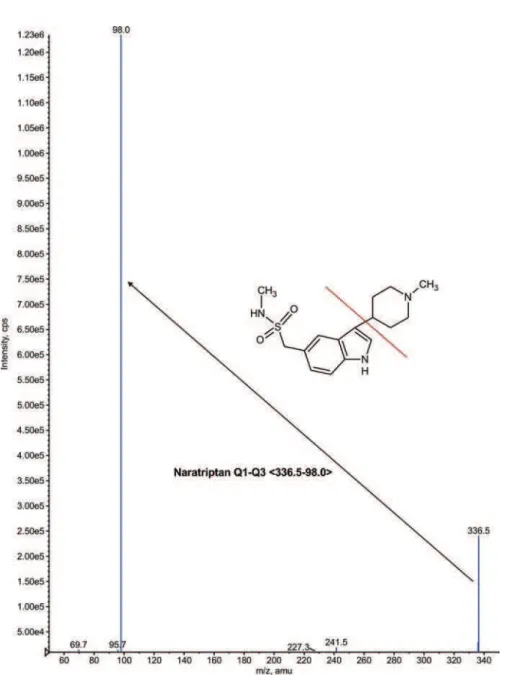
(50:50 v/v), at a low-rate of 0.6 mL/min. NP and NPD3 were detected with proton adducts at m/z 336.5→98.0 and 339.4→101.0 in selected reaction monitoring (SRM) positive mode, respectively.
The liquid-liquid extraction method was used to extract the NP and NPD3. This method was validated over a linear concentration range of 0.1-25.0 ng/mL with a correlation coeficient of (r2) ≥ 0.9998. The
Intra-day and Interday precision was found to be 1.8 to 3.6%, and 2.3 to 2.6%, and accuracy to be 101.7- 104.2% and 101.8 to 102.9%, respectively. NP was found to be stable throughout freeze-thaw (three cycles), bench top and auto sampler stability studies. This method was successfully applied for the analysis of plasma samples following oral administration of NP (2.5 mg) in 31 healthy Indian male human volunteers under fasting conditions.
Uniterms: Liquid chromatography/quantitative analysis. Mass spectrometry/quantitative analysis. Naratriptan/determination/human plasma.
Os autores desenvolveram um método simples, sensível e específico de cromatografia líquida-espectrometria de massa-tandem (LC-MS/MS) para a quantiicação de naratriptan (NP) em plasma humano empregando naratriptan-d3 (NPD3) como padrão interno de referência (IS). A separação cromatográica foi realizada em coluna Zorbax SB-C18, 75 x 4,6 mm, 3,5 µm com fase móvel isocrática composta por 0,1% ácido fórmico : acetronitrila (50:50 v/v) e taxa de luxo de 0,6 mL/min. NP e NPD3 foram detectados com adutos de prótons a m/z 336.5→98.0 e 339.4→101.0 in em modo positivo do tipo
monitoramento de reação selecionada (SRM), respectivamente. Extração líquido-líquido foi empregada para extrair NP e NPD3, sendo o método validado para uma faixa linear de concentração de 0,1-25,0 ng/mL resultando em coeiciente de correlação (r2) ≥ 0,9998. A variação intra e interdia observada para precisão
foi de 1,8 a 3,6% e 2,3 a 2,6%, respectivamente; para exatidão a variação foi de 101,7 a 104,2% e 101,8 a 102,9%, respectivamente. O NP se mostrou estável frente a processos de congelamento-descongelamento (3 ciclos), e estudos de estabilidade de bancada e amostragem automática. O método desenvolvido foi aplicado com sucesso para a análise de amostras de plasma após a administração oral de 2,5 mg de NP em 31 voluntários humanos, de nacionalidade indiana, sexo masculino, sob condições aceleradas.
INTRODUCTION
NP is chemically known as N-methyl-2-�3-(1-meth- N-methyl-2-�3-(1-meth-ylpiperidin-4-yl)-1H-indol-5-yl] ethane sulfonamide. The molecular formula is C17H25N3O2S, which corresponds to
a molecular weight of 335.47. NP is a triptan drug used for the treatment of migraine headaches, and is a selec-tive 5-hydroxytryptamine 1 receptor subtype agonist. It is well absorbed (74% oral bioavailability with peak plasma concentrations after 2-5 hours) having 28-31% protein binding, and is metabolized by a wide range of cytochrome P450 isoenzymes into a number of inactive metabolites, and has a 5-8 hour half life (Fuseau et al., 1997).
Several techniques such as luorometry and liquid chromatography (LC) methods have been reported in the literature for the quantitative estimation of NP in biologi-cal luids (Vishwanathan et al., 2000; Ptacek et al., 2009; Dulery et al., 1997; Gueorguieva et al., 2005). Dulery et al.
(1997) developed a method in rabbit plasma, using a liquid chromatographic-electrospray-mass spectrometric assay for the determination sumatriptan and naratriptan. To date, only a few methods have been developed in human plasma for quantiication of NP (Vishwanathan et al., 2000; Ptacek
et al., 2009; Dulery et al., 1997; Gueorguieva et al., 2005) by LC-MS/MS. Vishwanathan, Bartlett, Stewart (2000) developed a method for determination of antimigraine compounds rizatriptan, zolmitriptan, naratriptan and sumatriptan in human serum by liquid chromatography (LC MS/MS) with a solid phase extraction method, and observed good linearity between the concentration ranges of 1.0 - 100.0 ng/mL. However, the extraction method is expensive for large sample analysis.
The purpose of this investigation was to develop a simple, sensitive, selective and reproducible analytical method for the quantitative estimation of NP in a small vol-ume of human plasma using deuterated internal standard. It is also envisaged that this method will be able to provide an eficient solution for pharmacokinetic, bioavailability or bioequivalence studies of NP.
MATERIALS AND METHODS
Materials
Naratriptan hydrochloride was obtained from APL Research, India, and naratriptan–d3 hydrochloride was obtained from Torronto Research Chemicals, Ontario, Canada. Analytical grade sodium carbonate, tertiary butyl methyl ether, formic acid and acetonitrile were purchased from SD ine chemical Ltd, Mumbai, India. Human plasma (K2EDTA) was purchased from the Navjeevan blood bank,
Hyderabad, India. Double distilled water was used for all the experiments.
Instrumentation and detection
The HPLC system (1200 series, Agilent technolo-gies, Waldbronn, Germany) was employed. A Mass spec-trometer API 4000 triple quadrupole instrument (ABI-SCIEX, Toronto, Canada) was used.Turbo ion spray positive mode with unit resolution, SRM was used for detection. For NP, �M+H]+ (m/z 336.5) was monitored as
the precursor ion and a fragment at m/z 98.0 was chosen as the product ion. For NPD3, the �M+H]+ (m/z 339.4)
was monitored as the precursor ion and a fragment at m/z 101.0 was monitored as the product ion. Mass parameters were optimized as source temperature 600 °C, nebulizer gas 25 psi, heater gas 35 psi, curtain gas 20 psi, CAD gas 5 psi (nitrogen), ion spray voltage 5500 V, source low rate 600 µL/min without split, entrance potential 10 V, declustering potential 40 V, collision energy 16 V, and collision cell exit potential 6 V for both analyte and internal standard.
Chromatographic conditions
A Zorbax SB-C18, 75 × 4.6 mm, 3.5 µm, was se-was se- se-lected as the analytical column. The mobile phase compo-. The mobile phase compo-sition was 0.1% formic acid: acetonitrile (50:50 v/v). The low rate of the mobile phase was set at 0.6 mL/min. The column temperature was set at 50 °C. NPD3 was used as the appropriate internal standard. The retention time of NP and NPD3 were found to be 1.2 ± 0.2 min, respectively with a total run-time of 2 min for each sample.
Preparation of standards and quality control (QC) samples
Sample preparation
Liquid-liquid extraction was used to isolate NP and NPD3 from human plasma. A volume of 50 µl of NPD3 (30.0 ng/mL) and 250 µL of plasma sample (respective concentration) were added to polypropylene tubes, vor-texed briely and placed in an ice bath. This process was followed by addition of 250 µL of 0.5 N sodium carbonate, 2.5 mL of extraction solvent (tertiary butyl methyl ether) and vortexed for approximately 10 min.Further samples were centrifuged at 4000 rpm for 5 min at 4 °C. Superna-tant from each sample was transferred into polypropylene tubes and evaporated to dryness under nitrogen at 40 °C. Finally, dried residue from each tube was reconstituted with 250 µL of reconstitution solution (acetonitrile: 0.1% formic acid (50:50 v/v) and vortexed briely. Subsequently, 20 µL of sample from each tube was transferred into auto sampler vials and injected into the LC-MS/MS.
Recovery
The extraction recovery of NP and NPD3 from hu-man plasma was determined by analyzing quality control samples. Recovery at three concentrations (0.3, 7.5 and 17.5 ng/mL) was determined by comparing peak areas ob-tained from the plasma sample, and the standard solution spiked with the blank plasma residue. A recovery of more than 50% was considered adequate to attain the required sensitivity.
Limit of quantiication (LOQ)
Peak response (peak area) was determined in blank plasma samples (six replicates from different plasma) and in spiked LOQ sample prepared from the same plasma. The peak area of blank samples should be no greater than 20% of the mean peak area of LOQ of NP, and no greater than 5% of NPD3. The precision and mean accuracy of the back calculated LOQ replicate concentrations must be ≤ 20 and ± 20 %, respectively.
Analytical curves, regression model
The analytical curves were constructed using values ranging from 0.1 to 25.0 ng/mL of NP in human plasma. Calibration curves were obtained by the weighted qua-dratic model with the log-transformed regression model. The ratio of NP peak area to NPD3peak area was plotted against NPconcentration in ng/mL. The suitability of the calibration curve was conirmed by back-calculating the concentrations of the calibration standards.
Log y = a log (x2) +b log (x) + c
y = peak area ratio (PAR) of NP to NPD3 x = concentration (ng/mL) of NP in plasma. Coeficients a, b and c, the coeficient of determina-tion (r2) and x was calculated using weighted 1 quadratic
model with log-transformed regression analysis.
Calibration curve standards and quality control samples
Calibration curve standard samples and quality control samples were prepared in replicate (n=6) for analy-sis. The correlation coeficient (>0.9998) was obtained by using the quadratic model with the log-transformed regression model across the whole range of tested con-centrations.
Precision and accuracy
Precision and accuracy for the back-calculated con-centrations of the calibration points should be within ± 15% of their nominal values. For LOQ however, precision and accuracy should be within ± 20%.
Stability (Freeze- thaw, Auto sampler, Bench top, Re-injection, Long term)
Low quality control and high quality control sam-ples (n=6) were retrieved from the deep freezer after three freeze-thaw cycles according to the clinical protocol. Samples were stored at -30 oC in three cycles of 24, 36 and
48 h. In addition, the long-term stability of NP in quality control samples was also evaluated by analysis after 100 days of storage at −30 oC. Autosampler stability was
stu-died following a 101.5 h storage period in the autosampler tray. Bench-top stability was studied for a 25 h period. Re-injection stability was proved for one reinjection. Sta-bility samples were processed and extracted along with the freshly spiked calibration curve standards. The precision and accuracy for the stability samples must be within 15 and ± 15% of their nominal concentrations, respectively.
Matrix effect
The matrix effect was performed in order to deter-mine the matrix effect (ion suppression/ ion enhancement) qualitatively on different lots of blank plasma (6 lots from K2EDTA blank plasma), using triplicate analysis at low
plasma (6 lots from K2 EDTA blank plasma) of extracted blank matrix while the aqueous standard was infused. No signiicant matrix effect was observed.
Column to column reproducibility
Column to column reproducibility was determined by injecting analytical standards, matrix blank and QC standards on different columns. The results showed good reproducibility.
Standard and stock solution stability
Standard stock solution stability at room temperature in white light under laboratory conditions and refrigerated conditions for NP and NPD3 was performed as part of the method development process. The results showed good stability for 57 days under refrigerated conditions.
Analysis of patient samples
The bio-analytical method described above was used to determine NP concentrations in plasma following oral administration in healthy human volunteers. These volunteers were contracted in APL Research Pvt. Ltd., Hyderabad, India... and each of the 31 healthy volunteers was administered a 2.5 mg dose (one 2.5 mg tablet) by the oral route with 240 mL of drinking water. The reference product Amerge tablets (GSK) 2.5 mg and test product NP tablet (Test tablet) 2.5 mg were used. The study protocol was approved by the IEC (Institutional Ethics Committee) as per ICMR guidelines (Indian Council of Medical Re-search). Blood samples were collected at pre-dose (0hr), 5 minutes prior to dosing, followed by further sample taken at 0.5, 1, 1.33, 1.67, 2, 2.33, 2.67, 3, 3.33, 3.67, 4, 4.5, 5, 6, 8, 10, 12, 14, 18, 24 and 30 hours. After dosing, 5 mL of blood was taken at each collection and placed in vacutainers containing K2EDTA. Collections were taken
for 44 (22 time points for test and reference, respectively) time points using centrifugation 3200 rpm at 10 °C for 10 min, and storage at -30 °C until sample analysis. Test and reference were administered separately to the same human volunteers under fasting conditions with proper wash-out periods as per the protocol approved by IEC.
Pharmacokinetics and statistical analysis
Pharmacokinetics parameters for the human plasma samples were calculated by a non-compartmental statistics model using WinNon-Lin5.0 software (Pharsight, USA). Plasma samples were taken for a period of 3 to 5 times
the terminal elimination half-life (t1/2), considered the area
under the concentration time curve (AUC) ratio higher than 80%, as per FDA guidelines. Plasma NP concentra-tion–time proiles were visually inspected, and Cmax and
Tmax values were determined. The AUC0–t was obtained
by the trapezoidal method. AUC0–∞ was calculated up to
the last measureable concentration and extrapolations were obtained using the last measureable concentration, and the terminal elimination rate constant (Ke). Ke was
estimated from the slope of the terminal exponential phase of the plasma of the NP concentration–time curve by the linear regression method. The terminal elimination half-life t1/2, was then calculated as 0.693/Ke. Regarding AUC0–t, AUC0–∞and Cmax bioequivalence was assessed
by analysis of variance (ANOVA) and by calculating the standard 90% conidence intervals (90% CIs) of the ratio’s test/reference (logarithmically transformed data). The bioequivalence was considered when the ratio of averages of log transformed data was within 80–125% for AUC0–t
, AUC0–∞and Cmax.
RESULTS AND DISCUSSION
Method development and validation
SRM channels were tuned, the mobile phase was changed from an aqueous phase to a more organic phase with acid dopant to obtain a fast and selective LC method. Good
separation and elution were achieved using 0.1% formic acid: acetonitrile (50:50 v/v) as the mobile phase, at a low-rate of 0.6 mL/min with a 10 µL injection volume.
FIGURE 1 - Chemical structures of Naratriptan and Naratriptan –D3
Selectivity
The analysis of NP and NPD3 using MRM function was highly selective with no interfering compounds (Fi-gure 4A). Chromatograms obtained from plasma spiked
with NPD3(30.0 ng/mL) are shown in Figure 4B, and
spiked with NP(0.1 ng/mL) and NPD3(30.0 ng/mL) are shown in Figure 4C.
Matrix effect
To predict the variability of matrix effects in samples from individual subjects, the matrix effect was quantiied by determining the matrix factor, which was calculated as follows.
Peak response ratio in the presence of extracted matrix Matrix Factor = –––––––––––––––––––––––––––––––––––––––––––––Peak response ratio in aqueous standards
Six lots of blank biological matrix were spiked, each in triplicate, with the aqueous standard at the mid QC level, and compared against aqueous standards of the same con-centration in alternate injections. The overall precision of the matrix factor is expressed as coeficient of variation (% CV) and was determined to be ≤ 15% for NP.
Linearity
Calibration curves were plotted as the peak area
FIGURE 4A - SRM chromatograms of naratriptan and
naratriptan-d3 in blank human plasma.
FIGURE 4B - Spiked human plasma containing 30.0 ng/mL
naratriptan-d3�Blank+IS].
FIGURE 4C - spiked human plasma containing 0.1 ng/mL
naratriptan and 30.0 ng/mL naratriptan-d3�LLOQ].
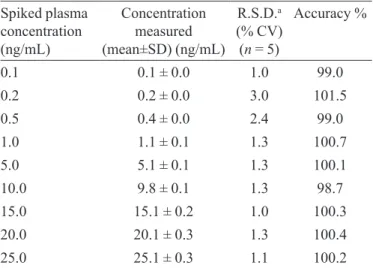
tio (NP and NPD3) versus NP concentration. Calibration was found to be linear over the concentration range of 0.1 - 25.0 ng/mL. The R.S.Ds was less than 15%,and the accuracy ranged from 98.7 to 101.5%. The determination coeficients (r2) were greater than 0.9998 for all curves
(Table I).
TABLE I - Calibration curve details from one batch of the
validation section
Spiked plasma concentration (ng/mL)
Concentration measured (mean±SD) (ng/mL)
R.S.D.a
(% CV) (n = 5)
Accuracy %
0.1 0.1 ± 0.0 1.0 99.0
0.2 0.2 ± 0.0 3.0 101.5
0.5 0.4 ± 0.0 2.4 99.0
1.0 1.1 ± 0.1 1.3 100.7
5.0 5.1 ± 0.1 1.3 100.1
10.0 9.8 ± 0.1 1.3 98.7
15.0 15.1 ± 0.2 1.0 100.3
20.0 20.1 ± 0.3 1.3 100.4
25.0 25.1 ± 0.3 1.1 100.2
Precision and accuracy of quality control standards
The quantitative accuracy and precision of the as-say was evaluated on an inter-asas-say basis, using prepared QC standards at three concentrations spanning the range of the analytical standard curve. Precision is expressed as % CV. Precision and accuracy for this method was controlled by calculating the intra and inter-batch varia-tions at three concentravaria-tions (0.3, 7.5 and 17.5 ng/mL) of QC samples in six replicates. As shown in Table II, Intra and inter-day CV% ranged from 1.8 to 3.6 and from 2.3 to 2.6%, respectively, while Intra and inter-day accuracy ranged from 101.7 to 104.2% and from 101.0 to 102.9%, respectively, for NP. These results indicate the adequate reliability and reproducibility of this method within the analytical range.
Stability (Freeze- thaw, Auto sampler, Room temperature, Long term)
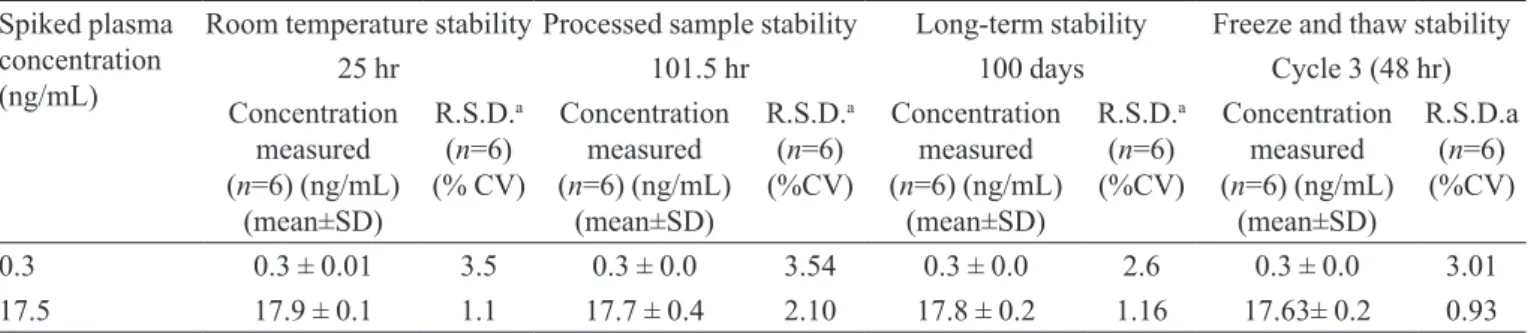
Quantiication of NP in plasma subjected to 3 free-ze–thaw (-30 oC to room temperature) cycles veriied the
stability of the analyte. No signiicant degradation of NP was observed even after a 101.5 h storage period in the autosampler tray, and the inal concentrations of NP ranged from 97 to 104%. In addition, the long-term stability of NP in QC samples after 100 days of storage at -30 oC was also
evaluated. The concentrations ranged from 99 to 106% (Table III). These results conirmed the stability of NP in human plasma for at least 100 days at -30 oC.
Recovery
The recovery following sample preparation using the Liquid-liquid extraction method with tertiary butyl methyl ether was calculated by comparing the peak area ratios of NPin plasma samples with the peak area ratios of solvent samples, and was estimated at control levels of NP. The re-covery of NP, determined at three different concentrations 0.3, 7.5 and 17.5 ng/mL, were found to be 67.8, 70.5 and 71.7%, respectively. The overall average recovery of NP and NPD3 were found to be 70.02 and 70.49%.
Limit of detection (LOD)
The limit of detection was determined using aqueous solutions. For NP, 10 µL of 5 pg/mL solution was injected, yielding 0.05 pg/mL.
Application to biological samples
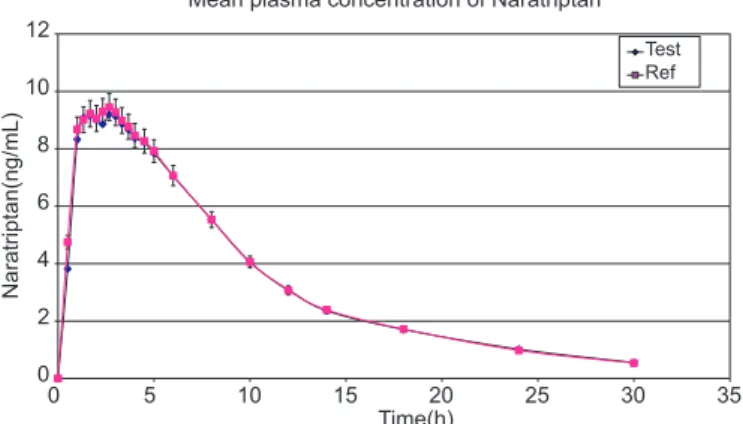
The above-validated method was used in the de-termination of NP in plasma samples for establishing the bioequivalence of a single 2.5 mg dose (one 2.5 mg tablet) in 31 healthy volunteers. Typical plasma con-centrations versus time proiles are shown in Fig. 5. All the plasma concentrations of NP were within the stan-dard curve region and remained above the 0.1 ng/mL LOQ for the entire sampling period. The observed ma-ximum plasma concentration (Cmax) for the standard and
test were 94.5±3.36 and 92.0±3.33 ng/mL, respectively.
FIGURE 5 - Mean plasma concentrations of test vs. reference
after a 2.5 mg dose (one 2.5 mg Tablet) single oral dose (31 healthy volunteers).
TABLE II - Precision and accuracy (analysis with spiked plasma samples at three different concentrations)
Spiked plasma concentration (ng/mL)
Within-run (n=6) Between-run (n=30)
Concentration measured (ng/mL)
(mean±SD.) R.S.D.
a (% CV) Accuracy % measured (ng/mL) Concentration
(mean±SD.) R.S.D.
a (%CV) Accuracy %
0.3 0.3±0.0 3.6 101.7 0.3 ± 0.0 2.6 101.0
7.5 7.8±0.1 1.8 104.0 7.6 ± 0.2 2.3 101.2
17.5 18.2±0.5 2.7 104.2 18.0 ± 0.4 2.4 102.9
The corresponding time of maximum concentration (Tmax)
for reference and test were found to be 2.67 and 2.67 hr, respectively. The value of the area under the curve from time 0 to the last sampling time (AUC0–t) for the
stan-dard and test were found to be 103.04 ± 2.86 and 102.08 ± 2.89 ng.hr/mL, respectively. The area under the curve from 0 to ∞ (AUC0–∞) was 108.48 ng.h/mL for the standard and
107.97 ng.hr/mL for the test. The elimination half-life (t1/2) was 7.05 hr for the reference drug and 7.45 hr
for the generic drug. In addition, the mean ratio of
AUC0–t/AUC0–∞ was higher than 90%, in accordance
to the Food and Drug Administration Bioequivalence Guideline. The test/reference ratio (T/R) and 90% coni-dence intervals (90 CIs) for overall analysis fell within the previously stipulated range (80–125%). The T/R ratio and 90 CIs (in parenthesis) were 97.31% for Cmax, 99.06% for AUC0–t , and 99.53% for AUC0–∞. Therefore, it can be concluded that the two NP formulations (reference and test) analyzed are bioequivalent.
CONCLUSION
The proposed method offers signiicant advantages over previously reported methods in terms of simplicity, sensitivity, selectivity, ruggedness and reproducibility. The major advantage of this method is the use of a minimal volume of 250 µL plasma sample that greatly facilitates blood sample collection. In addition, this method has shown a wider linearity range from 0.1 to 25.0 ng/mL. No side effects were observed during or after the study by the volunteers who participated. Limit of detection (LOD) was proved for 0.05 pg/mL. NP and NPD3 were eluted within 1.2 ± 0.2 min with a total run time of 2 min. This method was fully validated as per FDA guidelines and successfully applied in bioequivalence studies to evaluate the plasma concentrations of NP in healthy human volunteers.
TABLE III - Stability of the samples
Spiked plasma concentration (ng/mL)
Room temperature stability Processed sample stability Long-term stability Freeze and thaw stability
25 hr 101.5 hr 100 days Cycle 3 (48 hr)
Concentration measured (n=6) (ng/mL)
(mean±SD)
R.S.D.a
(n=6) (% CV)
Concentration measured (n=6) (ng/mL)
(mean±SD)
R.S.D.a
(n=6) (%CV)
Concentration measured (n=6) (ng/mL)
(mean±SD)
R.S.D.a
(n=6) (%CV)
Concentration measured (n=6) (ng/mL)
(mean±SD)
R.S.D.a (n=6) (%CV)
0.3 0.3 ± 0.01 3.5 0.3 ± 0.0 3.54 0.3 ± 0.0 2.6 0.3 ± 0.0 3.01
17.5 17.9 ± 0.1 1.1 17.7 ± 0.4 2.10 17.8 ± 0.2 1.16 17.63± 0.2 0.93
a �Standard deviation/mean concentration measured] x 100.
ACKNOWLEDGEMENTS
The authors would like to thank the IICT (Indian Institute of Chemical Technology), Hyderabad, India, for providing the literature survey, and APL Research Pvt. Ltd., Hyderabad, India for carrying out this research work.
REFERENCES
BOULTON, D. W.; DUNCAN, G. F.; VACHHARAJANI, N. N. Validation and application of a high-performance liquid chromatography/tandem mass spectrometry assay for sumatriptan in human plasma. Biomed. Chromatogr., v.17, n.1, p.48-55, 2003.
DULERY, B. D.; PETTY, M. A.; SCHOUN, J.; DAVID, M.; HUEBERT, N. D. A method using a liquid chromatographic-electrospray-mass spectrometric assay for the determination of antimigraine compounds: preliminary pharmacokinetics of MDL 74,721, sumatriptan and naratriptan, in rabbit. J. Pharm. Biomed. Anal., v.15, n.7, p.1009-1020, 1997.
FEMENIA-FONT, A.; MERINO, V.; RODILLA, V.; LOPEZ-CASTELLANO, A. High-performance liquid chromatographic determination of sumatriptan after in vitro transdermal diffusion studies. J. Pharm. Biomed. Anal., v.37, n.3, p.621-626, 2005.
FUSEAU, E.; WEBSTER, C.; ASPHARNEJAD, M.; HUFFMAN, C. Factors affecting oral naratriptan pharmacokinetics in migraine subjects. J. Neurol. Sci., v.150, suppl.1, p.S33, res.1-21-10, 1997.
GUIDANCE for industry: bioanalytical method validation. In: U.S. Department of Health and Human Services, Food and Drug Administration, Center for Drug Evaluation and Research (CDER), Center for Biologics Evaluation and Research (CBER). 2001. Available: http://www.fda.gov/ downloads/Drugs/GuidanceComplianceRegulatoryInform ation/Guidances/ucm070107.pdf. 5 may 2001
VISHWANATHAN, K.; BARTLETT, M. G.; STEWART, J. T. Determination of antimigraine compounds rizatriptan, zolmitriptan, naratriptan and sumatriptan in human serum by liquid chromatography/electrospray tandem mass spectrometry. Rapid Commun. Mass Spectrom., v.14, n.3, p.168-172, 2000
PTACEK, P.; KLÍMA, J.; MACEK, J. Optimized method for the determination of itopride in human plasma by high-performance liquid chromatography with fluorimetric detection. J. Chromatogr., B: Anal. Technol. Biomed. Life Sci., v.877, n.8/9, p.842-846, 2009.
WADE, A.; PAWSEY, S.; WHALE, H.; BOYCE, M.; WARRINGTON, S. Pharmacokinetics of two 6-day frovatriptan dosing regimens used for the short-term prevention of menstrual migraine A phase I. randomized, double-blind, placebo-controlled, two-period crossover, single-centre study in healthy female volunteers. Clin. Drug Invest., v.29, n.5, p.325-337, 2009.
XU, X. H.; BARTLETT, M. G.; STEWART, J. T. Determination of degradation products of sumatriptan succinate using
LC-MS and LC-LC-MS-LC-MS. J. Pharm. Biomed. Anal., v.26, n.3,
p.367-377, 2001.
Received for publication on 16th January 2010