Article
Printed in Brazil - ©2013 Sociedade Brasileira de Química0103 - 5053 $6.00+0.00
A
*e-mail: diego.ahumadaf@utadeo.edu.co
Multiresidue Determination and Uncertainty Analysis of Pesticides in Soil by
Ultrafast Liquid Chromatography Coupled to Mass Spectrometry
Diego A. Ahumada,*,a Luis A. Ariasb and Carlos R. Bojacác
aLaboratorio de Inocuidad Química, Centro de Bio-Sistemas, bDepartamento de Ciencias
Biológicas y Ambientales and cDepartamento de Ciencias Básicas, Facultad de Ciencias Naturales
e Ingeniería, Universidad de Bogotá Jorge Tadeo Lozano, Bogotá, Colombia
Este trabalho apresenta os resultados da validação de um método simples, rápido e de baixo custo de preparação de amostras para a determinação de resíduos de pesticidas em solo por cromatografia líquida ultrarrápida acoplada a espectrometria de massas com ionização por electrospray. O método se baseia na extração com acetonitrila assistida por ultrassom, centrifugação e evaporação, sem etapa de purificação adicional. As recuperações foram avaliadas a partir de dois tipos de solo, apresentando resultados na faixa de 70-110%, com desvio padrão relativo menor que 20%. Os coeficientes de correlação para as curvas analíticas de calibração foram maiores do que 0,99. Os resíduos de pesticidas foram detectados em solos no intervalo de 1-62 ng g-1, dependendo do
composto. A incerteza do método foi estimada a partir de diferentes experimentos de adição e recuperação e materiais certificados. O processo de extração foi identificado como a principal fonte de incerteza e as incertezas expandidas para cada pesticida, utilizando-se um fator de cobertura de 2, situaram-se entre 8,4 e 33%. O método proposto foi aplicado para a determinação de pesticidas em amostras reais.
This work presents the validation results of a simple, fast and low-cost sample preparation method for the determination of pesticide residues in soil by ultrafast liquid chromatography coupled to electrospray ionization mass spectrometry. The method uses acetonitrile ultrasound-assisted extraction, centrifugation and evaporation step, without further cleanup. Recovery studies were performed for two soil blanks, presenting results in the range of 70-110% with relative standard deviation lower than 20%. The correlation coefficients for analytical calibration curves were higher than 0.99. Pesticide residues were detected in soils in the range of 1-62 ng g-1, depending
on the compound. The uncertainty of the method was estimated from different addition-recovery experiments and calculations from certificates. The extraction process was identified as the main source of uncertainty, and the expanded uncertainties for each pesticide, using a coverage factor of two, were between 8.4 and 33%. The proposed method was applied to the determination of pesticides in real samples.
Keywords: pesticide, mass spectrometry, liquid chromatography, soil
Introduction
Soil is a valuable natural resource that needs to be preserved and, if possible, its quality and productive capacity improved. The agricultural soils of several regions in the world are known to store a wide range of contaminants, especially pesticides and heavy metals.1,2 Once a pesticide is released into the soil matrix, its effects will depend on both its characteristics and those of the soil.3,4 The organic matter is the key soil component in
retaining pesticides. The binding of pesticides to the organic matter decreases its potential for downward movement through the soil.5
The need to determine as many compounds (e.g., pesticides) as possible in an environmental sample has fostered the development of multiresidue analysis protocols, in which attention must be devoted to the sample preparation and chromatographic determination steps.7 Current methods for determining pesticides in soil often require continuous8 and discontinuous liquid solid extraction,9 supercritical fluid extraction,10solid phase microextraction,11,12 solid-phase extraction,13,14 pressurized liquid extraction,15,16 ultrasonic-assisted extraction and other procedures.17,18 The main problem with these techniques is the low selectivity towards the analytes. During the extraction step, many interfering components are co-extracted from soil samples together with target analytes, requiring a cleanup to remove those that could affect the accuracy and precision of the method.7 However, due to recent technological developments, such as quads, ion traps and other mass filters, mass spectrometry has acquired a high specificity and selectivity in a wide mass range. This trend has led to an almost complete elimination of interferences at the target signal entry while keeping a suitable sensitivity. Such advances have turned out into the development of analytical techniques requiring the least possible number of steps in sample processing and a minimal chromatographic retention, such as the QuEChERS (Quick, Easy, Cheap, Effective, Rugged and Safe) method.19
In this work, the full laboratory validation of a multiresidue analysis method based on ultrasound-assisted extraction followed by an evaporation step is reported. A simultaneous determination of 30 currently used pesticides in soils by ultrafast liquid chromatography coupled to mass spectrometry (UFLC-MS) was carried out with excellent selectivity, high sensitivity and a wide application scope. Finally, to allow adequate interpretation of the analytical results obtained with the developed method, an innovative uncertainty estimation method20 was applied for the first time to the analysis of contaminants in soils.
Experimental
Chemicals and reagents
Pesticide reference standards (all > 95% purity) were obtained from Dr. Ehrenstorfer GmbH (Augsburg, Germany) and Chemservice (West Chester, PA, USA). The pesticides used in this study were chosen for their different physicochemical properties, some have been reported as soil pollutants in the literature21 and are widely used in Colombia, especially in potato and tomato crops, which are staples in the country.22 Triphenylphosphate and
tributylphosphate were used as surrogate and internal standard (I.S.), respectively. All solvents used were of HPLC grade JT Baker (Phillipsburg, NJ, USA). Sodium acetate and anhydrous sodium sulfate (dried at 650 ºC for 4 h) were both of analytical grade. Distilled water was provided by a Milli-Q water purification system from Millipore (Bedford, MA, USA). Formic acid (99%) was purchased from Carlo Erba (Milan, Italy) and ammonium acetate was obtained from JT Baker.
Standard solutions
Standard stock solutions were prepared in a concentration around 1000 µg mL-1, using either acetonitrile or methanol as solvent, and were stored in amber glassware under appropriate conditions such as –20 °C, exclusion of moisture and light. Mixture standard stock solutions were prepared by dilution of the corresponding stock solution with methanol according to the UFLC-MS response. The obtained solutions were stored in a refrigerator at −20 ºC.
Soil samples
Two soils were used for this study and their physicochemical characterization was performed at the Soils Laboratory at Jorge Tadeo Lozano University (Colombia). Soil A (Boyaca, Colombia) had a clay content of 400 g kg-1, an organic matter content of 40.3 g kg-1 and a cation exchange capacity of 21.2 cmol kg-1. A second soil B (Cundinamarca, Colombia) had a clay content of 190 g kg-1, an organic matter content of 194 g kg-1 and a cation exchange capacity of 51.8 cmol kg-1. The soil samples were dried at room temperature for 2 days and sieved, obtaining particle sizes lower than 2 mm. Blank matrices obtained (soils A and B) were checked to be free of the target pesticides before spiking.
Sample preparation
A 5 g sample was weighed in a 50 mL polypropylene centrifuge tube with screw caps. Recovery studies for validation were carried out by adding appropriate volumes of the working standard solution to blank samples. Then, 10 mL of acetone were added, and the samples were homogenized by mixing and shaking for 30 min on a horizontal shaker. After the bulk of the solvent evaporated at room temperature, the soil samples were stored at 4 ºC in a centrifuge tube for 3 days to allow the interaction between the compounds and the soils, according to Garcia et al.23
the samples were vigorously shaken for 15 min at 25 °C in a horizontal shaker. Then, 20 mL of acetonitrile were added, and the sample was vigorously shaken by hand for 2 min after screwing the tube caps. Next, the sample was sonicated for 20 min in an ultrasonic bath working at 50/60 Hz and 100 W from Branson. After this, 4 g of anhydrous magnesium sulfate (MgSO4) were added. The tubes were capped and immediately shaken by hand for 2 min and centrifuged for 5 min at 4500 rpm.
On the other hand, aiming to improve the sensitivity of the method, a concentration step upper layer (acetonitrile) was needed. So, 15 mL of this extract were left in a 50 mL polypropylene centrifuge tube and, placed into a vacuum speed concentrator, in which the volume was reduced to
ca. 500 µL. After, this extract was quantitatively transferred
into a 1 mL volumetric flask, 20 µL of I.S. were added, and acetonitrile was employed to complete to volume. Finally, the supernatant was filtered through a 0.22 µm PTFE filter. At the initial step, triphenylphosphate (TPP) was spiked to reach a 0.3 µg mL-1 concentration in the UFLC-MS extract. The internal standard was used at a concentration of 0.5 µg mL-1.
Instrumentation
The chromatographic analyses were performed on an ultra-high speed liquid chromatograph Shimadzu Prominence™ coupled to an LCMS-2020 mass selective detector (Maryland, CA, USA). The chromatograph was equipped with an automatic sampler, a binary high pressure pump, an online degasification system and an oven to control the column temperature. An ABN2ZE Peak Scientific (Billerica, MA, USA) nitrogen generator was employed. The data acquisition, control and processing were performed using the Lab Solutions software version 3.5. The instrumental conditions were previously optimized.23
A Shim Pack C18 column (75 mm × 2 mm i.d., 2.1 µm particle size and stationary phase C18), a linear gradient mode consisting of 0.1% m v-1 formic acid and 5 mmol L-1 ammonium acetate in Milli-Q grade water (A) and acetonitrile (B) were used to perform the separation. The program used expressed as B percentage was: first, 0% at 0.2 min, afterwards, a rising to 40% at 1 min, and then, again to 100% in the next 7 min, and finally, a hold time of 1 min. Thereafter, the initial condition was restored in 2 min, and held for 5 min to reach the equilibrium. The flow rate of the mobile phase was 0.3 mL min-1 at a column temperature of 40 ºC. An aliquot of 5 µL of the extracts
was injected into UFLC system.
A built-in DUIS (ESI, APCI) interface operating in ESI (electrospray ionization) mode, a drying gas flow rate
of 15 L min-1 and a nebulizer gas flow rate of 1.5 L min-1 were used. The temperatures of the heating block and of the desolvation line were 200 and 250 °C, respectively. The analysis was carried out in both positive and negative modes; the applied voltages at the capillary were 4500 and
−4500 V, respectively. Selected ion monitoring (SIM) of the
most abundant ions of each compound was used. However, when a compound gave matrix interferences, another product ion was selected.
Validation and uncertainty
The validation procedure was performed following SANCO/825/2010.24 Linear dynamic range, precision, recovery, lower limits, selectivity, ruggedness and uncertainty were evaluated for the analytical methodology developed. For linear dynamic range, the calibration samples were prepared by appropriate dilution of the stock solution in blank matrix extract in order to avoid matrix effects. Calibration solutions, at concentrations ranging between 2 and 1640 ng mL-1, were used.
Intra-assay precision and recovery were assessed using spiked blank samples at two concentration levels, at twice the first level of the calibration curve and at 80% the highest level. On a set of replicated (n = 6) samples, the relative standard deviation (RSD) and recovery values were calculated. The limits of detection (LOD) and quantification (LOQ) were calculated according to IUPAC recommendation.25
The presence of potential interferences in the chromatograms from the analyzed samples was monitored by running control blank samples on each calibration. The absence of any chromatographic components at the same retention times as target pesticide suggested that no chemical interferences occurred.
Uncertainty on pesticide measurements was evaluated based on a hybrid bottom up/top down approach, assuming that they comprise the total analytical procedure.20 Six replicates of soil were fortified at 50 ng g-1 at different stages of the analytical procedure: extraction, evaporation and UFLC analysis. The uncertainties of the gravimetric and volumetric measurements, as well as the standard purity, were estimated and integrated in the calculation of the total combined uncertainty. Then, the most of the contributions were obtained from the statistical analysis of repeated measurements to estimate the combined uncertainty and some sources were obtained from calibration certificates. Uncertainty was further divided into the following sources: (i) calibration solutions, (ii) extraction, (iii) evaporation,
(iv) UFLC calibration and (v) instrumental analysis.
were combined according to the law of propagation of uncertainties, obtaining the combined standard uncertainty. The expanded uncertainty (U) is obtained by multiplying the relative uncertainty by a coverage factor k, assuming a normal distribution of the measurand.
Results and Discussion
Method optimization
Based on our previous work and other publications, the key factors that affect the extraction efficiency in ultrasound-assisted extraction methods were investigated here in detail.26 Firstly, ultrasound-assisted extraction of 5 g of soil was initially carried out for 15 min with 10 mL of four organic solvents with different polarity, methanol, acetonitrile, ethyl acetate and their mixture, used as extractants to investigate their impact on recoveries. High recoveries (68.7-115.2%) were obtained when acetonitrile was used as extractant. It is attributed to the wide range of physicochemical properties of the analytes (polarity, solubility, volatility, etc.), and in addition, the relatively low polarity of ethyl acetate does not allow adequate recovery of some compounds, such as methamidophos, acephate, thiocyclam, carbendazim, dimethoate, etc. Furthermore, the use of methanol in the extraction step does not help in the physical separation of the phases because it is very miscible with the water, being discarded in the extraction. Secondly, the effect of the addition of water (i.e., 2, 3, 4 and 5 mL) was assayed. A volume of 5 mL of water was chosen as the optimum volume because the final extract provided the best recoveries and lowest noise in the chromatograms. This noise reduction provides a higher signal-to-noise ratio, being attributed to the addition of water, which functions as liquid-liquid partition cleanup, removing the water-soluble interference. The acetonitrile volume (10-30 mL) effect on the recoveries was also tested. The results showed that recoveries reached their maximum when the extraction was performed with 20 mL. To obtain the optimal ultrasound time, the sample was sonicated for 0, 10, 20 and 30 min. The results showed that the extraction efficiency increased at first by increasing the ultrasound time up to 20 min, and then did not change with further increase of time. Thus it was concluded that these conditions exhibited excellent extraction capabilities; therefore, no further optimization would be needed. All experiments were performed in quintuplicate.
Validation: specificity
To investigate specificity, 10 different soil samples were extracted and analyzed. All samples had low intensity
peaks in the region of interest (± 0.5% of the expected retention time of the pesticides). Although there was an apparent presence of famoxadone and chlorfenapyr, their presences were discarded because the relative intensities of fragment ions did not correspond to reference values. Given the efficient separation obtained from the ultrafast liquid chromatography and the high selectivity of mass spectrometric analysis, the absence of significant interferences was not surprising.
Validation: matrix effects and linearity
The matrix effect was studied by comparison of the slopes of the analytical calibration curves in solvent and matrix. The matrix/solvent slope ratio for each compound was obtained (Table 1) considering a signal enhancement or suppression effect as acceptable if the slope ratio ranged from 0.8 to 1.2. A value < 1 indicates signal suppression due to the matrix, while values > 1 involve enhancing effect of the matrix on the analyte signal. Slope ratios higher than 1.2 or lower than 0.8 indicate a strong matrix effect. It can be observed that a significant matrix effect was noticed for chlorfenapyr, famoxadone, hexaconazole, imazalil, methomyl, methoxyfenozide, oxamyl and spinosad, whereas tolerable matrix effect was observed for the rest of the compounds. As illustrated in Table 1, most compounds showed signal suppression in the matrices investigated; only spinosad had increase or signal enhancement.
Calibration curves were obtained from matrix-matching calibration solutions. The lowest concentration level in the calibration curve was established according to signal-noise ratio (S/N > 10). Linearity was evaluated by the calculation of a five-point linear plot with three replicates, based on the linear regression and squared correlation coefficient (r2) which should be > 0.9900. The model was validated using a regression analysis of variance (ANOVA). Table 1 shows the linear range for each pesticide and r2 values above or equal to 0.9903.
Validation: LOD and LOQ
problems related to low chromatographic response of these pesticides and the presence of interferences with retention time near these compounds.
The limits of quantitation were determined as the lowest concentration of pesticide that gives a response that could be quantified with acceptable precision and accuracy under the stated operational conditions of the method. Table 2 shows the average recoveries obtained from six spiked samples at LOQ. The recovery rates were adequate, ranging from 70 to 120% with an RSD below 15% (Table 2).
Validation: trueness and precision
Trueness of the analytical procedure was determined by evaluating the recovery of spiked analyte from two
soils. Recoveries and relative standard deviations obtained for six replicate samples of soils A and B, spiked at two different concentration levels, are reported in Table 2. Recoveries were in the range of 68.7-115.2%, which is a satisfactory performance. Trueness of the method was proven using a significance test (Student’s t-test) with
5% statistical significance level. According to the current European Union guidelines on pesticide residue analytical methods, the recoveries obtained during the validation of the method should be within 70-120%.24,27 However, in certain justified cases, typically with multiresidue methods, recoveries outside this range may be accepted, especially if they are consistent. All pesticides showed particularly good recoveries in the studied soils, most of them ranging from 100 to 120%. The lowest recoveries
Table 1. Linear range, slope ratios between matrix-matched and solvent calibration, determination coefficient (r2), limit of detection (LOD) and limit of
quantitation (LOQ)
Compound Linear range / (ng mL-1)
Matrix/Solvent
slope ratios r2
LOD / (ng g-1)
LOQ / (ng g-1)
Acephate 7.3-88 0.98 0.9962 3.0 11.0
Azoxystrobin 3.3-40 0.83 0.9944 2.0 5.0
Benalaxyl 2.0-24 0.82 0.9913 1.0 3.0
Carbendazim 2.0-24 0.93 0.9909 1.0 3.0
Carbofuran 3.3-40 0.82 0.9928 2.0 5.0
Chlorfenapyr 105-1264 0.75 0.9949 47.0 158.0
Cymoxanil 101-1216 0.99 0.9980 46.0 152.0
Difenocolazole 3.3-40 0.94 0.9903 2.0 5.0
Dimethoate 3.3-40 0.82 0.9975 2.0 5.0
Tiabendazole 2.0-24 0.89 0.9987 1.0 3.0
Dimetomorph 2.0-24 0.86 0.9985 1.0 3.0
Famoxadone 137-1640 0.74 0.9932 62.0 205.0
Hexaconazole 18-216 0.76 0.9903 8.0 27.0
Imazalil 7.3-88 0.80 0.9949 3.0 11.0
Imidacloprid 48-576 0.98 0.9927 22.0 72.0
Indoxacarb 4.7-56 0.98 0.9924 2.0 7.0
Metalaxyl 2.0-24 0.88 0.9926 1.0 3.0
Methomyl 3.3-40 0.75 0.9986 2.0 5.0
Methoxyfenozide 6.7-80 0.76 0.9908 3.0 10.0
Monocrotophos 6.7-80 0.82 0.9942 3.0 10.0
Pyrimethanil 2.0-24 0.94 0.9930 1.0 3.0
Tebuconazole 15.3-184 0.90 0.9965 7.0 23.0
Thiocyclam 28-336 0.81 0.9913 12.0 42.0
Propanil 9.2-109 0.79 0.9922 4.1 13.7
Oxamyl 8.8-106 0.77 0.9930 4.0 13.3
Thiodicarb 9.6-115 0.96 0.9925 4.0 14.3
Atrazine 9.0-108 0.87 0.9970 4.1 13.5
Pirimicarb 9.1-109 0.97 0.9917 4.1 13.6
Spinosad 22.1-265 1.25 0.9942 9.9 33.2
were those achieved for spinosad in soil B, being consistent with that reported in literature in which the physicochemical properties of soil affect the extraction of some pesticides.28
The results obtained from the trueness experiments were used to estimate the precision of the method. The precision of the method is evaluated by its repeatability (variation of the results obtained in a same series), expressed as relative standard deviation or RSDr, and its intermediate precision (variation of the results obtained in different series) is also expressed as a relative standard deviation, often called RSDR. The RSDr values, presented in Table 2, were less than 15% for all concentration levels tested, except for the lowest one, in which the RSDr value was 36.8%. For
intermediate precision, an increase in the values of RSDR was found, but any pesticide exceeded the 20%, except acephate and spinosad in soil B. The behavior of spinosad may be attributed to an irreversible adsorption in the soil, being consistent with the high content of organic matter that this soil presented.
Validation: ruggedness
The ruggedness was investigated using a Youden experimental design, introducing minor reasonable variations by the laboratory and by observing their consequences. Such a design allows the study of a maximum of seven factors (variables) with eight
Table 2. Recovery values (R) and relative standard deviations (RSDs) of the target compounds in two soils
Compound
Soil A Soil B
Ra / % (RSDb
r / %) R / % (RSDr / %) RSDRc / %
LOQd 5 × LOQd LOQ 5 × LOQ LOQ 5 × LOQ
Acephate 101.2(7.1) 95.8(6.9) 117.1(16.6) 116.2(12.2) 20.8 12.9
Azoxystrobin 93.4(4.2) 93.9(2.5) 75.7(7.0) 102(9.4) 8.5 10.5
Benalaxyl 106.3(5.1) 101.3(3.7) 75.2(6.2) 81.5(9.4) 7.2 11.1
Carbendazim 81.3(2.1) 99.4(4.6) 102.6(5.2) 112.3(10.0) 7.1 11.1
Carbofuran 105.1(5.5) 95.1(4.5) 83.7(6.4) 97.9(7.3) 8.5 8.7
Chlorfenapyr 88.5(9.9) 95.1(5.5) 91.5(9.2) 82.5(9.5) 11.4 10.2
Cymoxanil 96.5(3.6) 101.1(4.2) 78.7(6.4) 91.7(5.6) 7.7 6.1
Difenocolazole 100(4.2) 103.4(3.4) 81.1(8.4) 71.9(12.3) 10.9 13.8
Dimethoate 101.5(4.9) 100.1(3.2) 76.9(4.1) 97.4(7.7) 6.1 8.9
Tiabendazole 71.9(3.6) 70.5(5.6) 68.5(6.9) 95.1(8.3) 5.0 8.9
Dimetomorph 96.5(4.9) 100(3.6) 109.7(6.8) 102.9(11.8) 8.2 12.8
Famoxadone 83.8(4.0) 88.9(7.0) 61.2(14.8) 90.3(12.0) 17.9 13.9
Hexaconazole 106.4(3.8) 104.6(3.9) 74.7(4.8) 85.5(10.2) 6.2 11.1
Imazalil 97.3(4.2) 102.6(4.4) 65.7(9.4) 75(11.8) 12.2 14.1
Imidacloprid 91.6(4.6) 94.6(5.2) 77.1(5.1) 87.4(6.5) 6.8 7.6
Indoxacarb 88.5(10.2) 96.9(9.5) 101.8(13.5) 86.9(10.9) 16.7 12.8
Metalaxyl 100.8(3.8) 107(4.1) 107.6(11.6) 114(7.2) 15.7 8.3
Methomyl 93.8(5.8) 88.2(3.1) 85.1(7.9) 102.7(6.1) 9.9 6.5
Methoxyfenozide 106.4(5.0) 104.8(4.0) 70.7(6.0) 89.3(9.9) 8.3 11.7
Monocrotophos 92.3(5.0) 101.4(4.6) 85.6(5.1) 95.5(6.3) 5.9 7.3
Pyrimethanil 88.9(5.2) 95.3(5.3) 108.8(5.3) 95.6(11.3) 6.8 12.5
Tebuconazole 92.9(10.0) 100.9(4.0) 72.3(3.4) 80.1(10.2) 11.2 11.1
Thiocyclam 85.2(6.9) 92.4(7.0) 101.7(9.0) 110.7(7.8) 10.6 8.4
Propanil 93.4(3.6) 101.4(4.4) 92.6(5.2) 99.9(6.3) 6.8 7.1
Oxamyl 100.5(7.6) 78.6(9.9) 86.5(12.2) 101.3(9.9) 15.7 10.9
Thiodicarb 84.9(5.4) 79.5(4.4) 81.3(7.1) 74.6(5.9) 8.2 6.4
Atrazine 98.2(5.5) 91.5(5.4) 95.2(6.9) 90.6(5.9) 9.0 6.9
Pirimicarb 99.5(5.1) 105.6(4.9) 90.6(6.1) 100.3(5.8) 7.6 6.7
Spinosad 76.6(9.0) 96.2(6.8) 17.7(31.4) 20.9(36.8) 40.4 40.5
Diazinon 100.8(7.4) 103.7(2.0) 92.4(7.1) 111.3(7.0) 10.0 7.5
aR: Recovery; bRSDr: repeatability; cRSD
experiments. It was established that the water volume, temperature, concentration and the pH of the mobile phase had the greatest effects on the robustness of the method. The factors over which it was not necessary to exercise strict control were the oven temperature, sodium acetate quantity, ultrasound time and MgSO4 quantity.
Uncertainty
Demonstrating the reliability of the analytical results is essential in order to interpret them correctly, and method validation is only the first step to achieve this. Indeed, it is not enough if one aims at interpreting and comparing results correctly. For this reason, the global uncertainty was determined for all pesticides at the level of 50 ng g-1, except imidacloprid, cymoxanil, chlorfenapyr and famoxadone which were evaluated at LOQ. Five different sources of uncertainty were taken into account, namely, the calibration graph (u1), the preparation of the calibration standard solutions (u2), the extraction procedure (u3), the evaporation process (u4) and the instrumental analysis (u5). The overall uncertainty (us) was given by equation 1.
(1)
Finally, this value was reported as expanded uncertainty, which is twice the value of the overall uncertainty. The principle and calculations in the present study are similar to the calculations made by Štĕpán et al.20
u1 and u2: calibration graph and solution preparation
The uncertainty u1 was given by equation 2:
(2)
where s is the standard deviation of the residuals of the calibration curve, b1 is the slope of the calibration curve, p is the number of measurements of the unknown, n is the number of points used to establish the calibration curve, C0 is the calculated concentration of the analyte from the calibration curve, ç is the average of all standards used to obtain the analytical calibration curve, and SXX is calculated as follows: SXX = Σ(cj – ç)2, where j = 1, 2, ..., n. c
j is the concentration of each calibration standard used to build up the analytical calibration curve.
The u2, associated with the preparation of the calibration standard solutions, is a combination of the uncertainty of the pesticide concentration (upest) given in the certificate of purity by the manufacturer at 95% confidence level (k = 2), the uncertainty from weighing given in the calibration
certificate of the analytical balance (uweight), and the uncertainty coming from the volumetric flasks and pipettes used for dilution (uV). Finally, u2 was given by equation 3.
(3)
u3, u4 and u5: extraction, evaporation and UFLC analysis
In the present study, uncertainty of each analytical step consists of random and systematic error components; thus, each component was quantified and incorporated into the combined standard uncertainty. For this purpose, the random errors of extraction, evaporation and UFLC analysis steps were approximated by the relative standard deviations which were calculated from repeated determinations of analytes (n = 6) at different stages of the analytical process. To determine the random components of uncertainty which can be separately assigned to extraction (u(r)Extr), evaporation (u(r)Evap) and UFLC (u(r)UFLC) steps, the following equations were used:
(4)
(5)
(6)
Systematic components of uncertainty (u(s)n) were estimated on the basis of the recovery for each stage of the method (extraction, evaporation and UFLC analysis). It is calculated by first estimating the uncertainty associated with the recovery from each fortification step, and then, using equations similar to equation 4-6. Uncertainties of these apparent recoveries were derived from a rectangular distribution using equation 7:
(7)
where n is the stage (extraction, evaporation or UFLC analysis) and R (%) is the recovery at the respective step. Then, random and systematic components of uncertainty of each analytical step were used for the calculation of the combined uncertainty associated with the analytical procedure (extraction, evaporation, UFLC, equations 8-10)
(8)
(9)
The calculated expanded standard uncertainties (u) for this method are given in Figure 1. This figure shows that the global uncertainty of the test pesticides varied up to 10%, with the exception of some compounds such as thiocyclam, oxamyl and methoxyfenozide. These results indicated that the method performance could be considered satisfactory for the whole range of the tested pesticides.
Using this method, the major contributor to the total combined uncertainty was the extraction step, with contributions ranging between 22 and 93%. Figure 2 shows the individual contributions of each step in the total uncertainty. The uncertainty related to calibration graph and
solution preparation did not contribute significantly to the total uncertainty estimate. The curve calibration contributed with less than 12% for the global uncertainty. The influence of standard preparation and instrumental analysis were quite similar between each other for most of the pesticides. Some analytes such as monocrotophos, imidacloprid, imazalil, propanil and chlorfenapyr had a high variance during the evaporation step. This behavior suggests that these compounds may have decomposition or volatilization losses.
Application to real samples
Twenty representative soil samples were collected from a farm located in Boyacá Department, Colombia (N 5°61’970’’; O 73°59’302’’). It is a farm dedicated to the production of greenhouse tomato, soils are clayey, median compaction, pH 5.5 and electrical conductivity of 0.685 S cm-1. The farm has a conventional agricultural management that includes pesticide application for managing different pests and diseases among which stand out the whitefly (Trialeurodes vaporariorum), gray mold
(Botrytis cinerea) and blight (Phytophthora infestans). The
samples were collected during ten weeks at each harvest date and were stored in plastic (high density polyethylene) containers (ca. 1 kg). The samples were stored in the dark at −18 oC until required for residue analysis. All samples were analyzed in duplicate.
Those samples were determined by the method established above and concentrations of the main pesticide residues are shown in Table 3. In this study, none pesticide residue was detected for the remaining weeks (2, 3, 5, 6, 7, 9 and 10). The results indicated that the presence of pesticide residues in soils of this crop is random, which may be due to many factors, such as environmental, crop management, stability of the pesticides, among other. All compounds detected were identified by comparing the retention times and product ion masses in both samples and matrix matched standards. For pyrimethanil, it was found that the S/N ratio in all cases was greater than three.
Figure 1. Expanded uncertainty (%) for each pesticide (coverage factor, k = 2).
Figure 2. Contribution of each source of uncertainty to the total uncertainty.
Table 3. Mean values (ng g-1) of pesticide concentrations determined in
soil samples
Week Pesticide Concentration and Ua / (ng g-1)
LOD / (ng g-1)
LOQ / (ng g-1)
1 pyrimethanil < LOQ 1.0 3.0
4 carbendazim 40.0 ± 5.0 1.0 3.0
8 pyrimethanil < LOQ 1.0 3.0
Comparison with previous works
Numerous methods for determining pesticide residues have previously been described in matrices, such as fruits, vegetables, cereals, water and others, but, until some years ago, in case of soils, many current pesticides are not included in a single method.29 On the other hand, most reported methods have a restricted range of applicability because they have been developed mainly for the analysis of just organochlorine pesticides,30,31 herbicides,28 or carbamates32 and there are few reports of simultaneously determining multiresidues in soils.33 For example, a recent study proposed headspace single drop micro-extraction for extraction of only five organophosphorus pesticides in soil.34 Although, it is noteworthy that the ultrasound use improved and accelerated the extraction of the analytes from the sample. On the other hand, a similar method has been reported for the analysis of cyantraniliprole and its metabolites by liquid chromatography with tandem mass spectrometry detection (LC-MS/MS), however this study is limited to only four compounds.26 Thus, the proposed procedure allows for screening of a much broader range of currently used pesticides (carbamates, organophosphorus, azoles and others) in just one analytical process. In addition, this method has great advantages in comparison with others, such as using a minimal amount of solvent without using any complex instrumentation, applicability to a broad range of pesticides and the method used for uncertainty estimation allows identifying the real weaknesses of the method compared to other approaches.
Conclusions
Using UFLC coupled to mass spectrometry, a method of analysis was developed for multiresidue determination of pesticides in soil. For a quantitative evaluation, matrix effects were evaluated by comparing the slopes of the matrix matched and solvent-based calibration curves. The matrix effects displayed by most pesticides and the matrix matched calibration were used to minimize any matrix effects. The sensitivity of the UFLC-MS method is sufficient to be applied to the determination of pesticide residues in soils. The LOD values obtained were lower than 5 ng g-1 for 22 pesticides, lower than 50 ng g-1 for 6 pesticides, and higher than 50 ng g-1 for only one compound. The low limits of detection, reliable linearity, precision and accuracy of the developed method exceed the requirements for assessing adherence to limits established by the current European regulations in pesticide contamination of soil. Finally, the uncertainty of the method was estimated from different experiments
on spiked samples and calculations from certificates. The extraction process was identified as the main source of uncertainty and the expanded uncertainties for each pesticide, using a coverage factor of two, were between 8.4 and 33%. Finally, this method was successfully applied to the analysis of pesticides in soils from a farm dedicated to the production of tomato.
Supplementary Information
Supplementary data (Tables and Figures) are available free of charge at http://jbcs.sbq.org.br as a PDF file.
Acknowledgements
The authors are grateful to the Centro de Bio-Sistemas and the funds from the Flemish Interuniversity Council (VLIR) through the project “Multidisciplinary assessment of efficiency and sustainability of smallholder-based tomato production systems in Colombia, with a roadmap for change” (code: ZEIN2009PR364).
References
1. Bünemann, E.; Schwenke, G.; Van Zwieten, L.; Soil Res. 2006,
44, 379.
2. Wei, B.; Yang, L.; Microchem. J.2010, 94, 99.
3. Gevao, B.; Semple, K. T.; Jones, K. C.; Environ. Pollut.2000, 108, 3.
4. Senesi, N.; Sci. Total Environ. 1992, 123-124, 63
5. Farenhorst, A.; Soil Sci. Soc. Am. J. 2006, 70, 1005.
6. Arias-Estévez, M.; López-Periago, E.; Martínez-Carballo, E.; Simal-Gándara, J.; Mejuto, J. C., García-Río, L.; Agr. Ecosyst. Environ. 2008, 123, 247.
7. Andreu, V.; Pico, Y.; TrAC, Trends Anal. Chem. 2004, 23, 772. 8. Lesueur, C.; Knittl, P., Gartner, M.; Mentler, A.; Fuerhacker, M.;
Food Control2008, 19, 906.
9. Börjesson, E.; Torstensson, L.; J. Chromatogr., A2000, 886,
207.
10. Rissato, S. R.; Galhiane, M. S.; Apon, B. M., Arruda, M. S.;
J. Agr. Food Chem. 2005, 53, 62.
11. Hou, L.; Lee, H. K.; J. Chromatogr., A2004, 1038, 37.
12. Moreno, D. V.; Ferrera, Z. S.; Rodríguez, J. J.; Anal. Chim. Acta 2006, 571, 51.
13. Zhu, X.; Yang, J.; Su, Q.; Cai, J.; Gao, Y.; J. Chromatogr., A 2005, 1092, 161.
14. Asensio-Ramos, M.; Hernández-Borges, J.; Borges-Miquel, T. M.; Rodríguez-Delgado, M. A.; Anal. Chim. Acta2009, 647, 167.
16. Concha-Graña, E.; Turnes-Carou, M. I.; Muniategui-Lorenzo, S.; López-Mahía, P.; Fernández-Fernández, E.; Prada-Rodríguez, D.;
J. Chromatogr., A 2004, 1047, 147.
17. Richter, P.; Sepúlveda, B.; Oliva, R.; Calderón, K.; Seguel, R.;
J. Chromatogr., A2003, 994, 169.
18 Tadeo, J. L.; Sánchez-Brunete, C.; Albero, B., García-Valcárcel, A. I.; J. Chromatogr., A2010, 1217, 2415.
19. Payá, P.; Anastassiades, M.; Mack, D., Sigalova, I.; Tasdelen, B.; Oliva, J.; Barba, A.; Anal. Bioanal. Chem. 2007, 389, 1697. 20. Štĕpán, R.; Hajšlová, J.; Kocourek, V.; Tichá, J.; Anal. Chim.
Acta2004, 520, 245.
21. Lesueur, C.; Gartner, M.; Mentler, A.; Fuerhacker, M.; Talanta 2008, 75, 284.
22. Bojacá, C.; Arias, L.; Ahumada, D.; Casilimas, H.; Schrevens, E.;
Food Control2013, 30, 400.
23. Garcia, C.; Herrero, S.; Pérez, J.; Moreno, B.; Anal. Chim. Acta 2011, 129, 136.
23. Ahumada, D.; Zamudio, A.; Rev. Colomb. Quim.2011, 40, 227.
24. http://ec.europa.eu/food/plant/protection/resources/guide_ doc_825-00_rev7_en.pdf, accessed in May2013.
25. Corley, J. In Handbook of Residue Analytical Methods for Agrochemicals; Lee, P., Ed.; Wiley & Sons: England, 2003,
ch. 4.
26. Dong, F.; Liu, X.; Xu, J.; Li, J.; Li, Y.; Shan, W.; Song, W.; Zheng, Y; Biomed. Chromatogr.2012, 26, 377.
27. http://ec.europa.eu/food/plant/protection/resources/ qualcontrol_en.pdf, accessed in May 2013.
28. Niell, S.; Pareja, L.; Asteggiante, L.; Roehrs, R.; Pizzutti, I.;
J. AOAC Int. 2010, 93, 425.
29. Rashmi, S.; Kannamkumarath, S.; J. Anal. Chem. 2004, 59, 1032.
30. Rashid, A.; Nawaz, S.; Barker, H.; Ahmad, I.; Ashraf, M.;
J.Chromatogr., A2010, 1217, 2933.
31. Ozcan, S.; Tor, A.; Aydin, M.; Anal. Chim. Acta 2009, 640, 52. 32. Sánchez-Brunete, C.; Rodriguez, A.; Tadeo, J.; J. Chromatogr,
A. 2003, 1007, 85.
33. Martínez, V.; Padilla, S.; Plaza-Bolaños, P.; Garrido, F.; Romero-González, R.; J. AOAC Int.2010, 93,1715.
34. Salemi, A.; Rasoolzadeh, R.; Nejad, M.; Vosough, M.; Anal. Chim Acta. 2013, 769, 121.
Submitted: December 27, 2012
Supplementary Information
0103 - 5053 $6.00+0.00S
I
*e-mail: diego.ahumadaf@utadeo.edu.co
Multiresidue Determination and Uncertainty Analysis of Pesticides in Soil by
Ultrafast Liquid Chromatography Coupled to Mass Spectrometry
Diego A. Ahumada,*,a Luis A. Ariasb and Carlos R. Bojacác
aLaboratorio de Inocuidad Química, Centro de Bio-Sistemas, bDepartamento de Ciencias
Biológicas y Ambientales and cDepartamento de Ciencias Básicas, Facultad de Ciencias Naturales
e Ingeniería, Universidad de Bogotá Jorge Tadeo Lozano, Bogotá, Colombia
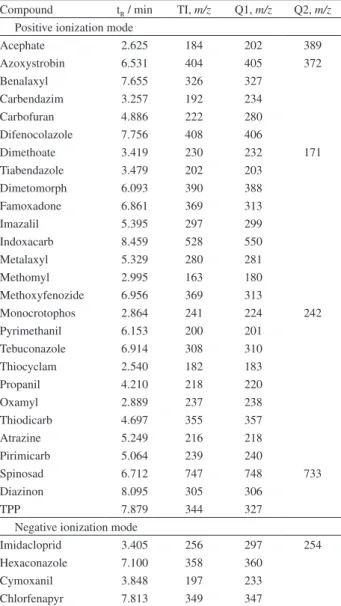
Table S1. Identification parameters of targeted pesticides obtained by UFLC/ESI-MS. Retention time (tR), target ion (TI) and qualifiers (Q1
and Q2)
Compound tR / min TI, m/z Q1, m/z Q2, m/z
Positive ionization mode
Acephate 2.625 184 202 389
Azoxystrobin 6.531 404 405 372
Benalaxyl 7.655 326 327
Carbendazim 3.257 192 234
Carbofuran 4.886 222 280
Difenocolazole 7.756 408 406
Dimethoate 3.419 230 232 171
Tiabendazole 3.479 202 203
Dimetomorph 6.093 390 388
Famoxadone 6.861 369 313
Imazalil 5.395 297 299
Indoxacarb 8.459 528 550
Metalaxyl 5.329 280 281
Methomyl 2.995 163 180
Methoxyfenozide 6.956 369 313
Monocrotophos 2.864 241 224 242
Pyrimethanil 6.153 200 201
Tebuconazole 6.914 308 310
Thiocyclam 2.540 182 183
Propanil 4.210 218 220
Oxamyl 2.889 237 238
Thiodicarb 4.697 355 357
Atrazine 5.249 216 218
Pirimicarb 5.064 239 240
Spinosad 6.712 747 748 733
Diazinon 8.095 305 306
TPP 7.879 344 327
Negative ionization mode
Imidacloprid 3.405 256 297 254
Hexaconazole 7.100 358 360
Cymoxanil 3.848 197 233
Figure S1. Chromatograms of target ions of pesticides analyzed by UFLC-MS at the concentration corresponding to LOQ.
Figure S2. Chromatograms of target ions in blank samples (with addition
of TPP).
Figure S3. Chromatograms of target ions in real sample (week 4). Signal in ca. 3.25 min is carbendazim.
Figure S4. Chromatograms of target ions in real sample (week 1). Signal