Analysis of Nuclear Relaxation in Granular Systems
Said R. Rabbania, Christovam Mendonc¸ab, J. B. Mamania, and Hern´an Cervantes R.a aDepartamento de F´ısica Geral, Instituto de F´ısica, Universidade de S˜ao Paulo,
Caixa Postal 66318, 05315-970-S˜ao Paulo, SP, Brazil and
bUniversidade Presbiteriana Mackenzie, Rua da Consolac¸ ˜ao 896, 1302-907, S˜ao Paulo , SP, Brazil
Received on 10 September, 2005; accepted on 28 November, 2005
The longitudinal nuclear magnetic relaxation time,T1, of powdered samples was analyzed following the
theory proposed by Browstein and Tarr to explain theT1reduction of water confined in biological cells and the
proposed by Rabbani and Edmonds where the molecular diffusion in liquids is substituted by spin diffusion to interpret theT1behavior in solid particles. We have shown that the multiexponential character of magnetization decay in solid particles with a narrow band size distribution allows to evaluate the spin diffusion coefficient of this material. On the other hand if the diffusion coefficient of a material is given and the average size of a sample of this material is known the relaxation decay curve can be used to determine the surface relaxivity as well as the relative size of particles present in the other samples of same material. However, this analysis is unable to provide the absolut measurement of the grain sizes. Furthermore, it is shown that the grain geometry does not influence the relaxation decay curve.
Keywords: Nuclear relaxation; Granular systems
I. INTRODUCTION
Longitudinal and transverse magnetic relaxation of nuclei in molecules within confined liquids and small particles show a distinct behavior as compared to those in bulk samples: the relaxation rates are enhanced and even when the decay in the bulk follows a single exponential law its confined counterpart may require a sum of exponentials for a correct description. These features are found in the nuclear relaxation of water in biological samples, fluids in porous media and fine powdered solids. The basic physical model is similar in all these cases: spin magnetization diffuses to the surface, where it decays in a very short time due to a stronger coupling with the lattice (for longitudinal magnetization) and internal magnetic field gradients (for transverse components). This is observed in bi-ological cells [1], where the proton relaxation of intracellular water is affected by interactions with free radicals and para-magnetic molecules in membranes. Also, in porous sedimen-tary rocks the proton magnetization rate of decay of absorbed water and hydrocarbons are improved by the molecular dif-fusion of fluids towards the surface [2], where they remain temporarily close to paramagnetic impurities and are relaxed. This effect is expected to provide information about the av-erage pore size, as a result of the sampling of the rock-fluid interface by the protons during the relaxation process. Rab-bani and Edmonds [3] (R&E) reported this same effect in fine solid grains and explained it in terms of a two sites model: each grain has molecules in the bulk, with a long relaxation time, magnetically coupled by spin diffusion to those resident in a thin layer at the surface. It is known that the phonon spectrum in the surface is distinct with respect to that in the bulk, due to a higher concentration of crystalline defects, like dislocations, or to the amorphous character caused by plastic deformations during the grinding process [4, 5]. The conse-quence is a stronger coupling of spins to the lattice due to vi-brations with increased number of degrees of freedom. These effects act in parallel, thus shortening the characteristic decay
time constants. Detectable changes in relaxation rates occur in cells, pores and grains with sizes of the order of one hun-dred micrometers or less, depending upon the absorbed fluid or the type of granulated solid. The spin diffusion process in these samples is similar to the spin diffusion toward the para-magnetic centers in doped single crystals [4, 6]. Brownstein and Tarr [1] (B&T) proposed a simple theory for proton re-laxation of water in biological cells, which found widespread applicability [7–11]. It is based on the hypotheses described earlier in this paragraph, with the spins in the bulk and in the surface coupled by means of molecular diffusion. The multi-exponential decay arises as a consequence of a sum of eigenvalue solutions associated with the size and shape of the cell. Since both water in biological tissue cells and grains of a powder have similar microstructures of small unconnected volumes, it is expected that the same solution can be applied to fine grains if the role of the bulk diffusivity of water in cells is replaced by the spin diffusion in the solid.
II. THEORY
Following B&T, the longitudinal magnetization component of a solid powder grain can be obtain as a solution of the mod-ified diffusion equation
∂M/∂t=D∇2M−M/T1b (1) subject to the surface boundary condition
[D~n·∇M+ρM]
S=0. (2)
compared to that in the bulk, relaxivity is defined as the layer thickness divided by the local relaxation time. The normal-ized amplitude of the detected signal, the relaxation function S(t), is
S(t) =m∞−m(t) f.m∞ =
exp(−t/T1b)
∞
∑
n=1In(ξn)exp £
−(4D/d2)ξ2nt¤, (3)
wherem(t)is the magnetic moment of a grain, given by,
m(t) = Z
M(r,t)dV (4)
andm∞ is its equilibrium value. The factor f is 1(2)for a saturation-recovery (inversion-recovery) sequence, as usual, andξnare roots of a transcendental eigenvalue equation of the form
F(ξn) =A= ρ d
2D, (5)
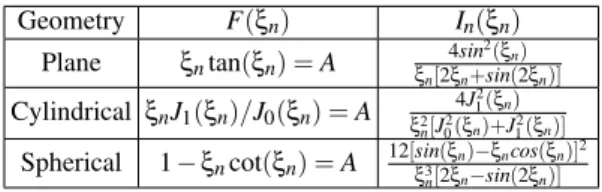
TABLE I: Characteristic eigenvalue equations derived from Eq. (2) and the corresponding expansion coefficients of Eq. (3) for different grain geometries, according to B&T.
Geometry F(ξn) In(ξn)
Plane ξntan(ξn) =A 4sin
2(ξ
n)
ξn[2ξn+sin(2ξn)] Cylindrical ξnJ1(ξn)/J0(ξn) =A 4J
2 1(ξn)
ξ2
n[J02(ξn)+J21(ξn)] Spherical 1−ξncot(ξn) =A 12[sin(ξn)
−ξncos(ξn)]2
ξ3
n[2ξn−sin(2ξn)]
derived from the boundary condition expressed in Eq. (2). The functions F(ξn)and the coefficients (intensities) In(ξn) are characteristic of the assumed shape for the grains; d is their typical size (diameter of sphere, cylinder, etc.). A is a dimensionless parameter reflecting the effectiveness of the surface in relaxing the diffusion transported magnetization, the reduced sink strength. The analytic forms ofF(ξn)and In(ξn)for plane, cylindrical and spherical geometry, detailed in B&T’s article, are reproduced in Table I.
The behavior of the magnetization decay is classified ac-cording to the value of the reduced sink strength:(a) A<<1 is the fast diffusion regime;M(r,t)is uniform over the grain volume and the decay is monoexponential with the time con-stantT0given by
1 T0
= 1 T1b
+ρ(S
V), (6)
where(S/V)is its surface area/volume ratio. In this regime the intensitiesIn, decrease roughly as 1/n4and therefore, the
summation in Eq. (3) is essentially resumed to the first term. (b) A>10 is the slow diffusion regime; the intensitiesIn de-crease roughly as 1/n2and are almost independent ofA. In this regime, several terms must be considered for a correct de-scription of the multiexponential decay.(c)1<A<10 is the intermediate condition.
Both cases(b)and(c)are inherently multiexponentials but this may also be observed in case(a)for a powdered sample with a wide distribution of grain size spreading over a range of an order of magnitude or greater. In this situation the summa-tion in Eq. (3) must be transformed into a volume weighted average. Another important result demonstrated by B&T is thatT0given by Eq. (6) is also the initial,t=0, decay time
constant in regimes(b)and(c).
Nonlinear regression of experimental relaxation data to Eq. (3) is expected to provide the bulk spin-lattice relaxation time T1b and the following parameters associated to the granular microstructure:
(a)the characteristic time Θ= d
2
4D, (7)
(b)the surface contribution to the initial decay time constant 1
T0S =ρ(S
V) =k ³ρ
d ´
, (8)
and(c)A, implicit in the rootsξ(n), as defined in Eq. (5);k
is a geometry dependent integer: 1 for planes, 4 for cylinders and 6 for spheres and cubes. There is yet the following equa-tion relating these parameters leaving only two independent ones
A.T0S Θ =
2
k . (9)
Although our description is referring to longitudinal relax-ation, the conclusions for transverse relaxation are entirely analogous, differing only in the experimental method and the value of the relaxivity.
III. EXPERIMENTAL PART
Six powdered maleic acid samples differing in the average grain sizes were prepared from the raw commercial grade ma-terial (S1). The bulk proton spin-lattice relaxation time in this substance is very long (≈104s), thus making it a good
• S1 commercial grade, unprocessed
• S2 crushed and sieved, with 180µmand 80µmmesh size
• S3 crushed and sieved, with 80µmand 75µmmesh size
• S4 crushed and sieved, with 75µmand 53µmmesh size
• S5 16 hours grinding, (20±2)µm(SEM)
• S6 72 hours grinding.
All samples were dried in an oven at 40◦
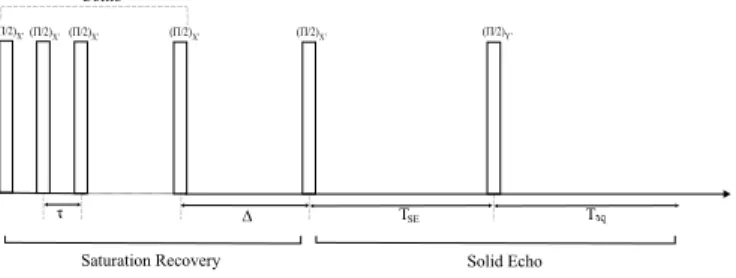
Cduring one hour and stored at room temperature with silica-gel until measure-ments were carried out. The micrograph of sample S5 was obtaind using a JEOL JEN 840-A scanning electron micro-scope, which allowed the accurate measurement of grain size in this sample and it was used as a comparison standard. The spin-lattice relaxation of protons of these samples were mon-itored at room temperature in a 0.77 T magnetic field (Lar-mor frequency 33 MHz). The saturation-recovery pulse se-quence with detection of the solid echo amplitude was elected as the most appropriate technique, mainly due to the very long characteristic time constants of maleic acid. The NMR spec-trometer employed in this experiments was mounted using an American Microwave Technology M3446 Pulse amplifier, a MITEQ preamplifier and an APOLLO NMR (TECMAG) console. A diagram of the pulse sequence is shown in Fig. 1. In these measurementsτ=100ms,TSE=35ms,Taq=300ns, and∆was varied from 10−2to 104seconds in a quasi
geomet-ric sequence.
(P/2)X’(P/2)X’
(P/2)X’ (P/2)X’ (P/2)X’ (P/2)Y’
Comb
Saturation Recovery Solid Echo
D TSE T
FIG. 1: Pulse sequence for the spin-lattice relaxation monitoring.
The relaxation function S(t), Eq. (3), as defined for the three basic grain shapes suggested by B&T (plane, cylindrical and spherical), was fitted to experimental data using Micro-cal Origin 6.1T Msoftware. The summation was extended to 8 terms and inclusion of additional terms did not lead to any sig-nificant change or improvement in the accuracy of fitting pa-rameters.Awas taken as an adjustable parameter,i.e., leaving to the nonlinear regression method the task of specifying the relaxation regime. This procedure differs with respect to that followed by R&E: they performed nonlinear fittings of theo-retical expression representing the relaxation of a system of uniform grains decaying in the regime of very slow diffusion A→∞, when the roots of Eq. (5) assume the limitξn=nπ
and the intensities in Table I take the formIn≈6/(πn)2.
Al-though this may be justified on the ground of the very slow spin diffusion usually found in nonconducting solids, and that one fitting parameter is removed in the computing task, it has the disadvantage of making the relaxation function, Eq. (3), to assume infinite initial slope, thereby eliminating any infor-mation supplied by Eq. (6) and Eq. (8). Despite the attention given to the recording of decay signal amplitudes for short∆ values, with the purpose of determining the initial relaxation time constant (T0S), the poor signal to noise ratio in the begin-ning of the decay leads to results both unreliable and strongly dependent upon the extension of the chosen time interval. It was eventually decided for the numerical differentiation of the fittedrelaxation functions at short times.
IV. RESULTS
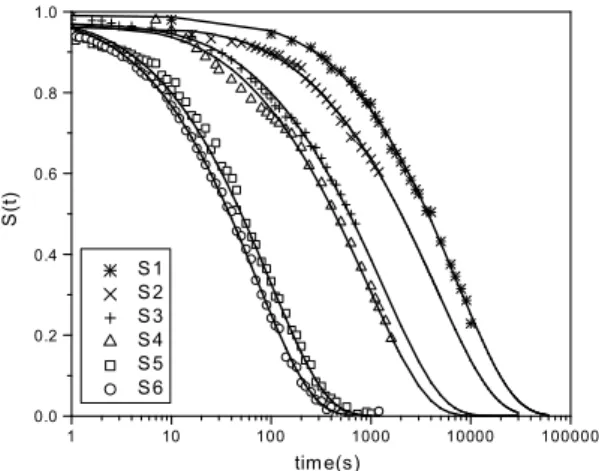
All samples showed clear multiexponential decay behavior, as can be seen in Fig. 3, defining the slow diffusion relaxation regime. The attempts to determine the bulk relaxation time as a fitting parameter were unsuccessful. The method only yielded very large values with uncertainties greater than 100 percent, even when the parameterAwas fixed as a very high number, thus approximating R&E’s fitting function [3]. This has been interpreted as indicative of a very slow bulk relax-ation rate, justifying the approximrelax-ationT1b≫(Θ/(ξ1)2)and
the substitution of unity for the exponential factor in Eq. (3). The notationT0≡T0Sthus will be adopted hereafter.
FIG. 2: Fittings of data points of samplesS5to plane, cylindrical and spherical grains. The fitted curves are almost indistinguishable.
of Eq. (3). This means that it is not possible to identify the grain shape through the “better fitting selection”: regression does not provide easily interpretable geometric information, which must be known in advance in order to assign a depend-able meaning toΘ(andd).
FIG. 3: Fittings of data points for all samples with assumed cubic grains.
TABLE II: Values ofΘ, in 103s, obtained after fitting of Eq. (3) for
the three elementary grain geometries to experimental data.
Geometry S1 S2 S3 S4 S5 S6
Spherical 71 55 16 12 1.2 0.84 Cylindrical 38 28 8.6 6.5 0.66 0.46
Plane 15 9 3 2.5 0.26 0.18
Aside the three basic geometric forms considered by B&T, Eq. (1) with the 1/T1bomitted can also be solved for cubic grains of sidedwith six active relaxation sink surfaces, trans-forming into a simple form,
S(t) = " ∞
∑
n=1In(ξn)exp£−ξ2nt/Θ ¤
#3
. (10)
whereξnare roots of the same eigenvalue equation as that characteristic of plane geometry. The summation raised to the third power is a result of the method of separation of variables applied to the differential equation and the orthogonality of eigenfunctions. The fittedΘvalues were essentially the same as those obtained for assumed spherical symmetry, although with lower associated uncertainties. This coincidence of char-acteristic times is not surprising if we consider that spheres and cubes have the same surface area to volume ratio. The regression parameters of the relaxation function in the form of Eq. (10) were then chosen for the analyses to follow. The
assumption of uniform grain sizes was maintained for all sam-ples: a detailed calculation taking into account a wide prob-ability distribution of sizes would be useless when applied to the typical decay curves, which do not present features that allow such level of resolution. Fig. 3 shows the normalized experimental detected signal amplitudes and the fitted relax-ation curves, Eq. (10). The values of characteristic and initial time constants are both listed in Table III.
TABLE III: Logarithmic time derivative at t=0 (initial slope) and characteristic times determined as fitting parameters of experimen-tal decay data to Eq. (10)(cubic grains)
T0(s) Θ(103s) A AT0/Θ
S1 2334±25 70±2 15.8±1.2 0.53
S2 1132±2 50.2±1.5 50±5 1.10
S3 344±1 14.6±0.5 39±4 0.92
S4 246±7 10.3±0.6 37±8 0.89
S5 32.2±0.5 0.94±0.04 13.6±1.4 0.46
S6 25.1±0.5 0.657±0.012 12.5±0.5 0.48
Since the samples were all obtained after different mechan-ical processing – crushing, sieving, milling – of the same raw material they are expected to exhibit the same bulk spin dif-fusion coefficientD. Eq. (7) indicates thatDcan be eval-uated if the diameterd, actually the cube side length in this case, is independently measured. Samples S3, S4 and S5 sat-isfy this requirement. The calculated diffusion coefficients are, in µm2/s: D3=0,103±0,006, D4=0,099±0,025
andD5=0,106±0,016, its error weighted average being
D=0,103±0,010µm2/s. The close agreement among cal-culatedDvalues as well as the compatibility between defined and measured (fitted)Θsupports the assumption of the bulk relaxation time far exceeding the time constants determined by surface relaxation mechanism. The use of this average spin diffusion coefficient makes possible the evaluation of average grains sizes for the remainder samples, and with the help of Eq. (8), ρ=d/(6T0), the analysis can proceed toward the
calculation of surface relaxivities.
TABLE IV: Experimental (S3, S4 and S5) and extrapolated values (S1, S2 and S6) of grain sizes, plus calculated relaxivities.
Sample d(µm) ρ(µm/s)
S1 170 0.0122
S2 140 0.0205
S3 78 0.0376
S4 64 0.0434
S5 20 0.104
S6 16 0.106
rough average values estimations instead of accurate deter-minations. However, it is possible to infer that grinding the commercial grade compound for 16 hours decreases the par-ticle linear dimensions by almost an order of magnitude into a narrow size distribution, whereas grinding it for 48 hours more results in the additional decrease of only 20 percent. Observing the third column we detect an apparent raise in re-laxivities with increasing surface area to volume ratio in sam-plesS1throughS4, suggesting that manual crushing does not equally affect the surfaces of grains with different volumes. On the other hand, it can be seen that grinding maleic acid in a ball mill during 16 hours changes drastically its surface crys-talline structure, both creating lattice defects which lead to the shortening of the local relaxation time, and certainly produc-ing thicker boundary layer of stronger relaxation. Additional milling process, which causes little effect on the particle sizes, does not change its relaxivity. As a consequence, samples that have already been milled to this limit condition of unaltered surface sink strength must present initial decay time constants in the ratio
To j Tok
∼
=dj
dk (11)
according to Eq. (8). SamplesS5andS6are expected to fulfill that condition and to satisfy the relationship above. Ac-cording to Table III the ratio(T05/T06)is 1.30±0.05 and from
Table IV(d5/d6)is 1.25±0.15, a good agreement if the error
spread is taken into account. If the thickness of the surface layer is assumed to be of the order of 10 ˚A and this value is combined with the relaxivities of samplesS5andS6, it is pos-sible to obtain the typical spin-lattice relaxation time in that layer as 10ms, lower by a factor 105with respect to the
char-acteristic times measured in those samples.
The values of the parameter Aextracted from decay data points, although confirming the slow diffusion regime, do not show any of the regularities observed for the time parame-ters. Its determination is quite imprecise, as can be seen in the third and 4-th columns in Table III, particularly in this last one, where all numbers should be close to 1/3. Large changes of A in this range do not affect in appreciable amounts the rootsξn, and so this quantity was not considered for numeri-cal evaluation purposes.
V. CONCLUSIONS
Under the adopted theoretical basis the analyses of mag-netic relaxation decay functions of fine powdered materials do
not provide absolute measurement of grain sizes, even if the simplifying assumption of uniform granularity is followed: the independent knowledge of the spin diffusion coefficient or the comparison with the function of a well characterized standard sample is required. Nor can the prevailing grain geo-metric form be identified on the ground of specific features of the observed decay curves, for they cannot be decomposed in spectra of definite relaxation rates. However, the access to the relaxation function of a single sample with a well known grain size allows, as has been presently done, the evaluation of the diffusion coefficient for this material. On the other hand, if the diffusion coefficient of a material is known and the aver-age size of a sample of this material is known the relaxation decay curve can be used to determine the surface relaxivity as well as the relative size of other samples of the same mater-ial. These possibilities arise as application of a simple phys-ical model which leads to algebraic expressions involving a few parameters representing quantities of interest in describ-ing microscopic properties of granular solids. This must be compared to the other common tools employed in the analy-sis of multiexponential relaxation: the numerical inversion of the Laplace transform [12–15], and the stretched exponential fitting [7, 16, 17]. The first one requires a lot of experimental data for every relaxation decay, does not lead to a unique solu-tion for relaxasolu-tion times distribusolu-tion, and it usually works on the oversimplified basis of a definite particle or pore size for every decay time component. This is not true, as can be ob-served in the form of the relaxation function, solution of the magnetization diffusion differential equation. The stretched exponential and its modified form [18] , on the other hand, in-volve no more than three parameters and good quality fittings can be achieved with less experimental data, if conveniently distributed. However, they are not associated to an established physical model which permits the development of analyses of the kind carried out in this article.
Acknowledgements
We thank Dr. Pedro Kiyohara, head of the Laboratory of Electron Microscopy, IFUSP, for the scanning electron micro-graph used in this article.We are also indebted to Dr. Dolores Ribeiro Ricci Lazar, (Laboratory of Ceramic Materials -IPEN), for ceding the ball mill where samplesS5 andS6 were ground. S. R. and J. B. M. received support of FAPESP and CNPq.
[1] K. R. Brownstein and C. E. Tarr, Phys. Review A,19, 2446 (1979)
[2] M. Fleury, Revue de l’Institut Franc¸ais du Petrole,53, 4 (1998) [3] S. R. Rabbani, and D. T. Edmonds, Phys. Review B,50, 6184
(1994)
[4] M. Prutton,Surface Phys, 2nd ed. (Clarendon, Oxford, 1984) [5] N. Bloembergen, Physica (Utrecht),15, 386 (1949)
[6] S. R. Rabbani, H. Panepucci, and J. S. Helman, Phys. Review B,27, 1493 (1983)
(1990)
[8] R. L. Kleinberg, W. E. Kenyon, and P. P. Mitra, J. Magn. Reson. A 108, 206 (1994)
[9] W. E. Kenyon and J. A. Kolleeny, J. Coll. Interface Sci.170, 502 (1995)
[10] S. Davies, and K. J. Packer, J. Appl. Phys.67, 3163 (1990) [11] S. Davies, M. Z. Kalam, K. J. Packer, and F. O. Zelaya, J. Appl.
Phys.6, 3171 (1990)
[12] S. W. Provencher, Comput. Phys. Commun.27, 213 (1982) [13] S. W. Provencher, Comput. Phys. Commun.27, 229 (1982) [14] D. P. Gallegos, and D. M. Smith, J. Colloid Interface Sci.122,
143 (1988)
[15] K. P. Whithall and A. L. MacKay, J. Magn. Reson.84, 134 (1989)
[16] W. E. Kenyon, P. I. Day, C. Straley, and J. F. Willemsen, Soc. Pet. Eng. Form. Eval.3, 622 (1988);4, 8 (1989)
[17] G. C. Borgia, R. J. S. Brown, P. Fantazzini, E. Mesini, and G. Valdr`e , Nuovo Cimento D14, 745 (1992)