Indirect Determination of Ethanol in Drinks Using a Capacitance
Flow-through Detector
Shan-jun Liu, and Matthieu Tubino*
Instituto de Química, Universidade Estadual de Campinas, C.P. 6154,
13083-970 Campinas - SP, Brazil
Foi desenvolvido um método de análise para a determinação de vapor de água, baseado num sensor capacitimétrico. Este detetor consiste de dois tubos concêntricos de aço inoxidável e fica localizado no tubo de amostragem da válvula introdutora de amostra do sistema de fluxo. O logaritmo da capacitância dos vapores de amostra (sinal analítico) apresenta uma boa correlação linear com a concentração de vapor de água numa faixa de 1705 até 2197 Pa. Cerca de 55 amostras podem ser analisadas por hora. Este sistema de fluxo foi aplicado à determinação indireta da concentração de etanol em bebidas alcoólicas, em função da concentração do vapor de água presente no frasco contendo o líquido em análise. Não é necessário nenhum pré-tratamento da amostra. Corantes presentes na bebida não interferem nos resultados.
A flow procedure based on a metallic capacitance flow-through detector is described for the analysis of water vapour. The capacitance detector consists of two stainless steel tubes and is located in the loop of a sampling valve. The logarithm of the capacitance signal correlates linearly with the concentrations of water vapour in the 1705 to 2197 Pa range. A sampling frequency of about 55 h-1 can be achieved. The flow system was applied to the indirect determination of the ethanol concentration in drinks based on the analysis of water vapour content above the liquid sample, without any pre-treatment of the sample. The colour of the drinks has no effect on the measurements.
Keywords: capacitance, water vapour, ethanol, drinks, flow analysis
Introduction
The capacity is defined as the charge that the capacitor can store per unit of potential difference between the plates. The capacity of a condenser is increased by interposing a dielectric material between the plates. In tensammetry the capacitance of the electrical double layer of an electrode is measured. The capacitance value is strongly influenced by the presence of absorbing species1. Although tensammetry is possible at all kinds of electrode surfaces, mercury is the most widely used electrode material1. Detectors with mer-cury electrodes (dropping mermer-cury2,3, hanging or static modes4 and mercury-coated1 are mainly used for the deter-mination of substances in solutions. Other electrode mate-rials, based on the capacitance principle, have also been developed. A tantalum capacitance sensor is used for the detection of proteins by immunochemical binding reac-tions5. Berggren and Johansson immobilised monoclonal antibodies on gold substrates6. The antibody layers and their interactions with antigens in solution were investi-gated with capacitance measurements and with cyclic
vol-tammetry. The capacitance change versus the logarithm of antigen concentration is linear over three decades6. A gas-sensitive semiconductor based on a palladium MOS field-effect capacitor for the determination of ammonia in air and aqueous solutions has also been described7. The main prob-lem in preparing a stationary working electrode for tensam-metric measurements is the formation of a homogeneous and well-defined surface1.
Double layers are not a special feature of the electrode-electrolyte interfaces; they are a general consequence of the junction of two phases at a boundary 8. Owing to its high dielectric constant (78.5 at 25 °C) water is the primary species which can be measured by changes of the capaci-tance9. Many industrial processes, such as drying, baking, kilning, etc., involve the modification of a material water content. The measurement of humidity should rate equally in importance with the measurement of temperature in industry10. The aim of this work was to evaluate a proposed metallic capacitance detector for quantitative analysis of gases and to develop a fast procedure for measurement of water vapour in a flow system. The proposed method is Article
E-mail: [email protected]; fax: + 55 19 788.3023
Presented in part at the 20th Annual Meeting of the Brazilian Chemical Society, Poços de Caldas, Brazil, May 24-27 (1997).
further employed to measure indirectly the ethanol content in drinks. The use of the proposed metallic electrode cir-cumvents the problem of the formation of a homogeneous and well-defined surface. Also, no renewal of surface is necessary.
Experimental
Vapours and gases
The vapours were obtained from their respective pure liquids. All organic solvents were of analytical or spectral grade. Dried air was obtained by passing air through a column packed with silica gel and sodium hydroxide. Carb-on dioxide was obtained from a cylinder. Various cCarb-oncen- concen-trations of water vapour were prepared by saturating air with vapour from distilled water that was kept at various fixed temperatures and stirred continuously more than 30 min. The concentration of water vapour in air was obtained from the table of the vapour pressure of water at various temperatures11. Analytical grade ethanol (96% v/v) was used to prepare the different ethanol solutions with dis-tilled, deionised water (ethanol:water, 0 to 96% by volume or weight).
Apparatus
The capacitance flow-through detector and related bat-tery-powered electric circuit were laboratory-made. The construction of the capacitance detector has been pre-viously described12. The detector consists of two concen-tric stainless steel tubes, the external tube with an inside diameter of 1.8 mm and a length of 30 mm and the internal tube with an outside diameter of 1.2 mm. The space volume of the detector is about 40 µL. The capacitance signal was measured with a battery-powered MX-901 (Minipa) digital multimeter and recorded on a chart recorder (Model RB 201, Equipamentos Científicos do Brasil, Brazil). An air pump was used to convey dried air for rinsing the detector. The sampling valve was made of polytetrafluoroethylene (PTFE)13. The sample flask with liquid sample was im-mersed in a thermostatic water bath (MGW RCS 6, Lauda-Königshofen). A stop-watch was used to measure the sampling time.
Procedure
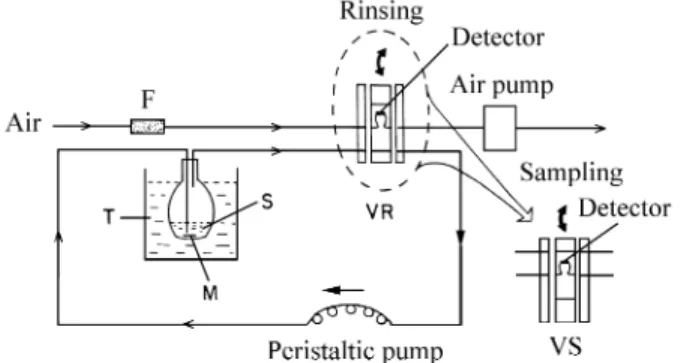
The flow system used to implement the proposed method is schematically shown in Fig. 1. The capacitance flow-through detector was located in the loop of sampling valve, and the sample introduction was carried out by keeping the sampling valve in the sampling position (VS) for 20 to 50 s. Dried, filtered air was used to rinse the detector by switching the sampling valve to rinsing position (VR). The liquid samples were first maintained at a fixed temperature for more than 3 h. Then about 20 mL sample was transported into a testing bottle (40 mL) kept at the
same temperature. The peristaltic pump began to circulate air at a flow rate of 21 mL min-1 within the sample enclo-sure, bubbled through the liquid sample (S), which was continuously stirred with a magnetic stirrer (M). The air was saturated with the vapour of the liquid sample for 30 min, then the measurements were started.
When the drink samples were analysed, the samples and the standard series were kept at room temperature more than one day and the vapour above the liquid sample was directly analysed one by one. Ethanol concentrations in drinks were obtained from the calibration curve.
Results and Discussion
The vapour pressure of water increases as the tempera-ture increases11. In the present work, various water vapour pressures were obtained by means of changing the tempera-ture of the water. The water vapour concentration (signal) increases with increasing equilibrium time of sample. After about 25 min, the signal becomes constant. This means that saturation of the air with water vapour was obtained in the analytical system. As the vapour equilibrium time influ-ences the concentrations of water vapour and thus the capacitance signal, subsequent measurements were per-formed with a vapour equilibrium time of 30 min with the liquid sample.
1. Response characteristics
responses. Therefore water vapour was chosen to study the response characteristics of the detector. A typical recorded curve for water vapour is shown in Fig. 2. The signal peak is asymmetric. The detector begin to respond to water vapour about 6 s after the sample vapour passes through the detector. When the sampling valve is switched to the rins-ing position only the filtered dried air carrier is passrins-ing through the detector and the signal rapidly returns to base-line. The experiments were carried out with a stop-watch, and it can be expected that the application of solenoid valve control sampling may improve the repeatability of the measurements.It is necessary to use a sampling time longer than 6 s in order to obtain an observed signal. The time of 10 s is enough for returning the signal to the baseline, allowing the introduction of the next sample.
The effect of sampling time up to 90 s was evaluated and results are shown in Fig. 3. After a delay of several seconds, the signal rapidly increases as the time of sample vapour passing through the detector increases. Since the analytical frequency depends on the sampling time, a com-promise between sample throughput and sensitivity was made, and a sampling time of 40-50 s and an interval time of 15 s were chosen. Thus, the analytical frequency is at least 55 samples h-1.
Another factor influencing the analytical signal is the flow rate of sample vapour. Below a flow rate of 20 mL min-1, the signal increases with increasing flow rate of Table 1. Capacitance signal and vapour pressure of tested substances in flow analysis*.
Tested substance Signal / nF Gas or vapour pressure at 25 °C / kPa14
Room air 0.002 ca 101.3**
Carbon dioxide 0.002 ca 101.3**
Water 1.473 3.2
Methanol 0.001 16.7
Ethanol 0 8.0
Benzene 0.265 1.624.5***
Toluene 0.819 0.835.4***
Chloroform 0.608 26.0
Acetone 0.017 24.220
Acetic Acid 0.001 2.0
* Liquid samples maintained at a temperature of 20.0 °C. Sampling and interval time = 50 and 15 s. Flow rates of sample and air carrier = 21 and 330 mL min-1. The detector operated at room temperature (about 22 °C).
** Carbon dioxide gas, obtained from a cylinder, and air directly introduced into the analytical system at a pressure of about 1 atm.
*** Tomás Boublík; Vojtech Fried; Eduard Hála; Physical sciences data 17: The vapour pressure of pure substances, Selected values of the temperature dependence of the vapour pressures of some pure substances in the normal and low pressure region, 2nd., Elsevier, 1984.
Figure 2. A recorded curve for the response of water vapour in the flow system. Water was maintained at 20.0 °C. Sampling 40 s and interval 20 s. S was the time point of sampling and R was that of rinsing.
water vapour; after 20 mL min-1 the signal remains con-stant. This fact may be understood in terms of the saturation of the electrode with the vapour. The sample flow rate was selected at 21 mL min-1.
2. Relationship of the capacitance signal and the concentration of water vapour
The relationship between the capacitance signal and the water vapour concentration was tested. The capacitance signal is not linear with respect to the concentration of water vapour. The logarithm of the net capacitance signal, measured as peak height, however, linearly correlates to the concentrations of water vapour in the range of 1705 to 2197 Pa. This correlation is used as the calibration curve. The features of the determinations of water vapour with differ-ent sampling time are summarised in Table 2.
3. Selectivity
When the capacitance flow-through detector was used for the measurement of gases or vapours in the flow system, it shows some selectivity as it responds to only some organic vapours. The proposed method is suitable for well-defined samples, for example, indirect determination of ethanol in drinks as the water vapour pressure depends on the ethanol concentration of the solution.
4. Analytical application: Indirect determination of ethanol in drinks
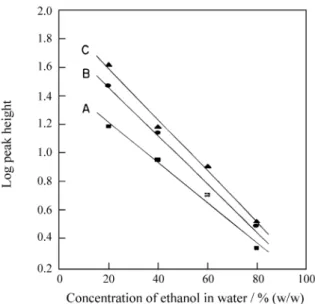
Since ethanol has hardly response in the capacitance detector under the experimental conditions (see Table 1), the relationship between capacitance signal and ethanol content in water was studied and is shown in Fig. 4.The recorded signal is dependent on the concentration of etha-nol in the sample. The logarithm of the analytical signal is inversely proportional to the ethanol content of the solu-tion. The features of the determination of ethanol with different sampling times are also given in Table 2. The logarithm of the capacitance signal measured as peak
height linearly correlates to the concentrations of ethanol in water over a limited working range.
The proposed method was applied to determine indi-rectly the ethanol content in drinks. The vapours of drink samples are analysed directly without any pre-treatment. The results obtained in this work are compared with those using the density method by another laboratory and given in Table 3. The colours of the drinks have no effect on the measurements.
Conclusions
The metallic electrode proposed in this work can be used as a capacitance detector for the measurement of water vapour and, as a consequence, of substances that can change the vapour pressure of the water. It does not present the problem of surface renewal and was easy to operate. It provides a stable baseline and can be made as a portable instrument. The proposed method was employed to
indi-Table 2. Relationship between logarithm of capacitance signal and concentrations of water vapour and of ethanol.
Sampling time / s Equation* Correlation coefficient Detection limit / Pa
20 LogH = -3.9843 + 0.0024 x Cw 0.9865 1733
30 LogH = -4.1166 + 0.0026 x Cw 0.9913 1651
40 LogH = -4.0052 + 0.0026 x Cw 0.9932 1608
50 LogH = -4.3210 + 0.0029 x Cw 0.9931 1551
20 LogH = 1.7978 - 0.0167 x Ce 0.9927
40 LogH = 1.4948 - 0.0139 x Ce 0.9924
60 LogH = 1.9495 - 0.0177 x Ce 0.9969
* H = the capacitance signal measured as peak height. Cw = the concentration of water vapour in the range from 1705 to 2197 Pa. Ce = the concentration
of ethanol in water in the range from 20 % to 80 % (w/w) ethanol.
rectly determine ethanol in drinks. The capacitance detec-tor can be used for ‘‘in line’’ measurement of ethanol content of drinks in beverage industries.
Acknowledgements
The authors are grateful to Conselho Nacional de De-senvolvimento Científico e Tecnológico (CNPq) and Fun-dação de Amparo à Pesquisa do Estado de São Paulo (FAPESP) for financial support. SJ Liu acknowledges FAPESP for a post-doctoral fellowship (Process No. 95/04227-0). Prof. Douglas Wagner Franco and Dr. Ronaldo Ferreira do Nascimento, Institute of Chemistry of São Carlos, University of São Paulo, are thanked for refer-ence analysis of the drink samples. Prof. Carol H. Collins is thanked for the English improvement.
References
1. Bos, M.; van Willigen, J.H.H.G.; van der Linden, W.E. Anal. Chim. Acta 1984, 156, 71.
2. Bos, M. Anal. Chim. Acta 1982, 135, 249.
3. Rosen, M.J.; Hua, X.; Bratin, P.; Cohen, A.W. Anal. Chem. 1981, 53, 232.
4. Emons, H.; Schmidt, T.; Stulík, K. Analyst 1989, 114, 1593.
5. Gebbert, A.; Alvarez-Icaza, M.; Stcklein, W.; Schmid, R.D. Anal. Chem. 1992, 64, 997.
6. Berggren, C.; Johansson, G. Anal. Chem. 1997, 69, 3651.
7. Winquist, F.; Spetz, A.; Lundstrm, I.; Danielsson, B. Anal. Chim. Acta 1984, 164, 127.
8. Bockris, J.O.’M.; Reddy, A.K.N.; Modern electro-chemistry, v. 2, A Plenum/Rosetta Edition, 1973, p 630-632.
9. Janata, J. Principles of Chemical Sensors, Plenum Press, New York, 1989, p 231.
10. Lee, G.A. Anal. Proc. 1984, 21, 205.
11. Weast, R.C., Ed.; CRC Handbook of Chemistry and Physics, 67th Ed., CRC Press, Boca Raton, Florida, 1986, p D-190 and E-54.
12. Tubino, M. J. Flow Injection Anal. 1994, 11, 94. 13. Tubino, M.; Barros, F.G. Quím. Nova 1991, 14, 49. 14. Sawyer, D.T.; Roberts, J.L. Jr. Experimental
Electro-chemistry for Chemists, Wiley, 1974, p 204-207.
Received: May 6, 1998
FAPESP helped in meeting the publication costs of this article
Table 3. Indirect measurements of ethanol present in drinks with the capacitance flow-through detector.
Sample number Colour Ethanol in present work / % (by wt) Reference value*/ % (by wt)
1 colourless 30.2 ± 1.8 32
2 yellowish-brown 33.5 ± 1.7 35
3 colourless 34.9 ± 1.5 36
4 colourless 41.0 ± 1.3 40
5 yellowish-brown 31.6 ± 1.9 34
6 light brown 36.2 ± 1.4 37
7 light yellow 36.6 ± 1.4 37
8 colourless 32.8 ± 1.6 35
9 colourless 37.4 ± 1.8 36
10 yellowish-brown 44.3 ± 1.5 42
11 colourless 33.8 ± 1.4 34
12 colourless 31.4 ± 1.4 31
13 colourless 35.0 ± 2.1 35
14 yellowish-brown 35.0 ± 1.3 35
15 violet 38.4 ± 1.4 38
16 brown 34.2 ± 2.2 35
17 light brown 35.8 ± 1.8 36
18 light yellow 38.6 ± 1.6 40
19 yellowish-brown 34.0 ± 1.6 35