Model for Multiple Imputation to Estimate Daily Rainfall Data
and Filling of Faults
José Ruy Porto de Carvalho
1*, José Eduardo Boffinho Almeida Monteiro
1,
Alan Massaru Nakai
1, Eduardo Delgado Assad
11
Embrapa Informática Agropecuária, Campinas, SP, Brazil.
Recebido em 9 de Fevereiro de 2017 – Aceito em 19 de Agosto de 2017
Abstract
Modeling by multiple enchained imputation is an area of growing importance. However, its models and methods are fre-quently developed for specific applications. In this study the model for multiple imputation was used to estimate daily rainfall data. Daily precipitation records from several meteorological stations were used, obtained from system AGRITEMPO for two homogenous climatic zones. The precipitation values obtained for two dates (Jan. 20th2005 and
May 2nd2005) using the multiple imputation model were compared with geo-statistics techniques ordinary Kriging and
Co-kriging with the altitude as an auxiliary variable. The multiple imputation model was 16% better for the first zone and over 23% for the second one, compared to the rainfall estimation obtained by geo-statistical techniques. The model proved to be a versatile technique, presenting coherent results with the conditions of different zones and times.
Keywords:model by multiple imputation, chains, precipitation, ordinary kriging, ordinary Co-kriging, homogeneous
zones.
Modelo de Imputação Múltipla para Estimar Dados de Precipitação Diária
e Preenchimento de Falhas
Resumo
A modelagem por imputação múltipla com cadeias encadeadas é uma área de importância crescente cujos modelos e métodos têm sido muitas vezes desenvolvidos para lidar com aplicações específicas. No presente estudo, o modelo de imputação múltipla foi utilizado para estimar os dados de precipitação diária. Foram utilizados registros de precipitação de várias estações meteorológicas, obtidos a partir do sistema Agritempo para duas zonas climaticamente homogéneas. Os valores de precipitação obtidos para duas datas fixas (02 de Maio de 2005 e 20 de Janeiro de 2005) usando o modelo de imputação múltipla foram comparados com as técnicas geoestatisticas de krigagem ordinária e cokrigagem ordinária com a altitude como variável auxiliar. O modelo de imputação múltipla foi mais de 16% melhor para a primeira Zona e mais de 23% melhor para a segunda zona, comparadas com as estimativas de precipitação obtidas pelas técnicas geoestatísticas. O modelo provou ser uma técnica versátil, com resultados coerentes com as condições de diferentes zonas e épocas.
Palavras-chave: modelo por imputação múltipla com cadeias encadeadas, precipitação, krigagem ordinária, cokrigagem ordinária, zonas homogêneas.
1. Introduction
The changes observed in climatologic records are used to examine climate variability and to investigate the notion of climate change. For modellers who work on nu-merical weather forecast, complete historical series of me-teorological data are important for the initialization of the model and also for verification.
Problems with missing data in climatic series often arise and are caused by many circumstances, mainly due to the sources of acquisition, which are usually obtained from reports, manual collection instruments or remote sensors. However, for most users, meteorological data plays a criti-cal role in decision making. It is imperative that they are complete and reliable. The data must consist of series of ro-bust and continuous data (Lima, 2003; Oliveira, 2010).
Article
Data with long time series are of fundamental impor-tance for monitoring in maritime transport, civil and mili-tary aviation, agriculture, health, energy, prevention of nat-ural disasters among others. Failures in historical series certainly lead to an increase in uncertainty for both weather forecasts and the definition of future climate scenarios (Nascimento, 2010).
In Brazil there are several meteorological databases, of different institutions. There are still problems of continu-ity, completeness, filling of faults, among others. In the monthly time step, data problems are less than those with daily resolution. Considering daily data reduces the density of stations with reliable data and long time series, making smaller the information to be used in the definition of future climate scenarios.
The impact of missing data on statistical inference is potentially important, especially in cases where weather stations with missing data, differ consistently from those with complete data. For a coherent and valid estimate, ade-quate modeling of missing values is necessary. The simple disposal of missing data can lead to partial and biased re-sults (Harel, 2007).
To overcome this problem, statistical techniques have emerged since the 1980s, involving the substitution of missing data for estimates of plausible values to be “im-puted” in series with missing data. In the statistical litera-ture, this technique is known as “Imputation of missing data” and its use has been generalized and extended to other
areas (Rubin, 1996; Schafer, 2002; Fraser, 2007; Nuneset
al., 2010). However, the uncertainty associated with the
imputation must be taken into account so that the results ob-tained with the complete data are valid since the imputed values are not the real ones.
In the literature there are a number of procedures to address the lack of data. The expectation-maximization
(EM) algorithm (Dempsteret al., 1977) is a general
itera-tive algorithm that can be used to find Maximum Likeli-hood Estimates (MLEs) for missing data problems. The multiple imputation (MI) algorithm (Rubin, 1987) con-structs several complete datasets, by filling each missing data with plausible values. There are also semi-parametric approaches such as Weighted Estimation Equations (WEE) that do not depend on the assumptions of missing values
distributions (Robinset al., 1994; Lipsitzet al., 1999).
In the Bayesian paradigm, the missing values are con-sidered unknown parameters and are thus estimated. The introduction of additional parameters increases the com-plexity of the problem because the value of these missing parameters is simply an additional layer of variables that can be sampled sequentially through Markov chain-based Monte Carlo (MCMC) simulation. The Bayesian approach takes into account the uncertainty created by the multiple predictions for each missing value and allows estimation of the posterior marginal distribution of interest parameters using the observed data.
Multiple imputation by chained equations (MICE) implies that the user specifies a conditional distribution for the lack of data in each incomplete variable based on the other data. For example, in the form of a linear or logistic regression from the incomplete variable given a set of pre-dictors. Predictors may be incomplete. It is assumed that there is a multivariate distribution from which these condi-tional distributions can be derived, and that the interactive Gibbs sampling from the conditionals can generate multi-ple imputations.
The application of multiple imputation by chained equations increased, noticeable in recent years, especially in the medical area, as mentioned by Buuren and Groo-thuis-Oudshoorn, (2011): for arthritis and rheumatology
(van den Houtet al., 2009), at the cardio-vascular system
(Byrneet al., 2009; Kleinet al., 2009), cancer (Geresteinet
al., 2009), epidemiology (Tonet al., 2009) and for
infec-tious diseases (Michelet al., 2009), works in other sciences
have also used this technique, for example in politics
(Ta-nasoiu and Colonescu, 2008), psychology (Sundellet al.,
2008), sociology (Finke and Adamczyk, 2008) and
clima-tology (Wesonga, 2015; Turradoet al., 2014).
The objective of this study was to estimate the daily missing values of precipitation using the chain-based mod-el (MICE). The results obtained were compared with the Kriging and Co-Kriging techniques, commonly used in es-timating missing values, for climatological stations located in two homogeneous areas of Brazil.
2. Material and Methods
Multiple imputation (Rubin, 1987; Rubin, 1996) is the method usually chosen for incomplete complex data problems. Recently, two general approaches to impute multivariate data have emerged: joint modeling (JM) and conditional complete specification (FCS), also known as multiple imputation by chained equations (MICE) or multi-ple sequential regression imputation (Buuren and Groo-thuis-Oudshoorn, 2011). When creating several imputa-tions, as opposed to individual imputaimputa-tions, the statistical uncertainty in the imputations decreases. Furthermore, the chained equation approach is very flexible and can handle variables of different types (continuous or binary ones). MICE algorithm is implemented as an S-PLUS function. For each incomplete variable the user can choose a set of predictors that will be used for the imputation. This is use-ful for allocating large sets of data containing hundreds of variables. Multiple imputation results in valid statistical in-ference in the presence of missing data.
Turradoet al. (2014) studied solar radiation values
Wesonga (2015) applied the multiple imputations by chained equations method in a time series of wind speed data at Entebbe international airport. The results obtained by applying the MICE method, provided reliable wind speed missing data imputations.
Schafer (1997) developed several imputation tech-niques for joint modeling (JM) of models with normal multivariate and log-linear distribution. For the use of JM it is necessary to specify the multivariate distribution of the missing values and to carry out the imputation for its condi-tional distribution by the Markov chain and Monte Carlo (MCMC) technique. This methodology presents a good be-havior if the multivariate distribution describes the data reasonably well, however the estimates are often skewed (Granberg-Rademacker, 2007).
The chain can be divided into three general steps. In step one, each variable, for each station, would be imputed the mean observed value for that variable. At step two, the estimated observed values of the variable in step one are re-lated to the other variables of the data set through regres-sion. That is, the variable of step one is the dependent variable in the regression model, while the other variables are independent with the same assumptions of a common regression equation. In step three, the values missing in step one are replaced by the estimate obtained with the regres-sion equation. Then the procedures in steps one through three are repeated for each variable that has missing value. This procedure for each of the variables constitutes an itera-tion or “cycle”. At the end of a cycle, all missing values were replaced with the estimates obtained by the regression equations reflecting the observed ratios in the data. Steps 2 through 3 are repeated for different cycles with the imputa-tions being updated in each cycle.
According to Buuren and Grothuis-Oudshoorn, 2011,
letYbe a complete data set of a partially observed random
sample, a multivariate distribution with p-variables P(Y\q).
The multivariate distribution ofYis completely specified
by the unknown parameter vectorq. The problem is to
ob-tain the multivariate distribution ofq. The chained process
results in the posterior distribution of q, by interactively
sampling the conditional distribution of P(Y1\Y-1,q1), ... ,
P(Yp\Y-p,qp). The parametersq1, ...,qp are specific to the
conditional densities and do not necessarily produce the factorization of the real joint distribution P(Y\q).
Assuming that the missing data is random, that is, when the missing values pattern in a variable is predictable from the other variables of the data set a simple sample of
the observed marginal distribution is taken out and the tth
it-eration of the chained equations is a sample of Gibbs which successively withdraws
q1 q1 1 2 1 1
1 1 1
*( ) ( ) ( )
*( )
~ ( \ , , ,
~ ( \
t obs t
p t
t o
P Y Y Y
Y P Y Y
- K
-bs t p t t p t p p obs t Y Y
P Y Y
, , , , ~ ( \ , ( ) ( ) *( ) *( ) ( 2 1 1 1 1
- K
-M
q
q q ) ( )
*( ) ( ) ( ) *( , , ~ ( \ , , , , K K Y
Y P Y Y Y Y
p t p t p p obs t p t p t -1 1
1 q )
whereYj Y Y
t j obs j t ( ) *( ) ( , )
= is thejthvariable imputed in
itera-tiont. One observes that for the imputation ofYj
t
*( ), only
Yj(t-1) is considered, due to the relationship with other
vari-ables. q
p
* is the estimative of the parameter for the
tth
iteration of the chained equations. This results in a very fast convergence, unlike MCMC methods.
Many imputation techniques, assume a joint model for all variables, such as a normal joint distribution. In large data sets, with hundreds of variables from different types, this rarely happens. MICE specifies the multiple imputa-tion model based on each variable for a set of condiimputa-tional densities. Starting with an initial imputation, MICE per-forms imputations interacting with the conditional densi-ties.
For each incomplete variable, an imputation method can be specified. This will be the method which the Gibbs sampling uses for variable imputation. In this context, sev-eral imputation methods can be employed. Regarding nu-merical data, for example, imputation is performed through Bayesian linear regression with normal errors, improper linear regression with normal errors, predictive mean and unconditional average imputation. Imputation by logistic regression is used for binary data, and logistic regression for categorical data with more than two categories. For this study the predictive mean (PMM) was used. PMM imputes missing values by means of the nearest-neighbor donor with distance based on the expected values of the missing variables conditional on the observed covariates (Little, 1988).
Precipitation data from several meteorological sta-tions were used in two homogeneous areas in Brazil,
identi-fied according to Keller Filhoet al.(2005), obtained from
the AGRITEMPO system (Embrapa Informática Agrope-cuária, 2014). AGRITEMPO is an agro-meteorological monitoring system that allows users to access information on weather and agro-meteorological information from vari-ous Brazilian municipalities and States via Internet. The rainfall homogeneous zones are identified according to the similarity of the probability distribution of precipitation and delimited using the hierarchical cluster analysis obtain-ing 25 homogeneous precipitation zones. Among the 25
ho-mogeneous zones obtained by Brazil Keller Filho et al.
in-cluded 90 stations located in NE Brazil, within a rectangu-lar area defined with by latitudes 10.5 to 8.0 and longitudes 42.5 to 38.0 (Fig. 1). The orography and spatial distribution of rainfall are similar within Zones 1 and 2. Figure 1 shows the location of the meteorological stations used in the work. The first homogeneous zone is characterized by a tropical climate with rainy summer and dry season in winter (Köppen, Aw). The second one is characterized by a semi-arid climate, low humidity and low annual precipitation (Köppen, BSh).
For the validation of values obtained using the multi-ple imputation method, two dates were chosen: Jan. 20th 2005 and May 2nd 2005. For these specific dates, the geo-statistics techniques Kriging and Ordinary Co-Kriging (Yamamoto and Landim, 2013) were used, considering al-titude as a co-variable, to estimate the missing values by cross-validation, assuming that one of the sample elements was not observed.
The first date corresponds to the rainy season in the first homogenous zone, while in the second zone corre-sponds to the dry season. The second date represents the dry season in the first homogeneous zone from the area under study and the rainy season for the second homogeneous zone.
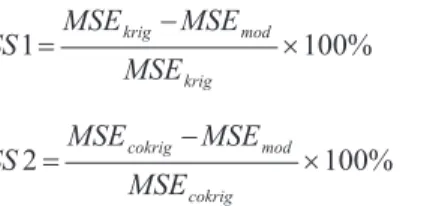
It is quite common in verification studies, to use the Skill Score (SS) statistics to summarize the quality of the forecast system. This statistics quantifies the relative varia-tion of the mean square error from the method of multiple imputation (MSEmod) regarding Kriging and Co-Kriging (MSEkrig and MSEcockri). The positive values of SS
indi-cate that the model improved the forecasts (Carvalhoet al.,
2016; Carvalhoet al., 2011; Libonatiet al., 2008).
SS MSE MSE
MSE
krig
krig
1= - mod´100% (1)
SS MSE MSE
MSE
cokrig
cokrig
2= - mod ´100% (2)
The multiple imputation (MI) provides an useful strategy for handling a dataset with missing values. Instead of estimating a single value for each missing value, the mul-tiple imputation procedure replaces each missing value with a set of plausible values representing the uncertainty over the correct value to impute (Rubin, 1987). As ex-plained by Greenland and Finkle, 1995, the multiple impu-tation process creates multiple predictions for each missing value, the multiple imputation data analysis considers the imputation uncertainty and produces precise standard er-rors. One of the great advantages of multiple imputations is that in addition to using researcher’s knowledge to estimate missing values, the technique allows researchers to express the uncertainty of imputed values. The uncertainty is of two types: sample variability assuming that the reasons for the lack of data are known and the variability due to uncertainty about the reasons for having the data missing. These data-sets with estimated data are analyzed using standard proce-dures for complete data, and the results are compared with the ones obtained with our technique. No matter for what the analysis of the complete data is used the process of com-bining the results of different estimated datasets is essen-tially the same.
The multiple imputation model for each dataset, date and zone was adjusted using programs developed in R lan-guage (R Development Core Team, 2011), with support of MICE (Multivariate Imputation by Chained Equations)
brary (Buuren, 2015). To improve the estimates of missing data, the altitude of each meteorological station was used as a co-variable.
3. Results and Discussion
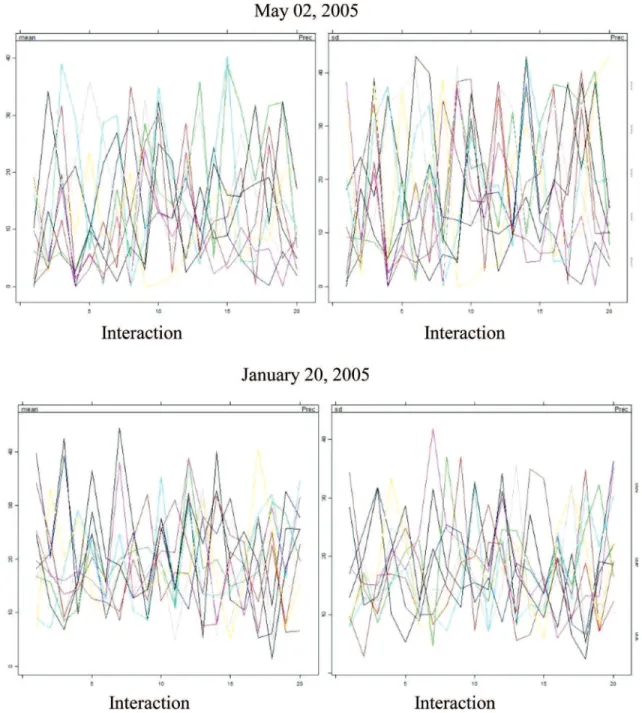
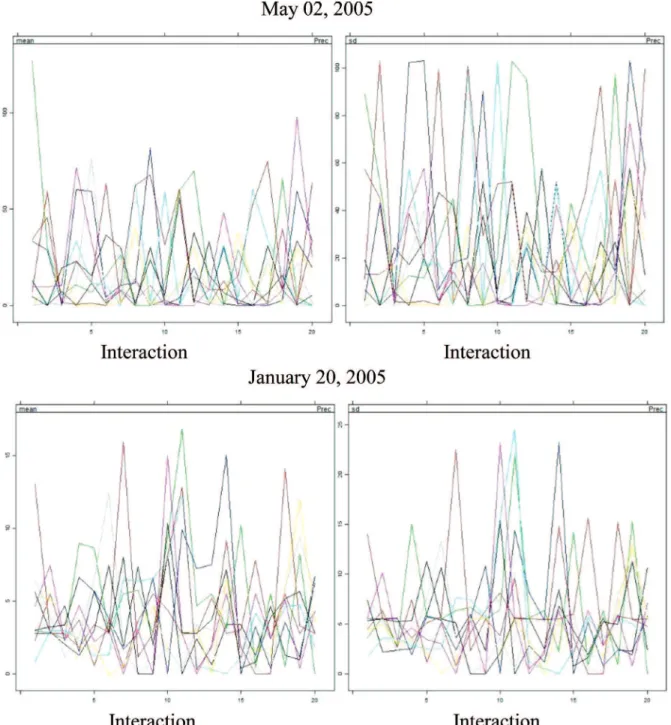
The Gibbs sample is not a conventional algorithm in the sense that a particular value of the criterion is opti-mized. MICE runs m parallel chains, each with a different number of iterations with a certain color, and imputes val-ues from the final iteration. The imputations obtained by MICE were plotted along with the precipitation. Conver-gence occurs when the lines are interleaved (Figs. 2 and 3).
Convergence is verified when the variance among different sequences is not larger than the variance in each sequence.
To detect the differences between observed and im-puted data, for each chain, we plotted the density of ob-served data with the ones of imputed data. We expect them to be similar, though not identical (Figs. 4 and 5).
No difference stands out in all situations, allowing the conclusion that the Gibbs sample algorithm converges (Noghrehchi, 2015). For the first and second homogeneous zones, random samples from four meteorological stations were taken and the values estimated using the MICE model and the geo-statistical interpolation. Mean Square Error for the dates May 2nd 2005 and January 20th 2005, using the
Figure 3- Mean and standard deviation of variable precipitation for zone 2.
Table 1- Mean Square Error to estimate gaps obtained from the MICE model (MSEmod), Kriging (MSEkrig) and Co-Kriging (MSEcokrig) on May 2nd
and January 20th, 2005 – SS1 and SS2 are the Skill-Score statistics when comparing the model with Kriging and Co-Kriging, respectively.
Zone MSEmod MSEkrig SS1 (%) MSEcokrig SS2 (%)
May 02
First 7.65 15.10 49.33 22.45 65.92
Second 13.41 21.04 36.26 35.29 62.00
January 20th
First 20.99 26.67 21.29 25.27 16.93
MICE model, and the Kriging and Co-Kriging methods for Zones 1 and 2 are shown in Table 1. The SS1 and SS2 Skill-Score statistics represented in Eqs. (1) and (2) respec-tively, are used to quantify the improvement in daily pre-cipitation data estimates for both dates, using the MICE model in Estimates obtained by Kriging and Co-Kriging.
For both zones and dates, the estimates obtained by the MICE model were always better than those obtained by
Kriging and Co-Kriging. In all cases the mean square error obtained by the model MSEmod was considerably smaller than the average square error obtained by Kriging (MSEkrig) and Co-Kriging (MSEcokrig). For the first date in Zone 1 (Table 1), the estimation obtained by the multiple imputation model was 49.33% (SS1), better than the esti-mates obtained by Kriging and 65.92% (SS2) better than those obtained by Co-Kriging. In Zone 2 it was 36.26%
Figure 4- Precipitation density plots in January 20th, 2005 for Zones 1 (left) and 2 (right).
better and 62.00%, respectively. In the second date in Zone 1 it was 21.29% and 16.93% better and in Zone 2, the im-provement was 45.85% and 23.81% respectively. This re-sult indicates that the estimates obtained by the model are always better, indicating that neither the month nor the sea-son influence the results, for this experimental situation. However, the quality of the forecasting system from the multiple imputation model has always been better relative to the geo-statistical techniques for the rainy season (higher percentage) for both Zones, indicating that the amount of precipitation values with zero millimeter can change the re-sults.
This study showed the importance to consider impu-tation methods for missing data, especially the multiple im-putation. However care should be taken to generalize the results obtained with this work, because they were obtained in a particular situation, without worrying about sample size, the type of variable and the relationships among the variables involved, which must always be taken into ac-count.
4. Conclusions
• The application of a multiple imputation (MICE) model
produced better estimates of daily precipitation values than geostatistical Kriging and Co-Kriging models for the period under study.
• The multiple imputation model proved to be a versatile
technique, adaptable to different seasons, and should be considered as an alternative to fill gaps in time series of precipitation.
• The mean squared errors obtained by the model were
considerably lower than the mean squared errors ob-tained by Kriging and Co-Kriging.
• For the two time periods studied, predictions using the
multiple imputation model were more than 16% better for the first zone and more than 23% for the second one, when compared to the forecasts obtained by geo-statistical techniques.
Acknowledgments
The authors would like to thank the anonymous re-viewers for the considerable contribution.
References
BUUREN, S.V.; GROOTHUIS-OUDSHOORN, K. MICE: Mul-tivariate imputation by chained equations in R.Journal of Statistical Software, v. 45, n. 3, p.1-67, 2011.
BUUREN, S.V. Package MICE Available in: https://cran.r-project.org/web/packages/mice/mice.pdf. Access in: May. 2016.
BYRNE, J.; SPENCE, M.S.; FRETZ, E.; MILDENBERGER, R.; CHASE, A.; BERRY, B.; PI, D.; JANSSEN, C.; KLINKE, P.; HILTON, D. Body Mass index, periprocedural bleeding, and outcome following percutaneous coronary intervention
(from the British Columbia Cardiac Registry).American Journal of Cardiology, v. 103, n. 4, p. 507-511, 2009. CARVALHO, J.R.P. de; ASSAD, E.D.; PINTO, H.S. Kalman
fil-ter and correction of the temperatures estimated by PRECIS model.Atmospheric Research, v. 102, p. 218-226, 2011. CARVALHO, J.R.P. de; NAKAI, A.M.; MONTEIRO, J.E.B.A.
Spatio-Temporal modeling of data imputation for daily rain-fall series in Homogeneous Zones.Revista Brasileira de Meteorologia, v. 31, n. 2, p. 196-201, 2016.
CHEN, F. Bayesian modeling using the MCMC procedure,SAS Global Forum 2009,Statistics and Data Analysis, Forum
2009, paper 257, 2009.
DEMPSTER, A.P.; LAIRD, N.M.; RUBIN, D.B. Maximum like-lihood from incomplete data via the EM algorithm,Journal of the Royal Statistical Society, Series B, v. 39, n. 1, p. 1-38, 1977.
EMBRAPA INFORMÁTICA AGROPECUÁRIA. Agritempo -Sistema de Monitoramento Agrometeorológico. Campinas. Available in: www.agritempo.gov.br/. Access in: Oct. 2016. FINKE, R.; ADAMCZYK, A. Cross-National Moral Beliefs: The
influence of national
religious context.Sociological Quarterly, v. 49, n. 4, p. 617-652, 2008.
FRASER, G.; YAN, R. Guided multiple imputation of missing data: using a subsample to strengthen the missing-at-random assumption.Epidemiology, v. 18, n. 2, p. 246-52, 2007.
GERESTEIN, C.G.; EIJKEMANS, M.J.C.; JONG, D.D.; VAN DER BURG, M.E.L.; DYKGRAAF, R.H.M.; KOOI, G.S.; BAALBERGEN, A.; BURGER, C.W.; ANSINK, C.A. The prediction of progression-free and overall survival in wom-en with an advanced stage of epithelial ovarian carcinoma.
BJOG: An International Journal of Obstetrics and Gy-naecology, v. 116, n. 3, p. 372-380, 2009.
GRANBERG-RADEMACKER, J.S. A comparison of three ap-proaches to handling incomplete state-level data,State Poli-tics and Policy Quarterly, v. 7, n. 3, p. 325-338, 2007.
GREENLAND, S.; FINKLE, W.D. A critical look at methods for handling missing covariates in epidemiologic regression analyses. American Journal of Epidemiology, v. 142, n. 12, p. 1255-1264, 1995.
HAREL, O.; ZHOU, X.H. Multiple imputation: review of theory, implementation and software.Statistics in Medicine, v. 26, n. 16, p. 3057-77, 2007.
KELLER FILHO, T.; LIMA, P.R.S.R.; ASSAD, E.D. Regiões pluviometricamente homogêneas no Brasil.Pesq. Agropec. Bras., v. 40, n. 4, p. 311-322, 2005.
KLEIN, L.W.; KOLM, P.; XU, X.; KRONE, R.J.; ANDERSON, H.V.; RUMSFELD, J.S.; BRINDIS, R.G.; WEINTRAUB, W.S. A longitudinal assessment of coronary interventional program quality “a report from the american college of car-diology-national cardiovascular data registry.”JACC: Car-diovascular Interventions, v.2, n. 2, p. 136-143, 2009. LIBONATI, R.; TRIGO, I.; DA CAMARA, C.C. Corrections of 2
m-temperature forecasts using Kalman filtering technique.
Atmospheric Research,v. 87, n. 2, p. 183-197, 2008. LIMA, J.G.S. Integração de dados climatológicos
heterogêne-os,Tese MSc. Instituto de Computação, UNICAMP,
Cam-pinas, SP, 2003, 104p.
similar to maximum likelihood,Journal of the American Statistical Association,v. 94, n. 448, p. 1147-1160, 1999. LITTLE, R. Missing-data adjustments in large surveys,Journal
of Business and Economic Statisticsv. 6, n. 3, p. 287-296,
1988.
MICHEL, L.; GIORGI, R.; VILLES, V.; POIZOT-MARTIN, I.; DELLAMONICA, P.; SPIRE, B.; PROTOPOPESCU, C.; CARRIERI, M.P. Withdrawal symptoms as a predictor of mortality in patients HIV infected through drug use and re-ceiving highly active antiretroviral therapy (Haart).Drug and Alcohol Dependence, v. 99, n. 1-3, p. 96-104, 2009. NASCIMENTO, T.S.; SARAIVA, J.M.B.; SENNA, R.;
AGUI-AR, F.E.O. Preenchimento de falhas em banco de dados pluviométricos com base em dados do cpc (climate predic-tion center): estudo de caso do rio solimões-amazonas. Re-vista Brasileira de Climatologia. v. 7, n. 6, p. 143-158,
2009.
NOGHREHCHI F. Missing data analysis with MICE. Avaible in: http://web.maths.unsw.edu.au/~dwarton/missingDataLab.h tml. Acess in: June, 2016.
NUNES, L.N.; KLUCK, M.M.; FACHEL, J.M.G. Comparação de métodos de imputação única e múltipla usando como exemplo um modelo de risco para mortalidade cirúrgica.
Rev. Bras Epidemiol,v. 13, n. 4, p. 596-606, 2010.
OLIVEIRA, L.F.C.; FIOREZE, A.P.; MEDEIROS, A.M.M.; SILVA, M. Comparação de metodologias de preenchimento de falhas de séries históricas de precipitação pluvial anual.
Revista Brasileira de Engenharia Agrícola e Ambiental, v.14, n. 11, p. 1186–1192, 2010.
R DEVELOPMENT CORE TEAM. 2015. R: A language and en-vironment for statistical computing. Vienna: The R Founda-tion for Statistical Computing, 2011. Available in: http://www.gbif.org/resource/81287. Access in: May. 2015. ROBINS, J.M.; ROTNITZKY, A.; ZHAO, L.P. Estimation of
re-gression coefficients when some regressors are not always observed.Journal of the Royal Statistical Society, v. 89, n. 427, p. 846-866, 1994.
RUBIN, D.B.Multiple Imputation for Nonresponse in Sur-veys.New York: Wiley, 1987.
RUBIN, D.B. Multiple imputation after 18+ years.Journal of the American Statistical Association, v. 91, n. 434, p. 473-89, 1996.
SCHAFER, J.L.; GRAHAM, J.W. Missing data: our view of the state of the art.Psychological Methods, v. 7, n. 2, p. 147-177, 2002.
SUNDELL, K.; HANSSON, K.L.; OFHOLM, C.A.; OLSSON, T.; GUSTLE, L.H.; KADESK, C. The transportability of multisystemic therapy to sweden: short-term results from a randomized trial of conduct-disordered youths.Journal of Family Psychology, v. 22, n. 4, p. 550-560, 2008. TANASOIU, C.; COLONESCU, C. Determinants of support for
european integration: the case of bulgaria.European Union Politics, v. 9, n. 3, p. 363-377, 2008.
TON, T.G.N.; LONGSTRETH, J.; KOEPSELL, T. Active and passive smoking and risk of narcolepsy in people with Hla Dqb1*0602: a population-based case-control study. Neuro-epidemiology, v. 32, n. 2, p. 114-121, 2009.
TURRADO,C.C.; LOPEZ, M.C.M.; LASHERAS, F.S.; GÓ-MEZ, B.A.R.; ROLLÉ, J.L.C.; JUEZ, F.J.C. Missing data imputation of solar radiation data under different atmo-spheric onditions.Sensors, 2014, doi:10.3390/s141120382. VAN DEN HOUT, W.B.; GOEKOOP-RUITERMAN, Y.P.M.;
ALLAART, C.F.; VRIES-BOUWSTRA, J.K.D.; HAZES, M.J.M.; KERSTENS, P.J.S.M.; VAN ZEBEN, D.; HULSMANS, H.M.J.; JONGE-BOK, J.M.D.; SONNA-VILLE, P.B.J.D.; DIJKMANS, B.A.C.; BREEDVELD, F.C. Cost-Utility analysis of treatment strategies in patients with recent-onset rheumatoid arthritis.Arthritis Care and Research, v. 61, n. 3, p. 291-299, 2009.
YAMAMOTO, J.K.; LANDIM, P.M.B.Geoestatística: conceito e aplicações. Oficina de Textos, São Paulo, BR, 2013. WESONGA, R. On multivariate imputation and forecasting of
de-cadal wind speed missing data.SpringerPlus, 2015, DOI
10.1186/s40064-014-0774-9.