Article
Printed in Brazil - ©2017 Sociedade Brasileira de Química0103 - 5053 $6.00+0.00
*e-mail: [email protected]; [email protected]
Confocal Fluorescence Microscopy and Kinetics of the Cr
3+-Chromate Ion
Oxidation Equilibria at the Solid Liquid Interface
Gizelle I. Almerindo,a Anika P. A. Gaborim,b Lucas M. Nicolazi,a Muhammad Idrees,a
Faruk Nome,a Haidi D. Fiedler*,a and Rene A. Nome*,b
aInstituto Nacional de Ciência e Tecnologia de Catálise em Sistemas Moleculares e
Nanoestruturados (INCT-Catálise), Departamento de Química, Universidade Federal de Santa Catarina, 88040-900 Florianópolis-SC, Brazil
bInstituto de Química, Universidade Estadual de Campinas, 13083-970 Campinas-SP, Brazil
Silica-borax pearl samples impregnated with 0.17 and 0.64% Cr3+ were characterized by speciic surface area measurements, UV-Vis spectroscopy, energy-dispersive X-ray luorescence and laser-scanning confocal microscopy. Pearl stability against oxidizing conditions was tested by adding samples to an aqueous hydrogen peroxide solution. The reaction was examined by UV-Vis spectroscopic measurements of the supernatant and laser-scanning confocal microscopy images of the substrate. Overall, hydrogen peroxide-induced Cr3+ to Cr6+ oxidation across the solid-liquid interface promoted solid matrix cleavage pearl degradation and concomitant formation of multiple scattering centers was observed. A dual-detection scheme was employed in the confocal microscopy measurements allowing us to separate scattering and absorptive contributions to the observed signals. The confocal microscopy images indicate that Cr3+ oxidation induced by hydrogen peroxide solutions occurs throughout the entire pearl sample and indicate that oxidation reactions induce leakage of chromate ion into aqueous solutions.
Keywords: confocal luorescence microscopy, chromium mobility, H2O2 oxidation equilibria,
solid liquid interfaces, mass transfer phenomena, energy dispersive X-ray luorescence
Introduction
The mobility and eco-toxicity of metals in the environment depend strongly on their speciic chemical forms and on the relative diffusion rates in solid environments. In fact, mobility, distribution, and speciation of metals in soils are of fundamental importance because they deine the most suitable method for the remediation of contaminated soils.1,2
Soils/sediments are complex materials, and mass transfer phenomena usually control the rate of chemical reactions in such environments. Immobilization of inorganic or organic materials is normally proposed as
a method of industrial waste disposal.3 Contamination
of different types of soils is a recurrent problem. For
example, sand soil is commonly contaminated and is
of particular interest to countries, such as Brazil, which have a long shoreline.2 In this context, our research group
has directed efforts on studies related to adsorption/
desorption processes of metal ions at the solid surface-water interface.4,5
More specifically, the contamination of soil and groundwater by large amounts of water containing chromium from industrial waste is a serious environmental
problem.6 Chromium species are also present in much
radioactive waste.7 Moreover, contamination by chromium
can occurnaturally, e.g., when chromium-bearing minerals
are washed away or volcanic eruptions take place.8 Among
the various oxidation states of chromium the most abundant
are Cr3+ and Cr6+, the latter showing higher toxicity
(including mutagenic and carcinogenic properties).2,8-10 Cr3+
does not show health risks, but special attention should be given to this oxidation state as the presence of oxidants in the soil can oxidize it to Cr6+ which is even more dificult
to remove using physical treatment processes.11 Although
it is possible to oxidize Cr3+ with natural oxidants such as
dissolved O2 (DO), such oxidation shows slow reaction
kinetics (half lives in the order of 1-20 months).10,12-14
and greatly increase the presence of Cr6+. According to
Pettine and Capri10 the choice of experimental conditions
for the extraction of Cr should be based on minimizing
the chances of Cr3+-Cr6+ interconversions. The United
States Environmental Protection Agency (EPA) mentions
in situ remediation of organic contaminants with hydrogen peroxide (H2O2).15 But thisshould take into account the
presence of Cr as a co-contaminant in the soil before performing the oxidation of organic contaminants by H2O2
as it can lead to considerable levels of Cr6+ being formed.
Helz and co-workers16 investigated the effect of H 2O2 in
the oxidation state and solubility of Cr3+ and Cr6+, common
co-contaminants of organic chemical waste. According to the authors, the use of H2O2 for in situ remediation
of chemically complex wastes results in increasing Cr6+
mobility.
Hydrogen peroxide also occurs naturally and may be produced by photochemical reactions of natural organic matter with dioxygen and by biological processes mediated by algae.17 In fact, it is ubiquitous in aquatic environments
but its natural balance may be affected in disproportionate growth of algae. In addition, the H2O2 that is present in
snow/ice has an important role in oxidation reactions that occur in the polar regions where it is also a precursor of hydroxyl radicals (•OH).18,19
It is important to notice that despite the strong effort in the understanding in reactions in homogeneous systems, the interaction of aqueous solutions with mineral surfaces is one of the most important reactions in nature, with important consequences in dissolution, precipitation and sorption processes, affecting a variety of important phenomena,
including the mobility of heavy metal contaminants.20
As indicated by Brown20 almost 15 years ago, the next
increase in complexity studies is to study reactions at the interface between mineral surfaces and aqueous solutions. The use of methods which could determine the changes observed in situ, are therefore intrinsically important and could provide kinetic information on the transformation of redox-sensitive pollutant species.
Thus, trying to follow modern perspectives in surface science, and in order to contribute to the understanding of mass transfer phenomena in complex systems, we decided to study the reaction of Cr3+ with H
2O2 across the solid/water
interface. The reaction was chosen because it is very well known process, which depends in pH and other factors.21,22 A
solid system containing Cr3+ in silica-borax pearl samples was
selected to study the kinetics effect of oxidative conditions across the solid/liquid interface, specially to understand the effect of this particularly important reaction on chromium mobility. To determine the concentrations of chromium in the pearls we used X-ray luorescence analysis (XRF) and
confocal microscopy was used to investigate the spatial distribution of Cr3+ in the synthesized pearls (glass discs)
before and after reaction with H2O2.23,24
Experimental
Reagents and solutions
Standard solutions containing of Cr3+ (Vetec,
lot No. U12530) and or hydrogen peroxide 30% solution (Vetec, min. dosage 30%, lot No. 1203818) were used with appropriate dilutions. Doubly deionized water with conductance < 5.6 × 10⁻⁸Ω-1 cm-1 and pH 6.0-7.0 from a
NANOpure analytical deionization system (type D-4744) was used to prepare standard and reagent solutions. All other reagents were of the best available analytical grade. All spectroscopic measurements were made in a temperature controlled room, 24 ± 1 oC.
Wet impregnation of Joaquina sand
Samples with 0.17 and 0.64% of Cr2O3 incorporated in
high purity sand were prepared by high-energy mechanical milling, followed by calcination in air atmosphere at 600 oC for 4 h. The initial materials used in this work were
CrCl3.6H2O and Joaquina Sand containing 99.16% SiO2 and
minor quantities of impurities, with particle size < 63 µm.2
Samples of Joaquina Sand are from the dunes of Joaquina Beach (Florianópolis city, State of Santa Catarina, Brazil)
and its high purity has been veriied in previous work.2
Milling was carried out in air atmosphere and at room temperature for 1 h. The milling intensity was 200 rpm, and a ball-to-powder weight ratio of 11:1 was chosen. The milling container was equipped with 30 balls with diameter of about 19 mm conined in a 2000 mL bowl. Both the ball and bowl materials were made from ceramic.
Surface area determination
All nitrogen adsorption measurements were performed at –196 °C using a Nova 2200e Quantachrome instrument. In all cases, samples were degassed at 110 °C under vacuum for 1 h. The Brunauer, Emmett and Teller (BET) method was applied in data obtained in the P/Po range between 0.05 and 0.30.
UV-Vis measurements
The presence of Cr3+ or Cr6+ in pearls was determined using
reaction of pearl with H2O2 (0.8 g of pearl, 5 mL H2O2
30% v/v) was analyzed in a Hewlett Packard (model HP-8453) spectrophotometer. The optical characterization shown in Figure 1 was performed by placing the pearls directly in the UV-Vis spectrophotometer sample compartment. The disk-shaped pearls have 2.5 cm diameter and 1 cm thickness. We effectively measured extinction spectra since the pearl samples strongly absorb and scatter light. Sample degradation prevented us from obtaining extinction spectra of the pearls after reaction with H2O2.
Synthesis of pearls and analysis using energy dispersive X-ray fluorescence (EDXRF)
Analysis was undertaken in a temperature controlled room (24 ± 1 °C) using a S2 Ranger spectrometer (Bruker, Germany). The S2 Ranger measurements were carried out using a Pd X-ray tube, operated with Cu ilter and 50 kV and 250 µm. The acquisition time was 250 s (measurement time per region in the presence of air) and the X-rays used to excite the sample were produced using a 50 W, 50 kV, 2 mA X-ray VF50 tube. The tube and generator are capable of operating at voltages ranging from 10 to 50 kV and currents from 1 to 2000 µA providing that the maximum power of 50 W is not exceeded. The Cr3+ content (expressed
as Cr2O3) of the solids were quantiied using glass discs
(pearls), an automatic sampler and the EQUA-OXIDES software application were used for instrument control, data collection and data analysis (Bruker, Gemany). Before analysis, instrument calibration and stability check were performed. For the synthesis of the pearls, approximate quantities of 0.5 g of sample (Joaquina Sand and Cr3+) and
5 g of lux composed by a mixture of lithium tetraborate (Li2B4O7) and lithium metaborate (LiBO2) in a proportion
of 12:22, were weighted with accuracy of 0.0001 g directly into clean crucibles and fusions were performed in an Eagon 2 gas melting furnace, equipped with two positions for fusions, which are automatically lipped into Pt-Au casting plates with diameter of 40 mm and slowly cooled.
Confocal fluorescence microscopy
Measurements were performed with a Leica SP5 confocal laser scanning microscope. All confocal microscopy measurements employed the 633 nm laser line and a HCX PL APO CS 10x0.4 DRY objective. The software was LAS-AF (Leica Application Suite Advanced Fluorescence). We have employed two photomultiplier tubes (PMT) channels for detection to allow simultaneous monitoring of scattered and emitted light contributions to the observed signals.
Results and Discussion
Sample characterization
The speciic surface area values of Joaquina Sand and of samples containing 0.17 and 0.64% of Cr2O3 incorporated
by wet impregnation and high-energy mechanical milling (see Experimental section) are summarized in Table 1. As expected, the samples presented low speciic surface area. Clearly, the samples with small quantities of Cr2O3 show
an area similar to that of the original material, indicating that the milling process did not affect the structure of the solid material.
The chromium content of the pearls prepared by the fusion method (see Experimental section) was determined by XRF and the results are given in Table 2. As described above, the preparation of the pearls resulted in a 1:10 dilution of the chromium content of the samples and the chromium concentrations were selected to be in the range normally used to produce green silicate glasses (see below).
Chromium mobility and oxidation reactions
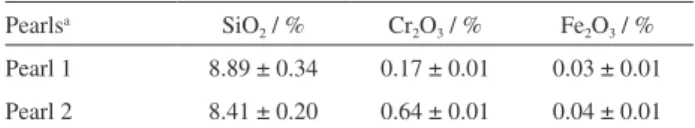
Figure 1A shows images of pearls containing 0.17
and 0.64% of Cr3+, with both samples having green color
resembling Brazilian emeralds and color intensities
proportional to their Cr3+ content (Cr3+ shows a green
coloration in silicate glasses, whereas Cr6+ shows a
yellowish color).25 Both pearls exhibit opacity and,
therefore, in order to optically characterize the pearls, we have compared their extinction spectra, which is the sum of absorption and scattering contributions to the spectra measured in the UV-Vis spectrophotometer (Figure 1B).
Table 1. Speciic surface areas of Joaquina Sand with and without Cr3+
Sample SBETa / (m2 g-1)
Joaquina Sand < 63 µm 0.603
Joaquina Sand + 0.17% Cr2O3 1.110
Joaquina Sand + 0.64% Cr2O3 1.036
aS
BET: speciic surface area.
Table 2. Chemical composition of pearls with Cr3+ determined by EDXRF
Pearlsa SiO
2 / % Cr2O3 / % Fe2O3 / %
Pearl 1 8.89 ± 0.34 0.17 ± 0.01 0.03 ± 0.01
Pearl 2 8.41 ± 0.20 0.64 ± 0.01 0.04 ± 0.01
Figure 1B shows the extinction spectra of both samples. We focus on the visible spectral region since scattering dominates the extinction spectra at lower wavelengths. As expected in this type of matrix with low chromium content,
we assume that the samples contain non-interacting Cr3+
absorbers, which are present in octahedral coordination with O atoms. The pearls exhibit a peak near 620 nm which corresponds to the lowermost energy band, with the characteristic shape of the crystal ield Cr3+ (4A
2→4T2)
absorption. In fact, the spectra is consistent with that normally reported for octahedrally coordinated Cr3+ in solid
matrices and the large linewidth is normally observed for such solid samples. Probably, the large linewidth of the peak at 620 nm is related to inhomogeneous broadening relecting the static heterogeneity of the oxygen ligand ield surrounding Cr3+ ions in the matrix. There is a sharp
increase in extinction below 500 nm, related to sample opacity. Overall, the results shown in Figure 1B allow us to choose 633 nm as the excitation wavelength in the confocal microscopy measurements, designed to characterize the Cr3+ distribution throughout the pearls.
Confocal microscopy of the Cr3+ pearls
As described in the Experimental section, a dual-detection scheme was employed whereby we simultaneously collect scattered and emitted light from the Cr3+ pearls in
two independent detector channels. We tested the stability
of the solid Cr3+ pearls against hydrogen peroxide and
visual inspection showed considerable degradation. In fact, simultaneously to the oxidation of Cr3+ to Cr6+, sample
degradation occurred and led to the formation of several strong scattering centers. Thus, the dual detection approach allows us obtain information about the distribution of Cr3+
as well as sample heterogeneity before and after reaction with hydrogen peroxide.
Figure 2 shows confocal microscopy images of Cr3+
pearls before and after reaction with hydrogen peroxide. Figures 2A and 2B show individual two-dimensional images, whereas Figures 2C and 2D show three-dimensional images obtained by orthogonal sectioning. Figures 2E and 2F, respectively, correspond to Figures 2C and 2D, with a different viewing angle. In the dual-detection approach employed here, the false color scheme chosen was: red color for scattered light (630 ± 5 nm) and blue color for emitted light (650-800 nm). Control confocal microscopy measurements of pearls without Cr3+ showed scattered light
signal only without emission signals. Thus, in the images
shown, blue color represents emission from Cr3+. All the
images shown in Figure 2 are a superposition of the signal collected in each channel. Dark regions in the sample indicate that no light was emitted/scattered from that region.
Figures 2A and 2B respectively show Cr3+ pearls
images before and after reaction with hydrogen peroxide. Both images reveal significant contributions from
Figure 2. Confocal microscopy images of Cr3+ pearls before (A, C and
E) and after (B, D and F) reaction with H2O2. Figure 1. (A) Photographs of pearls prepared by fusion containing 0.17%
Cr3+ (left) and 0.64% Cr3+ (right); (B) extinction spectra of the pearls
scattered and emitted light to the observed signals, thus suggesting that Cr3+ ions as well as scattering centers are
uniformly distributed throughout the sample. Comparing Figures 2A and 2B, we note that reaction of the pearls with hydrogen peroxide had two effects. First, increase in the dark area is consistent with sample degradation. Visual inspection of the pearls already had indicated sample degradation on the macroscopic scale. Figure 2B further shows that (i) sample degradation also occurs on the
microscope scale and (ii) degradation on the microscopic
scale is uniformly distributed throughout the sample. Finally, we note that Figure 2A appears to exhibit similar contributions from emitted and scattered lights (that is, the image is violet) whereas Figure 2B appears to exhibit stronger contributions from scattered light.
Figures 2C and 2E show images obtained by orthogonal sectioning before reaction with 30% hydrogen peroxide solution. Figures 2D and 2F show images obtained by orthogonal sectioning after reaction with 30% hydrogen peroxide solution. Figure 2C and 2E show both scattering and emission whereas almost no contributions from emitted light is seen in Figures 2D and 2F (after reaction with hydrogen peroxide). We note that absence of emitted light in Figures 2D and 2F indicates that scattering centers still exist after reaction of the Cr3+ pearls with
hydrogen peroxide.
Overall, the results shown in Figure 2 lead us to the following conclusions: (i) oxidation of Cr3+ ions by hydrogen
peroxide occurs throughout the sample, not just at the surface; (ii) oxidation of Cr3+ occurs uniformly and in three
dimensions; (iii) in addition to the redox reaction, hydrogen peroxide also causes degradation of the pearl matrix, as revealed by comparing the scattering contributions to the signal before and after reaction; (iv) oxidation of Cr3+ ions
is more pronounced than degradation of the silica/borax matrix. In fact, full pearl degradation with breaking of the solid pearl into small pieces can be observed to occur at the end of the oxidation reaction.
Kinetics of the Cr3+ oxidation
We tested the stability of the solid Cr3+ pearls against
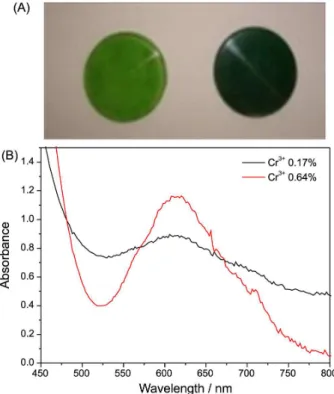
a hydrogen peroxide 30% solution as a function of pH and visual inspection, in all cases showed that the pearls degraded signiicantly upon interaction with hydrogen peroxide. In fact, Figure 3 shows typical absorbance spectra of the green solid as a function of time, immersed in a solution of 30% H2O2 at pH 7.7.
During the experiment, we can clearly see that the spectra of the solid samples at time zero, and after 300 and 1090 min of reaction showed a signiicant decrease in absorbance
in the range of 500 to 800 nm. However the shape of the spectra is basically identical in all cases and consistent with the extinction spectra of the pearls showed in Figure 1B. Clearly, despite the fact that a considerable part of the sample was already dissolved (the initial mass of the solid was 1.51 grams and after 1090 minutes the mass was only 1.33 grams) and that the solution was already showing the typical yellow color of chromate, the solid material remained with the emerald color basically unchanged, except for the decrease in absorbance. The result is a good evidence that the chromium is removed from the solid material during the oxidation reaction. It is interesting to comment that, during the oxidation process, the pH of the hydrogen peroxide solution increased from 7.7 to approximately 10.
It is important to note that the pH is a very important variable in the reaction and needs to be considered in detail. It is well known that in strongly acid solutions, the reverse reaction is observed and chromate is reduced fast and quantitatively to form the Cr3+ species. In the pH region
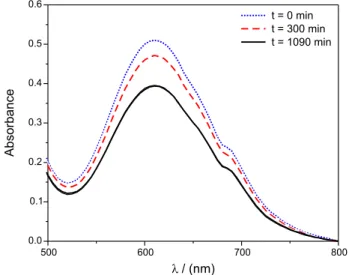
of 1 to 7, the kinetics is complex and initially the solution probably forms chromate which reacts with hydrogen peroxide forming diperoxochromate(VI), which can react further and shows a somewhat violet color. In fact, kinetics followed at pH 4 are complex and the solutions are not yellow (see Figure 4), but become yellow immediately after the addition of base.
Since the process is complex and the pH increases upon dissolution of the pearls, with changes in color of the solution, we decided to study the reaction in basic pH. The idea of preparing the pearls, using a lux composed by lithium tetraborate and lithium metaborate is key to the success of the experiments. In fact, the components of the lux used for the preparation of the pearls, result in
a solid system which during the observed degradation of the matrix produce a solution with inal pH close to 10,
which guarantees the oxidation of Cr3+ and the formation
of chromate, which is the stable form in alkaline pH.21,22
Figure 5A shows visually the observed changes and the appearance of a yellow color characteristic of the oxidation of Cr3+ to Cr6+ with formation of chromate (CrO
4−) species
in solution.22 In fact, the UV-Vis absorption spectrum of
the supernatant shown in Figure 5A is identical to the
well-known spectra observed with chromate solutions.4
The observed phenomenon is consistent with oxidation of Cr3+ to Cr6+ as described in Scheme 1, producing the
soluble chromate species. A simpliied kinetic scheme for the oxidation process is shown in Figure 3C, where we can see that there is a relatively fast initial step, which probably corresponds to release (and oxidation) of Cr3+ on
the pearl surface.
About 3 hours after the oxidation reaction had begun, there was a signiicant change in the slope of the oxidation reaction, relecting a change in rate determining step, with the increase of chromate in the supernatant occurring simultaneously with the progressive destruction of the pearl and increase in turbidity. Clearly, the reaction at the solid aqueous interphase becomes slower after the release of the Cr3+ on the pearl surface.
The analysis of the supernatant by UV-Vis spectroscopy allowed us to verify that Cr3+ incorporated in pearls can
readily react with hydrogen peroxide forming chromate ion, in a reaction at the solid liquid interface that facilitates
solubilization of Cr6+ species, via rupture of the solid
matrix. Probably, cleavage facilitates even further the oxidation reaction. In that sense, considering that confocal microscopy allowed the study of the three-dimensional spatial distribution of Cr3+ ions throughout silica,26 we
employed confocal microscopy to investigate the spatial distribution of Cr3+ in the pearls before and after reaction
with hydrogen peroxide.
Conclusions
We present synthesis and spectroscopic characterization of silica-borax pearls impregnated with Cr3+ at two different
Figure 4. UV-Vis absorption spectra of a 30% hydrogen peroxide solution, at pH 4, containing Pearl 2, as a function of time.
Scheme 1. Oxidation reaction of Cr3+-containing pearls.
Figure 5. (A) Photographs of the reaction of part of a pearl containing 0.64% of Cr3+ with a 30% v/v H
2O2 solution, at pH 10, and UV-Vis
concentrations: 0.17 and 0.64%. The spectroscopic results are correlated with the amount of Cr3+ impregnated in each
pearl. In addition, we have tested pearl stability under oxidizing conditions. Immersion of the pearls in 30% hydrogen peroxide solution led to pearl degradation and Cr3+ oxidation to Cr6+, as observed by visual inspection,
UV-Vis spectroscopy of the supernatant and confocal microscopy of the substrate. By simultaneously measuring emission and scattering off the sample, the confocal microscopy images allowed us to separate these two contributions to the observed signals. The resulting images showed that Cr3+ oxidation is more pronounced than sample
degradation under the oxidizing conditions explored in the present work. Within the context of industrial waste disposal techniques, our results shed light on the eficiency of immobilization of inorganic Cr3+-containing materials in
solid matrices. Overall, the results shown here are indicative that oxidation reactions induce leakage of chromate ion into aqueous solutions and, therefore, the use of immobilization of Cr3+ materials in solid matrices as a method of industrial
waste disposal, should always avoid such conditions.
Acknowledgments
The authors thank Natalia Bueno and Priscila Bueno for assistance with the EDXRF analysis and CNPq, CAPES and FAPESC for inancial support.
References
1. Zayed, A. M.; Terry, N.; Plant Soil2003, 249, 139.
2. Nome, R. A.; Souza, A. J.; Nome, C. A.; Souza, B. S.; Nome, F.; Fiedler, H. D.; Environ. Toxicol. Chem.2010, 29, 2426. 3. Santos, F. A.; Idrees, M.; Silva, M.; de Lima, P. H. E.; Bueno,
N.; Nome, F.; Fiedler, H. D.; Pires, M.; Desalin. Water Treat.
2013, 51, 5617.
4. Fritzen, M. B.; Souza, A. J.; Silva, T. A. G.; Souza, L.; Nome, R. A.; Fiedler, H. D.; Nome, F.; J. Colloid Interface Sci.2006,
296, 465.
5. Idrees, M.; Silva, M.; Silva, A. F.; Zimmermann, L. M.; Bruch, J.; Mendonca, C. O.; Almerindo, G. I.; Nome, R. A.; Atvars, T. D. Z.; Fiedler, H. D.; Nome, F.; J. Phys. Chem. C2012, 116, 3517.
6. Namgung, S.; Kwon, M. J.; Qafoku, N. P.; Lee, G.; Environ. Sci. Technol.2014, 48, 10760.
7. Hoffmann, M. M.; Darab, J. G.; Fulton, J. L.; J. Phys. Chem. A
2001, 105, 6876.
8. Kim, K.; Kim, J.; Bokare, A. D.; Choi, W. Y.; Yoon, H. I.; Kim, J.; Environ. Sci. Technol.2015, 49, 10937.
9. Perez-Benito, J. F.; Arias, C.; Rodriguez, R. M.; J. Phys. Chem. A
2001, 105, 1150.
10. Pettine, M.; Capri, S.; Anal. Chim. Acta2005, 540, 231. 11. Barrera-Diaz, C. E.; Lugo-Lugo, V.; Bilyeu, B.; J. Hazard.
Mater.2012, 223, 1.
12. Cranston, R. E.; Murray, J. W.; Anal. Chim. Acta1978, 99, 275. 13. Emerson, S.; Cranston, R. E.; Liss, P. S.; Deep-Sea Res. 1979,
26, 859.
14. Eary, L. E.; Rai, D.; Environ. Sci. Technol.1987, 21, 1187. 15. United States Environmental Protection Agency (US EPA);
EPA/542/S-98/008: In Situ Remediation Technology: In Situ Chemical Oxidation; US EPA: Washington, USA, 1998. 16. Rock, M. L.; James, B. R.; Helz, G. R.; Environ. Sci. Technol.
2001, 35, 4054.
17. Clark, C. D.; de Bruyn, W. J.; Jakubowski, S. D.; Grant, S. B.;
Mar. Pollut. Bull.2008, 56, 397.
18. Neftel, A.; Jacob, P.; Klockow, D.; Nature1984, 311, 43. 19. Kamiyama, K.; Motoyama, H.; Fujii, Y.; Watanabe, O.; Atmos.
Environ.1996, 30, 967.
20. Brown, G. E.; Science2001, 294, 67.
21. Knoblowitz, M.; Morrow, J. I.; Inorg. Chem.1976, 15, 1674. 22. Vander Griend, D. A.; Golden, J. S.; Arrington, C. A.; Inorg.
Chem.2002, 41, 7042.
23. Fiedler, H. D.; Drinkel, E. E.; Orzechovicz, B.; Leopoldino, E. C.; Souza, F. D.; Almerindo, G. I.; Perdona, C.; Nome, F.; Anal. Chem.2013, 85, 10142.
24. Zimmermann, L. M.; Almerindo, G. I.; Mora, J. R.; Bechtold, I. H.; Fiedler, H. D.; Nome, F.; J. Phys. Chem. C2013, 117, 26097.
25. Bamford, C. R.; Colour Generation and Control in Glass; Elsevier: Amsterdam, Netherlands, 1977.
26. Gaborim, A. P. A.; Atvars, T. D. Z.; Nome, R. A.; Curr. Opin. Colloid Interface Sci. 2013, 18, 47.