VIRTUAL POPULATION ANALYSIS OF TWO SNAPPER SPECIES,
LUTJANUS ANALIS AND LUTJANUS CHRYSURUS, CAUGHT OFF
PERNAMBUCO STATE, NORTH-EASTERN BRAZIL
Sérgio Macedo Gomes de Mattos1 and Francesc Maynou2
1Secretaria Especial de Aquicultura e Pesca (SEAP), Escritório no Estado de Pernambuco
(Av. Gal. San Martin, 1000, 50630-060 Bongi, Recife, PE, Brasil) E-mail: [email protected]
2Institut de Ciències del Mar (ICM-CSIC)
(Psg. Marítim de la Barceloneta 37-49, 08003 Barcelona, Spain) E-mail: [email protected]
A
B S T R A C TWe applied steady-state Virtual Population Analysis - VPA to two stocks of snappers (Lutjanus analis and L. chrysurus) exploited by artisanal hand-line fleets along the Pernambuco State coast
(North-eastern Brazil). We show that even short-data series (1 year of sampling) can produce a useful diagnosis of fisheries resources. Both stocks are slightly overexploited by the hand-line fishery and a higher yield-per-recruit would be obtained by a reduction of effort of 16% for L. analis and 43% for
L. chrysurus. Given the impracticability of managing the two stocks separately, we propose a 25% decrease of fishing effort for the hand-line fleet. By incorporating the results of VPA into a simulation framework, we can develop a comparison of the likely result of different policy options (effort regulation) based on 3 simple indicators (Spawning stock recruit, biomass-per-recruit and yield-per-biomass-per-recruit). We compare the results of effort reduction with those of effort increase (25%) through simulation analysis. Allowing for the difficulty of testing assumptions introduced in our model (steady-state, Beverton and Holt recruitment model) and using standard fisheries analysis techniques, we show that useful fisheries advice can be produced even in a context of limited data. Providing advice to developing countries coastal fisheries is an urgent issue, given the high dependence of local communities on coastal living resources and the increasing fishing effort applied by a growing population.
R
E S U M OFoi aplicado a Análise Virtual de População - VPA em estado estacionário a dois estoques de lutjanídeos (Lutjanus analis e L. chrysurus) explorados pela frota artesanal de linha de mão ao longo
da costa do Estado de Pernambuco (Nordeste do Brasil). Demonstrou-se que mesmo para uma série de dados não-históricos (1 ano de amostragem) pode-se produzir um diagnóstico útil dos recursos pesqueiros e que ambos os estoques estão próximo ao estado de sobrexplotação e melhor rendimento por recruta seria obtido com uma redução do esforço de pesca de 16% para L. analis e de 43% para
L. chrysurus. Dado a impraticabilidade de ordenar os dois estoques separadamente, propõe-se uma diminuição do esforço de pesca em 25% para a frota de linha de mão. Incorporando os resultados de VPA em estratégias de simulação, pôde-se desenvolver uma comparação dos prováveis resultados das diferentes opções de regulamentação pesqueira (regulamento do esforço) baseadas em 3 simples indicadores (biomassa do estoque reprodutor por recruta, biomassa por recruta e rendimento por recruta). Compararam-se os resultados da redução do esforço com o aumento do esforço (25%) através de uma análise de simulação. Admitindo as dificuldades em testar as suposições introduzidas em nosso modelo (estado estacionário, modelo de recrutamento de Beverton e Holt) e usando técnicas de análise padrão de pescarias, mostrou-se que medidas adequadas à regulamentação pesqueira podem ser obtidas, mesmo em um contexto de dados limitados. Fornecer recomendações às pescarias costeiras de países em desenvolvimento é uma prioridade, dada a elevada dependência das comunidades pesqueiras locais nos recursos vivos costeiros e do crescente esforço de pesca aplicado por uma população de crescimento.
Descriptors: Virtual population analysis, Coastal fisheries, Snapper, Pernambuco State.
I
NTRODUCTIONThe fisheries of Pernambuco State, North-eastern Brazil, are mainly conducted in the coastal zone by artisanal fishermen operating small fishing vessels, producing 13,999.5 t, 95.3% of the State’s total fish production (IBAMA, 2007). A variety of 16 kinds of fishing gear are used by coastal fishermen, mainly hand-line, gillnets, beach seines and traps. The fishing grounds of the coastal Pernambuco fisheries cover about 1,500 nm2 (Fig. 1), and although official statistics
indicate that production seems to be stable, the local fishermen´s perception is that the abundance of the coastal fisheries resources is declining and becoming overexploited, due mainly to increasing fishing effort and lack of effective enforcement of fisheries regulations. To provide advice on the optimal effort levels to sustain coastal fisheries in Pernambuco State we applied a relatively simple, but robust, modelling approach to the main species exploited by the hand-line fleet in this area. The approach should enable decision-makers and administrators to obtain a straightforward instrument that can assess possible consequences deriving from the adoption of policy decisions regarding fisheries (WILLMANN; GARCÍA, 1986).
Fig. 1. Operational area of the hand-line artisanal fishing fleet off Pernambuco State, Brazil, continental shelf.
The main fishery resources of the Pernambuco coast are coastal reef fishes, such as snappers (Lutjanidae) and groupers (Serranidae), and although recently biological studies have been conducted, uncertainties regarding the decision as to the right management measure to put into practice is still a concern among scientists and decision makers, because data on these resources are often scarce (MATTOS, 2004; MATTOS et al., 2006). The frequency and distribution of catches of Lutjanid and Serranid species by the artisanal fishing fleet in the Northeast Region of Brazil have been recently
reported by Frédou and Ferreira (2005) and Frédou et al. (2006) for Lutjanid and by Teixeira et al. (2004) for Serranid. Both groups are target species for many Brazilian Northeastern Region fleets, especially during periods of feeding aggregation seemingly related to the Southward chain reaction (TEIXEIRA et al., 2004). Nevertheless, to provide a sound basis for fisheries management (PERRINGS, 2000) for the Pernambuco state fishery sector, it is essential to deepen knowledge on the biology of fishing resources, aiming at an adequate comprehension on Lutjanid population dynamics. Leite Jr. et al. (2005) have commented that Lutjanus genus is the most diversified of the Lutjanidae family and the most important from the economic point of view.
The most abundant species in the catches of coastal fisheries (in terms of biomass) is the mutton snapper, Lutjanus analis (CUVIER, 1828), of 160.9 t in 2002, while the most abundant species in number of individuals in the catches is the yellowtail snapper, Lutjanus chrysurus (BLOCH, 1791), of 69.7 t in 2002 (IBAMA, 2003). Frédou and Ferreira (2005) stressed that both mutton snapper and yellowtail snapper, together with the dog snapper, L. jocu, inhabit intermediate depths between 20m and 80m, where they are mainly caught. On the other hand, Carvalho Filho (1999) has mentioned that the mutton snapper, a larger lutjanid species, inhabits deeper regions of the continental shelf and the continental slope, whereas younger individuals are more frequently found in shallower regions, and that the yellowtail snapper, a smaller lutjanid species, is more frequent in shallower regions, thus being more vulnerable to the fishing effort applied, due to the accessibility of hand-liners to inshore fishing grounds, and the fishing gear utilised. This aspect is in accordance with the argument of Frédou and Ferreira (2005) for whom a complex of significant factors seems to influence the catch composition and is related to distance from shore and depth of fishing. Although hook-and-line seems to be quite selective, it is known that the size of the hook can lead to great variability in the size of fish caught and may affect selectivity effects.
are based on snapper coastal fisheries, they should contribute to the design of an effective management strategy for Brazil’s coastal resources in general.
M
ATERIAL ANDM
ETHODSData Source
The operations of 18 hand-line fishing boats were followed monthly from November 2001 to October 2002. Fishery (catches, effort) and biological information (individual length and weight) were recorded during landings, and through interviews carried out with each fishing boat master and crew. Total and fork length were rounded down to the nearest centimetre and eviscerated weight (g) were recorded for each individual of the 2 species selected for this study (Lutjanus analis and L. chrysurus).
Estimation of Growth Parameters
Modal progression analysis (Bhattacharya method) was used to establish von Bertalanffy’s growth parameters and determine the growth curves (FISAT: GAYANILO et al., 2002). We acknowledge that Modal Progression Analysis – MPA is of limited use in estimating growth parameters for tropical fish species, but it is the only practical method in the absence of costly otolith-based analysis. MPA is also widely used for assessing tropical fisheries (SPARRE et al., 1989). The values of the parameters L∞ and K were validated through Surface Response Analysis and Scanning of K-values (GAYANILO et al., 2002).
Virtual Population Analysis – VPA
The length-based Virtual Population Analysis (VPA) was performed on the pooled annual length frequencies from the fishery to estimate the mean number in the population and the overall fishing mortality by length group. The overall fishing mortality was sub-divided into fishing mortality by gear-type based on the proportion of individuals caught by each type of gear.
The virtual population of the two snappers, under steady state, was reconstructed using the program “VIT – Software for fishery analysis” (LLEONART; SALAT, 1997). The VIT program, beyond allowing other important indicators of a fish population subject to exploitation to be obtained, also permits a Yield-per-recruit analysis to be made, as well as an analysis of the variations in exploitation rate (simulation analysis) and an assessment of the sensitivity of the results to uncertainty in input parameters. The program works with pseudo-cohorts and is, therefore, suitable for the analysis of
non-historical fish catch series, based on the classic catch equation (standard VPA, GULLAND, 1969).
The input value of the terminal fishing mortality (Fter) was estimated in the light of the fact that F is proportional to the stock density and the intensity of fishing, defined as the fishing effort per unit of area or, more precisely, related to the stock density and the fishing effort. Due to the uncertainty involved in estimating natural mortality (M), the relationship Z = F + M was used after estimating total (Z) and fishing (F) mortalities, using Beverton and Holt’s approach as given in FISAT (GAYANILO et al., 2002).
The impact on the stocks´ health (as measured by SSB/R and B/R) of varying fishing efforts was analysed within two scenarios of either deterministic or stochastic recruitment, using a plausible set of parameters for Beverton and Holt’s stock-recruitment model over a 20-year simulation period. In the stochastic simulation case, the number of iterations performed was 100. The stochastic model used for recruitment was a lognormal distribution of mean 1 and standard deviation 0.1. The fishing effort variations are given as proportions of current fishing effort (25% increase, 25% decrease, or applying effort level which maximizes Y/R). The results are presented as Yield-per-recruit (Y/R), Biomass-per-recruit (B/R) and Spawning stock biomass-per-recruit (SSB/R).
R
ESULTSA total of 3,749 specimens of L. analis were caught during the study and 252 were measured and weighed to determine the length-weight relationships and the frequency distribution for the definition of growth parameters. Length ranged from 32 cm to 90 cm (TL) (Fig. 2a). A total of 10,152 specimens of L. chrysurus were caught and 529 were measured and weighed. Length ranged from 26 cm to 64 cm (TL) (Fig. 2b).
Length-at-age and Weight-at-age
The length-at-age vector computed from von Bertalanffy’s growth parameters for L. analis is shown in Table 1. The parameters obtained for the length-weight relationship were a = 0.0112 and b = 3.0019, and for von Bertalanffy’s growth curve were L∞= 108.20 cm TL, W∞ = 14.34 kg, K = 0.168 yr-1 and t0 = -0.892 yr. The growth equations in length and weight are, therefore:
[
1
exp(
0
.
168
(
0
.
892
))
]
20
.
108
−
−
+
=
t
L
tand
(
)
[
]
3.0019)
892
.
0
168
.
0
exp(
1
34
.
14
−
−
+
=
t
2a
2b
Fig. 2. Length frequency distribution of the mutton snapper, Lutjanus analis (a, left) and the yellowtail snapper, Lutjanus chrysurus (b, right), caught off Pernambuco State, North-eastern Brazil, continental shelf.
Table 1. Age, length and weight vectors for mutton snapper,
Lutjanus analis (Cuvier, 1828), caught off Pernambuco State, North-eastern Brazil, continental shelf.
Age (year) Total Length - TL
(cm)
Eviscerated Weight - EW
(kg)
0 0 0
1 16.78 0.053
2 30.96 0.335
3 42.94 0.895
4 53.07 1.690
5 61.62 2.646
6 68.84 3.692
7 74.95 4.764
8 80.11 5.818
9 84.47 6.820
10 88.15 7.752
11 91.26 8.603
12 93.89 9.370
13 96.11 10.050
14 97.98 10.650
15 99.57 11.176
The length-at-age vector computed from the von Bertalanffy’s growth parameters for L. chrysurus is shown in Table 2. The parameters obtained for the length-weight relationship were a = 0.0183, and b = 2.7753; and for von Bertalanffy’s growth curve L∞= 76.67 cm TL; W∞ = 3.104 kg; K = 0.158 yr-1; and t
0 = -0.728 yr. The growth equations in length and weight are, therefore:
[
1
exp
(
0
.
158
(
0
.
728
))
]
67
.
76
−
−
+
=
t
L
tand
(
)
[
]
2.7753) 728 . 0 158 . 0 exp( 1 104 .
3 − − +
= t
We
Table 2. Age, length and weight vectors for yellowtail snapper, Lutjanus chrysurus (Bloch, 1791), caught off Pernambuco State, North-eastern Brazil, continental shelf.
Virtual Population Analysis
Fishing mortality (F) for L. analis was estimated on the basis of CPUE and the catchability coefficient (q). Considering a CPUE of 22.48 kg/100 hooks, a total annual catch of 160.9 t (IBAMA, 2003), a total effort (f) of 28,316 hooks, and a coefficient of catchability of 0.97 x 10⁻⁵ hook-1 • year-1, F was
Age (year) Total Length – TL
(cm)
Eviscerated Weight – EW
(kg)
0 0 0
1 11.21 0.015
2 20.77 0.083
3 28.94 0.208
4 35.92 0.378
5 41.87 0.579
6 46.96 0.796
7 51.30 1.018
8 55.01 1.235
9 58.17 1.443
10 60.87 1.637
11 63.18 1.815
12 65.15 1.976
13 66.84 2.121
14 68.27 2.250
calculated to be 0.277 yr-1. The total mortality (Z) was
estimated as 0.429, yielding an estimate of natural mortality (M) equal to 0.152. With the same approach for L. chrysurus and using CPUE = 17.62 kg/100 hooks, a total annual catch of 97.6 t (IBAMA, 2003), and a coefficient of catchability (q) of 1.26 x 10⁻⁵ hook-1 · year-1, F was calculated to be 0.358 yr-1. The
total mortality (Z) was estimated at 0.470, yielding an estimate of M equal to 0.112.
It was not possible to estimate the maturity from the sampling and the average-length-at-maturity was taken from Froese and Pauly (2003). According to these authors, L. analis first mature between 40 cm and 50 cm. It was considered, thus, that the onset of maturity occurs in length classes 40-45 cm, while all individuals above 45 cm were assumed to be mature. With the population reconstructed by age, instead of length, we estimated that 7% of the population reached maturity during the first year of life, while 83.6% of the individuals belonging to the age-class 2 were mature as were also all individuals in the 3+ year-class. Age-class 2 showed the highest mortality rates, estimated at Z = 0.654•yr-1 and corresponding to F = 0.502•yr-1. The summary results of the steady state
VPA are shown in Table 3.
The current mean age of the stock of L. analis is 2.9 yr, although effort is being applied mainly to individuals slightly older (3.2 yr) than the critical age (3 yr), which means that the spawning stock´s population status is not heavily fished. On the other hand, the virgin stock´s critical age (8 yr) is much higher than the mean age of the catch, and the number of recruits (38,542) is relatively low, suggesting that the exploitation pattern should be improved. The balance between biomass and catch (33.7%) and the fishing mortality (F) rates (mean 0.313 yr-1; global 0.3 yr-1) showed that the rate of exploitation (F/Z), or the
rate of current catch per unit of production (D), is 68.89%, while the natural mortality represents 31.11% of the biomass balance. Also, the production per unit of biomass, expressed as turnover (D/Bmean) and as a percentage, shows a rate of 48.9%, which is equivalent to the total mortality rate in terms of biomass.
For L. chrysurus, the length at first maturity is reported as 25 - 30 cm TL (FROESE; PAULY, 2003). It was considered that the onset of maturity occurs at length classes 27.6 - 30 cm TL, and that those individuals above 30 cm were assumed to be mature. With the population reconstructed by age, we estimated that 73.8% of the individuals belonging to class 2 were mature, while all those in the age-class 3+ were mature. Age-age-class 4 showed the higher mortality rate, with Z = 1.296 yr-1 and F = 1.184 yr-1.
The summary results of the steady state VPA are shown in Table 4.
Table 3. Summary information of the virtual population analysis (VPA) for mutton snapper, Lutjanus analis, caught off
Pernambuco State, North-eastern Brazil, continental shelf.
The current mean age of this stock is 2.6 yr, although fishing effort is mainly applied to individuals older (3.6 yr) than the critical age (3 yr), suggesting that this stock is not heavily fished either. However, the virgin stock´s critical age (9 yr) is much higher than the mean catch-at-age and the low number of recruits (78,478) suggests that the exploitation pattern should likewise be improved. The balance between biomass and catch (49.8%) and the fishing mortality rates (mean 0.428 yr-1; global 0.306 yr-1) showed that the rate of current catch per unit of production (D) is 81.64%, while natural mortality represents only 18.36% of the biomass balance. Also, the production per unit of biomass, expressed as turnover (D/Bmean) and as a percentage, shows a rate as high as 61%, which is equivalent to the total mortality rate in terms of biomass.
VPA Parameters Results
Catch Data
Catch mean age (year) 3.169
Catch mean length (cm) 51.708
Mean Fishing Mortality, F 0.313
Global Fishing Mortality, F 0.3
Total catch / year (g) 47047366.2
Catch / Biomass Balance, D (%) 68.89
Catch/Biomass, B (%) 33.66
Population Status
Current Stock Mean Age (year) 2.879 Current Stock Critical Age (year) 3 Virgin Stock Critical Age (year) 8 Current Stock Mean Length (cm) 48.54 Current Stock Critical Length (cm) 51.913 Virgin Stock Critical Length (cm) 83.9
Number of recruits, R 38541.86
Mean Biomass, Bmean (g) 139779837 Spawning Stock Biomass (SSB) (g) 119641040 Biomass Balance (D) (g) 68293901.5
Natural death / D (%) 31.11
Maximum Biomass, Bmax / Mean Biomass, Bmean
17.13
Turnover, D/Bmean (%) 48.86
Recruitment
Biomass/Recruit (B/R) 3626.702
Stock Spawning Biomass/Recruit (SSB/R)
3104.184
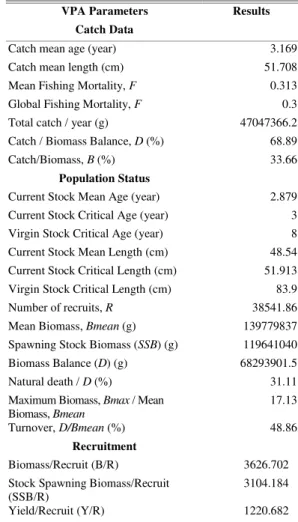
Table 4. Summary information of the virtual population analysis (VPA) for yellowtail snapper, Lutjanus chrysurus, caught off
Pernambuco State, North-eastern Brazil, continental shelf.
Yield-per-recruit
The results of the yield-per-recruit analyses are shown in Table 5 and Figure 3 for L. analis, and Table 6 and Figure 4 for L. chrysurus. At current levels of fishing effort (f=1) both stocks are slightly overexploited and the yield would improve by reducing fishing effort (Figs 3 and 4, left panels). Levels of both biomass-per-recruit and spawning stock biomass-per-recruit are at low levels under the current exploitation regime and could be improved by substantially reducing fishing effort (Figs. 3 and 4, right panels). The maximum yield per recruit for the stock of L. analis would be obtained by decreasing f to 0.84 (reduction of 16%), while a reduction of f to 0.57 (reduction of 43%) would ensure the maximum yield per recruit for L. chrysurus.
Table 5. Results of the yield-per-recruit analysis for the mutton snapper, Lutjanus analis, caught off Pernambuco State, North-eastern Brazil, continental shelf.
Y/R
0 200 400 600 800 1000 1200 1400
0 0,5 1 1,5 2
Fishing Effort
R
e
c
ru
it
m
e
n
t
0 2000 4000 6000 8000 10000 12000 14000 16000 18000
0 0,5 1 1,5 2
Fishing Effort
R
e
c
ru
it
m
e
n
t
B/R
SSB/R
Fig. 3. Yield-per-recruit (Y/R), Biomass-per-recruit (B/R) and Spawning stock biomass-per-recruit (SSB/R) curves, for mutton snapper, Lutjanus analis off Pernambuco State, North-eastern Brazil, continental shelf (see text for details).
VPA Parameters Results
Catch Data
Catch mean age (year) 3.654
Catch mean length (cm) 37.799
Mean Fishing Mortality, F 0.428
Global Fishing Mortality, F 0.306
Total catch / year (g) 24438337.9
Catch / Biomass Balance, D (%) 81.64
Catch/Biomass, B (%) 49.8
Population Status
Current Stock Mean Age (year) 2.578 Current Stock Critical Age (year) 3 Virgin Stock Critical Age (year) 9 Current Stock Mean Length (cm) 30.218 Current Stock Critical Length (cm) 34.128 Virgin Stock Critical Length (cm) 60.184
Number of recruits, R 72478.07
Mean Biomass, Bmean (g) 49070292.4
Spawning Stock Biomass (SSB) (g) 38049218.4 Biomass Balance (D) (g) 29934210.6
Natural death / D (%) 18.36
Maximum Biomass, Bmax / Mean
Biomass, Bmean
33.59
Turnover, D/Bmean (%) 61
Recruitment
Biomass/Recruit (B/R) 677.036
Stock Spawning Biomass/Recruit
(SSB/R) 524.976
Yield/Recruit (Y/R) 337.183
Slope at origin 4889.9067 Virgin biomass 602964715
Factor Y/R B/R SSB/R
0 0 15644.411 15041.281
0.58 1185.883 6216.591 5663.17
0.84 1234.265 4451.66 3917.09
1.01 1220.682 3626.702 3104.184
Table 6. Results of the yield-per-recruit analysis for the yellowtail snapper, Lutjanus chrysurus, caught off Pernambuco
State, North-eastern Brazil, continental shelf.
Simulation Analysis
The simulation, or transition, analysis within the two scenarios of high (increase by 25%) and low
(decrease by 25%) fishing effort showed that both stocks are sensitive to changes in the current exploitation pattern. Increasing fishing effort for L. analis by 25% shows that the performance of the indicators of stock status (SSB/R and B/R) would decrease (Fig. 5, left panel), with only short-term (1 yr) gains in yield per recruit (Y/R). Conversely, a decrease by 16% (close to the policy scenario of 25% reduction, not shown) of the effort applied would allow an improvement in the performance of the indicators SSB/R and B/R, while ensuring sustained yields (Y/R) in the medium and long term (Fig. 5, right panel): B/R would increase by 21% and SSB/R by 91.4% in the long-term, although Y/R would increase only by 0.9% with respect to present levels. These results show that a 16% reduction in fishing effort would not jeopardize fisheries´ yield of L. analis while allowing for stock recovery over a 20-yr horizon.
Y/R
0 100 200 300 400
0 0,5 1 1,5 2
Fishing Effort
R
e
c
ru
it
m
e
n
t
0 1000 2000 3000 4000 5000 6000
0 0,5 1 1,5 2
Fishing Effort
R
e
c
ru
it
m
e
n
t
B/R SSB
B/R
SSB/R
Fig. 4. Yield-per-recruit (Y/R), Biomass-per-recruit (B/R) and Spawning stock biomass-per-recruit (SSB/R) curves, for yellowtail snapper, Lutjanus chrysurus off Pernambuco State, North-eastern Brazil, continental shelf (see text for details).
0 500 1000 1500 2000 2500 3000 3500 4000
0 5 10 15 20
Year
R
e
c
ru
it
m
e
n
t
Y/R B/R SSB/R
Factor = 1.25
0 1000 2000 3000 4000 5000
0 5 10 15 20
Year
R
e
c
ru
it
m
e
n
t
Y/R B/R SSB/R
Factor = 0.84 (maximum)
Fig. 5. Results of the simulation analysis under conditions of deterministic recruitment, using a Beverton and Holt’s stock-recruitment model, and changes in the factor of effort (f), for mutton snapper, Lutjanus analis, off Pernambuco State, North-eastern Brazil, continental shelf (see text for details). Y/R – Yield-per-recruit; B/R – Biomass-per-recruit; and SSB/R – Spawning stock biomass-per-recruit.
Slope at origin 2287.8749
Virgin biomass (g) 385210002
Factor Y/R B/R SSB/R
0 0 5314.849 5158.63
For L. analis, the simulation analysis under stochastic conditions, with a simulated Beverton and Holt SSB/R model, showed that variability in recruitment would introduce uncertainty about the exact values of the indicators (SSB/R, B/R and Y/R) analysed over the 20-yr period, although the trends are the same as for the deterministic scenarios. A 25%
increase in effort would likely reduce the long-term values of SSB/R, B/R and Y/R (Fig. 6), while a reduction of effort to 84% of the present level would ensure that SSB/R and B/R would be higher (with 95% probability) than the present level, while Y/R will be higher with a probability of 70% (Fig. 7).
0 200 400 600 800 1000 1200 1400 1600
0 5 10 15 20
Year
R
e
c
ru
it
m
e
n
t
Y/R Lower 95% Upper 95%
Factor = 1.25
0 500 1000 1500 2000 2500 3000 3500 4000
0 5 10 15 20
Year
R
e
c
ru
it
m
e
n
t
B/R Lower 95% Upper 95%
Factor = 1.25
0 500 1000 1500 2000 2500 3000 3500
0 5 10 15 20
Year
R
e
c
ru
it
m
e
n
t
SSB/R Lower 95% Upper 95%
Factor = 1.25
Fig. 6. Results of the simulation analysis under conditions of stochastic recruitment, using a Beverton and Holt’s stock-recruitment model, and changes in the factor of effort (f) of 1.25, for mutton snapper, Lutjanus analis, off
Pernambuco State, North-eastern Brazil, continental shelf (see text for details). Y/R – Yield-per-Recruit; B/R – Biomass-per-recruit; and SSB/R – Spawning stock biomass-per-recruit.
0 500 1000 1500 2000
0 5 10 15 20
Year
R
e
c
ru
it
m
e
n
t
Y/R Lower 95% Upper 95%
Factor = 0.84 (maximum)
0 1000 2000 3000 4000 5000 6000 7000
0 5 10 15 20
Year
R
e
c
ru
it
m
e
n
t
B/R Lower 95% Upper 95%
Factor = 0.84 (maximum)
0 1000 2000 3000 4000 5000 6000
0 5 10 15 20
Year
R
e
c
ru
it
m
e
n
t
SSB/R Lower 95% Upper 95%
Factor = 0.84 (maximum)
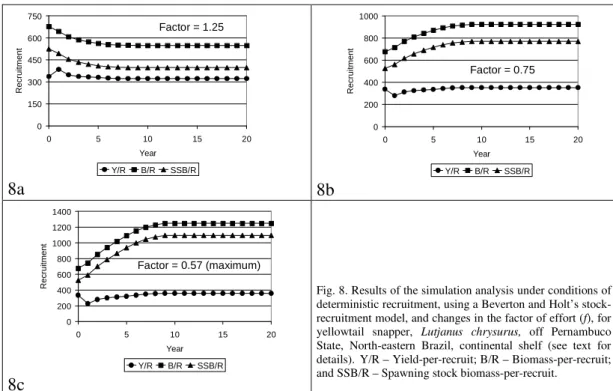
Increasing fishing effort for L. chrysurus by 25% shows that the performance of the indicators of stock status (SSB/R and B/R) would decrease (Fig. 8a), with only short-term (1 yr) gains in yield per recruit (Y/R), in the deterministic analysis. Conversely, a decrease by 25% of the effort applied would allow an improvement in the performance of the indicators SSB/R and B/R, while ensuring sustained yields (Y/R) in the medium and long term (Fig. 8b). A fishing effort policy aiming at maximizing the yield of L. chrysurus fisheries over the long-term would imply a reduction of effort to 57% of the present level, producing a strong increase in SSB/R and B/R, but not producing substantially higher Y/R over the long-term (Fig. 8c).
For L. chrysurus, the simulation analysis under stochastic conditions, with a simulated Beverton and Holt SSB/R model, shows that variability in recruitment would introduce uncertainty into the indicators (SSB/R, B/R and Y/R) analysed over the 20-yr period, although the trends are the same as for the deterministic scenarios (Figs 9, 10, 11). A 25% increase in effort would likely reduce the long-term values of SSB/R, B/R and Y/R with great probability (Fig. 9), while a reduction of effort to 75% of the present level would ensure that SSB/R and B/R were higher (with 95% probability) than the present level, while Y/R would be higher with a probability of 60% (Fig. 10). The fishing effort policy aiming at
maximizing the yield of L. chrysurus fisheries over the long-term (reduction of effort to 57%) would produce a strong increase in SSB/R and B/R, but not a substantially higher Y/R over the long-term (Fig. 11).
Sensitivity Analysis
For L. analis, the sensitivity analysis of the 3 parameters of von Bertalanffy's growth equation (L∞, k and t0), the two parameters of the length-weight relationship (a and b), the terminal fishing mortality (Fterm) and the natural mortality (M) showed that the most sensitive parameter was the parameter b of the length-weight relationship. This parameter represented a variation in the result of the Y/R analysis of up to 242%, when a factor of 0.1 was applied. The variation in the Y/R analysis due to a change in this parameter, even by a factor of 0.01, was always higher than 5%, denoting its sensitivity. A factor of 0.1 change in the parameter a of the length-weight relationship induced a variation of up to 10% in the Y/R. Changes in the von Bertalanffy growth parameters by a factor of 0.1 produced changes in Y/R of from 3% to 33.1% for L∞, from 1.9% to 19.2% for K, and from 0.4% to 3.9% for t0. Terminal fishing mortality (Fterm) was the parameter showing the lowest variation (0.1% – 0.7%) in Y/R, while changes in M by a factor of 0.1 implied a variation of Y/R lower than 4%.
0 150 300 450 600 750
0 5 10 15 20
Year
R
e
c
ru
it
m
e
n
t
Y/R B/R SSB/R
Factor = 1.25
8a
0 200 400 600 800 1000
0 5 10 15 20
Year
R
e
c
ru
it
m
e
n
t
Y/R B/R SSB/R
Factor = 0.75
8b
0 200 400 600 800 1000 1200 1400
0 5 10 15 20
Year
R
e
c
ru
it
m
e
n
t
Y/R B/R SSB/R
Factor = 0.57 (maximum)
8c
Fig. 8. Results of the simulation analysis under conditions of deterministic recruitment, using a Beverton and Holt’s stock-recruitment model, and changes in the factor of effort (f), for
0 100 200 300 400 500 600
0 5 10 15 20
Year
R
e
c
ru
it
m
e
n
t
Y/R Lower 95% Upper 95%
Factor = 1.25
0 200 400 600 800
0 5 10 15 20
Year
R
e
c
ru
it
m
e
n
t
B/R Lower 95% Upper 95%
Factor = 1.25
0 100 200 300 400 500 600
0 5 10 15 20
Year
R
e
c
ru
it
m
e
n
t
SSB/R Lower 95% Upper 95%
Factor = 1.25
Fig. 9. Results of the transition analysis under conditions of stochastic recruitment, using a Beverton and Holt's stock-recruitment model, and changes in the factor of effort (f) of
1.25, for yellowtail snapper, Lutjanus chrysurus, off
Pernambuco State, North-eastern Brazil, continental shelf (see text for details). Y/R – Yield-per-Recruit; B/R – Biomass-per-recruit; and SSB/R – Spawning stock biomass-per-recruit.
0 100 200 300 400 500 600 700
0 5 10 15 20
Year
R
e
c
ru
it
m
e
n
t
Y/R Lower 95% Upper 95%
Factor = 0.75
0 250 500 750 1000 1250 1500
0 5 10 15 20
Year
R
e
c
ru
it
m
e
n
t
B/R Lower 95% Upper 95%
Factor = 0.75
0 200 400 600 800 1000 1200 1400
0 5 10 15 20
Year
R
e
c
ru
it
m
e
n
t
SSB/R Lower 95% Upper 95%
Factor = 0.75
0 200 400 600 800
0 5 10 15 20
Year
R
e
c
ru
it
m
e
n
t
Y/R Lower 95% Upper 95%
Factor = 0.57 (maximum)
0 500 1000 1500 2000
0 5 10 15 20
Year
R
e
c
ru
it
m
e
n
t
B/R Lower 95% 1292,415
Factor = 0.57 (maximum)
0 300 600 900 1200 1500 1800
0 5 10 15 20
Year
R
e
c
ru
it
m
e
n
t
SSB/R Lower 95% Upper 95%
Factor = 0.57 (maximum)
Fig. 11. Results of the transition analysis under conditions of stochastic recruitment, using a Beverton and Holt's stock-recruitment model, and changes in the factor of effort (f) of 0.57 (maximum), for yellowtail snapper, Lutjanus chrysurus, off Pernambuco State, North-eastern Brazil, continental shelf (for details see text). Y/R – Yield-per-Recruit; B/R – Biomass-per-recruit; and SSB/R – Spawning stock biomass-per-recruit.
In the case of L. chrysurus, the sensitivity analysis showed that the most sensitive parameter was again b of the length-weight relationship, with variation in the Y/R between 68% and 178%, for a factor of 0.1. Variation in the yield-per-recruit analysis by a change in this parameter, even by a factor of 0.01, was always higher than 5%, denoting its sensitivity. A factor of 0.1 change in the parameter a of the length-weight relationship induced a variation of up to 10% in Y/R. Changes in the von Bertalanffy growth parameters by a factor of 0.1 produced changes in Y/R of from 2.8% to 33% for L∞, from 1.8% to 18.9% for
K, and from 0.3% to 3% for t0. Terminal fishing mortality (Fterm) was the parameter showing the lowest variation (0.01% – 0.09%) in Y/R, while changes in M by a factor of 0.1 implied a variation of Y/R lower than 4%.
D
ISCUSSIONAlthough concerned that further age and growth studies should be conducted, it seems that, from the results obtained, the method of size-frequency distribution fitted the analyzed stock sample well. The results obtained by Allen (1985), either for yellowtail snapper or for mutton snapper, are in accordance with the present results concerning length class distribution. Also Froese and Pauly (2003) report, from the work of various authors on both species derived from the Southeastern zone of Cuba, similar values for the von Bertalanffy’s growth
species closely related to the mutton snapper, found an L∞= 77.22 cm, K= 0.110 and t0= -3.73. Klippel et al. (2005) assessing the status of six lutjanid stocks caught on the eastern Brazilian coast found the following parameters, for yellowtail snapper and mutton snapper respectively: L∞= 78.5 cm and K= 0.156; and L∞= 99.8 cm and K= 0.133. From the previous analysis and if we compare other estimations of von Bertalanffy growth parameters, it may be observed that the asymptotic lengths (L∞) were very similar to those reported by other Brazilian studies for both species. On the other hand, the slightly higher value of K, for both species, found in the present study seems to be related to the presence of younger individuals in the sample, because it is known that younger fish present a higher growth rate.
As stressed by Lleonart and Salat (1997), the stationary condition applied to study stocks for the use of VIT software is clearly a very restrictive hypothesis because, in general, the population is not in equilibrium, as neither recruitment nor mortality is constant over time. Knowing the errors associated with accepting these hypotheses does not eliminate them, but does contribute to a well-founded interpretation of the results and produces an objective assessment of the population under study. Our analysis shows that combining a short data series with biological parameters from literature sources we can reconstruct an acceptable virtual population of two species of snapper, even if our initial estimates of F and M are not highly accurate. There is too little information on the rates of fishing (F) and natural (M) mortalities for snappers, in the literature consulted. For yellowtail snapper the rate of M for this species was estimated as 0.112; F was calculated to be 0.358; and the exploitation ratio, given by the relation between fishing and total mortalities (F/Z) was, thus, 0.76. For mutton snapper M was estimated to be 0.152; F was calculated to be 0.277; and the exploitation ratio was 0.53. It is well known that M is quite hard to estimate, and many factors – biological and/or ecological – may be involved in the natural mortality of any species of fish. Otherwise, F is directly dependent on the fishing effort (f) applied and its estimation, although straightforward, deserves attention but is highly specific to a particular fishery. Sensitivity analysis shows that the Y/R indicator is very sensitive to misspecification of the b parameter of the allometric curve, showing that a greater sampling endeavour needs to be made for the correct estimation of this parameter.
Small-scale coastal fisheries along the Pernambuco state coast (north-eastern Brazil) are highly diversified, including, as they do, different types of fleet, fishing gear and target species. Due to the large geographic area (ca. 1500 nm2) and the lack of government control and regulations, the monitoring
and management of these coastal fisheries is extremely difficult. Our results show that the main snapper stocks fished by the hand-line fleet off Pernambuco are slightly overexploited. This fishery would benefit from a reduction of effort, which would result in sustained yields over the long term and better stock health, as measured by the indicators SSB/R (spawning stock biomass-per-recruit) and B/R (biomass-per-recruit). Although the VPA analysis shows that L. analis would require a 16% decrease in effort and L. chrysurus a decrease of 43%, it is impractical to manage the two species separately. An increase of 25% in fishing effort would in all probability bring about a considerable decrease in SSB/R and B/R, with lower yields in the long run. Conversely, our proposal to reduce current effort levels by 25% is a compromise between the two values of effort reduction mentioned and would bring about a substantial increase in SSB/R and B/R levels, with a probability of 95%, while ensuring higher catches than at present with a probability of at least 60%. From the study conducted by Klippel et al. (2005) on six lutjanid stocks caught on the eastern Brazilian coast, through cohort analysis and the Thompson and Bell model of length composition, it was found that these stocks are overexploited, and concerning the two snappers species studied here, they reached similar conclusions to those presented in this study, i.e., that the stock of yellowtail snapper (L. chrysurus) is seriously overexploited; whilst mutton snapper (L. analis) exhibit moderate overexploitation.
It is a matter of concern that scientific information is insufficient and that lack of Brazilian government control makes it unrealistic to propose management measures based on size and effort restrictions, and as the goal is to protect stocks from overfishing, the Brazilian government should consider invoking the precautionary approach at any time to effectively protect the fish habitat, and consequently fishery resources. We agree with Frédou et al. (2006) when they say that to date in fisheries, there have been no studies of fishing activity or its impact that can assimilate the development of a management plan to underpin sustainable exploitation, but as mentioned by Rosenberg (2002), the politics of fishery management may be changing, even if slowly, and even if we have new scientific perspectives, we are still struggling to implement precautionary management nationally and internationally.
the level of recruits in changing effort factor conditions, either for increasing or decreasing factors, must indicate a close stock-recruitment relationship for both species. On the above cited mortality rates and exploitation ratio, the decreasing trend in catches must be the stocks´ response to such a high fishing effort level, which can be clearly evidenced by the estimated exploitation ratio. The diminishing return on effort means that destruction of the population is virtually impossible; the fishery can sustain a great amount of effort, but the resulting yield will be very low indeed. However, the small sample size may be insufficient to indicate the functional form of the stock-recruitment relationship.
Olavo et al. (2005) commented that bathymetric distribution of fishing effort of the line fisheries and the dynamics of the hook and line fishing fleets of Bahia State, operating off the central-eastern coast of Brazil, indicate that the outer continental shelf (30-80 m) and continental slope concentrate 73.2% of monitored trips and 76% of yearly effort due to the relatively higher abundance of reef species associated with such environments, mainly targeting snapper species such as the yellowtail snapper, mutton snapper and dog snapper, as well as pelagic species, due to the high yields attained, seemingly related to reproductive aggregation behavior. Martins et al. (2005) also commented that the hook and line motorized fleet based on the Espírito Santo State, located on the same central-eastern coast of Brazil, whose target species are those of the Lutjanus genus that inhabits the continental slope, and Costa et al. (2005) found that snappers (Lutjanidae) were the most abundant reef species group in the landings sampled (31.6 %), and that the yellowtail snapper was, among this group, the most abundant species in the sample landings. Costa et al. (2005) also found that the species of the Lutjanus genus inhabit a variety of depths on the continental slope. The yellowtail snapper is more abundant between 20 and 30 m, its abundance decreasing at greater depth, though it can still be found at 150 m; the mutton snapper (L. analis) between 60 m and 70 m; the dog snapper (L. jocu) is more abundant between 40 m and 50 m, and the vermillion snapper (L. vivanus) from 160 m to 170 m.
The preceding analysis seems to indicate that the yellowtail snapper, one of the smaller lutjanid species, is more frequent in shallower regions off Pernambuco continental shelf, thus being more vulnerable to the fishing effort applied, due to the accessibility of hand-liners to inshore fishing grounds, and the fishing gear utilised. The mutton snapper, on the other hand, a larger species, may inhabit deeper regions of the platform and the continental slope, whereas the young of this species may be more frequently found in shallower regions. Such stratified distribution has also been discussed by Frédou and
Ferreira (2005) for whom the catch of different Lutjanid species by the artisanal fleet must be related to the operation of the fleet, which varies from shallow to deep waters depending, amongst others factors, on environmental conditions, motorised or wind-driven boats, shelf width, trade winds, etc. Szedlmayer and Conti (1999) mentioned that age-0 red snapper used an inner shelf habitat for their first settlement, and a similar pattern of relationship between fish age and habitat depth was suggested by Bradley and Bryan (1975 apud Szedlmayer and Conti, 1999) for whom young red snapper, during summer months, sought deeper water as they grew older.
The application of steady-state VPA to two snapper stocks (L. analis and L. chrysurus) exploited by artisanal fleets along the Pernambuco coast showed that even a short-data series (1 year of sampling) can produce a useful diagnosis of fishery resources. By incorporating the results of VPA into a simulation framework, we can develop a comparison of the likely result of different policy options (effort regulation) based on 3 simple indicators (Spawning stock biomass-per-recruit, Biomass-per-recruit and Yield-per-recruit). Even while recognizing the difficulty of testing the assumptions introduced into our model (steady-state, Beverton and Holt recruitment model) and using standard fisheries analysis techniques, we show that guidance can be offered within a context of limited fishery data. Providing advice for the assessment of coastal fisheries is an urgent issue, given the high dependence of local communities on coastal living resources and the increasing fishing effort applied by a growing population.
A
CKNOWLEDGEMENTSWe would like to acknowledge the support of the Institut de Ciències del Mar – ICM/CSIC (Spain) and the Superintendência do Desenvolvimento do Nordeste – SUDENE (Brazil), as well as the fishermen of the Colônias dos Pescadores Z-25 (Jaboatão dos Guararapes, Pernambuco, Brazil) and Grupo de Apoio à Pesca – GAP for data collection.
R
EFERENCESALEGRIA, J. R. C., MENEZES, M. F. Edad y crecimento del ariacó, Lutjanus synagris (Linnaeus), en el nordeste
del Brasil. Arq. Ciênc. Mar, Universidade Federal do
Ceará, , v. 10, n. 1, p. 65- 68, 1970.
CALADO NETO, A. V.; SILVA, A. L. N.; MATTOS, S. M. G. Aspecto da dinâmica populacional da guaiúba,
Ocyurus chrysurus (Bloch, 1791) do litoral do Estado de Pernambuco. Bolm técn. Cient. CEPENE, v. 5, n. 1, p. 73-87, 1997.
CARVALHO FILHO, A. Peixes: costa brasileira. São Paulo,
Editora Metro, 1999. 320 p.
COSTA, P. A. S.; OLAVO, G.; MARTINS, A. S. Áreas de pesca e rendimentos da frota de linheiros na região central da costa brasileira entre Salvador-BA e o Cabo de São Tomé-RJ. In: COSTA, P.A.S.; MARTINS, A. S.; OLAVO, G. (Ed.). Pesca e potenciais de exploraçãode recursos vivos na região central da Zona Econômica Exclusiva brasileira. Rio de Janeiro: Museu Nacional, 2005. p. 57-70. (Série Livros n.13).
DIEDHIOU M.; FERREIRA B. P.; REZENDE S. M. Idade e crescimento da Guaiúba, Lutjanus chrysurus (Bloch
1791), na Costa Nordeste do Brasil. Arq. Ciênc. Mar, Universidade Federal do Ceará, v. 37, p. 39-52, 2004. FAO. Code of conduct for responsible fisheries. Rome, 1995.
41 p.
FREDOU, T.; FERREIRA, B. P. Bathymetric trends of northeastern Brazilian snappers (Pisces, Lutjanidae): implications for the reef fishery dynamic. Braz. Arch.
Biol. Technol., v. 48, n. 5, p. 787-800, 2005.
FRÉDOU, T.; FERREIRA, B. P.; LETOURNEUR, Y. A univariate and multivariate study of reef fisheries off northeastern Brazil. ICES J. mar. Sci., v. 63, p. 883-896, 2006.
FROESE, R.; PAULY, D. (Ed.). FishBase. World Wide Web electronic publication, 2003. < www.fishbase.org.> GAYANILO Jr.; F. C.; SPARRE, P.; PAULY, D. FAO and
ICLARM Stock Assessment Tool (FISAT II). FAO
Computerised Information Series, 2002. Online User Guide.
GULLAND, J. A. Manual of methods for fish stock assessment. Part 1. Fish population analysis. Roma: FAO
Manuals in Fisheries Science, n. 4, 1969. 154 p.
IBAMA. Boletim Estatístico da Pesca Marítima e Estuarina do Estado de Pernambuco.Tamandaré, PE: CEPENE, 2003.
IBAMA. Boletim Estatístico da Pesca Marítima e Estuarina do Estado de Pernambuco. Tamandaré: CEPENE, 2007.
KLIPPEL, S.; OLAVO, G.; COSTA, P. A. S.; MARTINS, A. S.; PERES, M. B. Avaliação dos estoques de lutjanídeos da costa central do Brasil: análise de coortes e modelo preditivo de Thompson e Bell para comprimentos.In: COSTA, P.A.S.; MARTINS, A. S.; OLAVO, G. (Ed.).
Pesca e potenciais de exploração de recursos vivos na região central da Zona Econômica Exclusiva brasileira. Rio de Janeiro: Museu Nacional, 2005. p.
83-98 (Série Livros n.13).
LEITE JR., N. O.; MARTINS, A. S.; ARAÚJO, J. N. Idade e crescimento de peixes recifais na região central da Zona Econômica Exclusiva entre Salvador-BA e o Cabo de São Tomé-RJ (13°S a 22°S). In: COSTA, P.A.S.; MARTINS, A. S.; OLAVO, G. (Ed.). Pesca e potenciais de exploração de recursos vivos na região central daZona Econômica Exclusiva brasileira. Rio de Janeiro: Museu Nacional, 2005. p. 203-216.(Série Livros n.13).
LIMA, W. B. 2004. Idade e crescimento do ariacó,
Lutjanus synagris, da costa norte da Bahia.
(Monografia) – Programa de Graduação em Oceanografia, Universidade Federal do Espírito Santo, Vitória, 2004.
LLEONART, J.; SALAT, J. 1997. VIT: Software for fishery analysis – User’s manual. FAO Computerized Information
Series – Fisheries, n. 11, 1997. 110 p.
MARTINS, A. S.; OLAVO, G.; COSTA, P. A. S. A pesca de linha de alto mar realizada por frotas sediadas no Espírito Santo, Brasil. In: COSTA, P.A.S.; MARTINS, A. S.; OLAVO, G. (Ed.). Pesca e potenciais de exploração de recursos vivos na região central daZonaEconômica Exclusiva brasileira. Rio de Janeiro: Museu Nacional, 2005. p.35-55. (Série Livros n.13).
MATTOS, S. M. G. A bioeconomic analysis of the coastal fishery of Pernambuco State, North-eastern Brazil. Ph.D. Thesis, Universitat Politècnica de Catalunya, Barcelona, 2004.
MATTOS, S. M. G.; MAYNOU, F.; FRANQUESA., R. A bio-economic analysis of the hand-line and gillnet coastal fisheries of Pernambuco State, north-eastern Brazil. Scient. Mar., v. 70, n. 2, p. 335-346, 2006. OLAVO, G.; COSTA, P. A. S.; MARTINS, A. S.
Caracterização da pesca de linha e dinâmica das frotas linheiras da Bahia, Brasil. In: COSTA, P.A.S.; MARTINS, A. S.; OLAVO, G. (Ed.). Pesca e potenciais de exploração de recursos vivos na região central da Zona Econômica Exclusiva brasileira. Rio de Janeiro: Museu Nacional, 2005. p. 13-34 (Série Livros n.13) PERRINGS, C. Sustainability indicators for fisheries in
integrated coastal area management. Mar. Freshwater Res., v. 51: 513-522, 2000.
REZENDE S. M.; FERREIRA B. P. Age, growth and mortality of dog snapper Lutjanus jocu (Bloch & Schneider 1801) in the northeast coast of Brazil. Submitted Braz. J. Oceanogr.
SPARRE, P.; URSIN, E.; VENEMA, S. C. Introduction to tropical fish stock assessment. Part 1. FAO Fish. tech. Pap., n. 306/1, 1989. 404 p. Manual.
SZEDLMAYER, S. T.; CONTI, J. Nursery habitats, growth rates, and seasonality of age-0 red snapper, Lutjanus campechanus, in the northeast Gulf of Mexico. Fish. Bull., v. 97:626–635, 1999.
TEIXEIRA, S. F.; FERREIRA, B. P.; PADOVAN, I. Aspects of fishing and reproduction of the black grouper Mycteroperca bonaci (Poey, 1860) (Serranidae:.
Neotrop. Ichthyol., Brasil, v. 2, n. 1, p. 1-44, 2004. WILLMANN, R.; GARCÍA, S. M. 1986. Modelo
bioeconómico para el análisis de pesquerías secuenciales artesanales e industriales de camarón tropical. FAO Doc. técn. Pesca, n. 270, 47 p., 1986.