Quim. Nova, Vol. 34, No. 8, 1405-1408, 2011
Ar
ti
go
*e-mail: [email protected]
DETERMINATION OF CINNAMIC ACID IN HUMAN URINE BY FLOW INJECTION CHEMILUMINESCENCE
Xuemei Fan*, Shumin Wang, Zhikui Su, Fengying Chen, Yanfeng Liu and Ping Liu
Department of Chemistry and Chemical Engineering, Shuoluo University, Shuoluo 726000, P. R. China Xingwang Zheng
School of Chemistry and Material Science, Shaanxi Normal University, Xi’an 710062, P. R. China Fengling Cui
College of Chemistry and Environment Science of Henan Normal University, Xinxiang 453007, P. R. China
Recebido em 21/2/11; aceito em 11/4/11; publicado na web em 10/6/11
It was found that cinnamic acid can react with potassium permanganate in the acidic medium and produce chemiluminescence, which was greatly enhanced by glyoxal. Under the optimum conditions, the linear range for the determination of cinnamic acid was 1.0×10⁻⁸
to 1.0×10⁻⁴ mol L-1 with a detection limit of 8.0×10⁻⁹ mol L-1, the relative standard deviation was 1.7% for 2.0×10⁻⁶ mol L-1 cinnamic
acid solution in nine repeated measurements. This method was found to be novel、simple、fast and sensitive, it was successfully applied to the determination of cinnamic acid in human urine. Furthermore, the possible reaction mechanism was also discussed. Keywords: low injection chemiluminescence; potassium permanganate; cinnamic acid.
INTRODUCTION
Cinnamic acid is an important substance because it is widely used in perfume, food, photographic, polymer and pharmaceutical industries, as well as for clinical and toxicological Studies.1 Until
now, many methods have been reported for its determination, such as titrimetry,2,3 differential-pulse polarography,4 spectrophotometry,5
mass spectrometry,6 HPLC,7 electrokinetic capillary
chromatogra-phy,8 capillary electrophoresis,9 gas chromatography10 and liquid
chromatography11. However, there are many disadvantages over
these methods, such as long-response time, reagent consumption, complicated operation, etc.12
Chemiluminescence (CL) is deined as the emission of electro-magnetic radiation (usually in the visible or near-infrared region) produced by a chemical reaction. Since the appearance of the highly sensitive photomultiplier tube in the 1950s, CL has been known as a powerful and important analytical technique for its advantages such as higher sensitivity, lower detection limits, wider linear ranges and simpler instrument (no excitation light source and no spectroscope).13
Though the CL have many advantages, normally the amount of energy released during a chemical reaction dissipates as heat, therefore the chemiluminescence reagents having been investigated was limited. At present, the chemiluminescence reagents named luminol,14-16
lucigen,17,18 peroxidate,19 tris(2,2,-bipyridyl)ruthenium(II)20,21 and
potassium permanganate22-25 have been widely used in analytical
chemistry. Up until now, only one article had been published for the determination of cinnamic acid by CL method, and it was based on Ru(bipy)32+-KMnO
4 System.
26 However, this method needed
expensive reagent, furthermore, the linear ranges was narrower. Consequently, development of a more novel CL detection procedure for cinnamic acid analysis should be of interest.
In our laboratory, glyoxal was found to enhance the CL emission intensity by the reaction of cinnamic acid with KMnO4 in sulfuric acid
medium. Based on this reaction, we developed a novel low injection
chemiluminescence method for the determination of cinnamic acid. Compared with the previous reported chemiluminescence method, the present method was inexpensive, sensitive and showed wider calibration ranges. Furthermore, the possible reaction mechanism was also discussed in this paper.
EXPERIMENTAL
Apparatus
The IFFM-E low injection CL analyzer (Xi’an Remex Electronic Instrument High-Tech Ltd., China) was equipped with an automatic injection system and a detection system. The schematic diagram of the CL low system employed was shown in Figure 1. PTFE tube (0.8 mm i.d.) was used to connect all of the components in the low system. The photomultiplier tube was operated at -600 V, the low cell was a coil of glass tube that was positioned in front of the detection window of the PMT. The CL signal was treated with a personal computer. Reagents
All chemical reagents were of analytical grade and were pur-chased from Xi’an Chemical Reagent Factory(Xi’an, China). All solutions were made in ultrapure water puriied in a Milli-Q system (Millipore, Sartorius, Germany).
The stock standard solution (1.00×10⁻³ mol L-1) of cinnamic acid
was prepared by dissolving 0.0148 g cinnamic acid in water. Potas-sium permanganate stock solution (1.0×10⁻² mol L-1) was prepared
by dissolving potassium permanganate in water. Working solutions were prepared by appropriate dilution of stock solution with water before use. glyoxal solution (4%, v/v) was prepared in water. Analytical procedures
As shown in Figure 1, at irst, the reagent stream KMnO4 solution
Fan et al.
1406 Quim. Nova
then, the mixture was injected into glyoxal solution. At last, the mixed solution was transferred into CL cell, and the CL signal I which was proportional to the concentration of corresponding cinnamic acid was recorded.
RESULTS AND DISCUSSION
Kinetic curves of CL reaction
The kinetic curve was tested with a static system in the absence and presence of glyoxal, the typical CL kinetic curve was shown in Figure 2. It can be seen that the CL reaction of cinnamic acid and KMnO4 in sulfuric acid solution was so rapid that the CL intensity
reached a maximum at 1.1 s. It was also indicated that the CL intensity greatly enhanced in the presence of glyoxal.
Optimization of experimental conditions
Analytical procedure
KMnO4 act only as the oxidant for the determination of cinnamic
acid in this CL system. In order to achieve the optimum procedure of determination, two analytical procedures (Figure 1) were investiga-ted. Under the same conditions, we found that the former obtained the greater CL emission intensity than the latter. Therefore, the 1.1 procedure was used subsequently in this study.
Effect of acid type and concentration
It was observed that the CL signal of KMnO4–cinnamic acid
system was stronger in acid solution than in neutral or basic solu-tion. Four different acids of different concentrations were used as the mediums, the results were shown in Table 1. The results showed maximum CL intensity was obtained with 0.05 mol L-1 H
2SO4. The
effect of H2SO4 concentration on the CL intensity of this system was
shown in Figure 3.
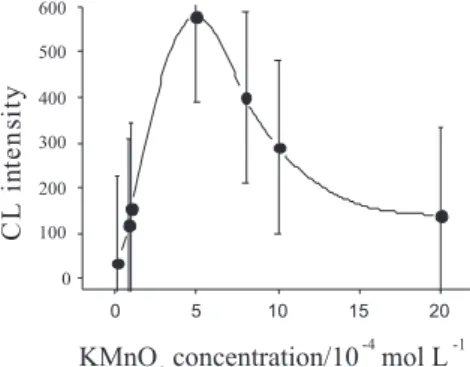
Effect of KMnO4 concentration
KMnO4 is the important oxidant for the determination of
cinna-mic acid in this CL system. In order to investigate the effect of the concentration of KMnO4 on the CL intensity. The effect of 1.0×10
-5
to 1.0×10⁻³ mol L-1 KMnO
4 was examined, and the results was shown
in Figure 4. It can be observed that the CL intensity increased with increasing KMnO4 concentration up to 5.0×10
-4 mol L-1. Larger
con-centration of KMnO4 could lower the CL intensity. Thus, 5.0×10 -4
mol L-1 KMnO
4 was used in the work.
Effect of glyoxal concentration
The primary investigation found that glyoxal could enhance the CL intensity of cinnamic acid with KMnO4 in acidic medium.
The effect of the concentration of glyoxalon the CL intensity was studied in the range of 0.5-10% and the result was shown in Figure 5. It showed that the CL intensity increased with increasing glyoxal concentration up to 4% (V/V). When the concentration of glyoxal continued increasing, the CL intensity keeped constant basically.Therefore, 4% (V/V) glyoxal was used in subsequent experiments.
Figure1. Schematic diagram of the low injection analysis. P: peristaltic pump; V: six-way valve; F: low cell; PMT: photomultiplier; HV: high volt-age; W: waste; R: recorder
Figure 2. Kinetic curves of chemiluminescence systems. Curve 1: 1 mL 5×10⁻⁴
mol L-1 KMnO
4; 1 mL 0.05 mol L
-1 H
2SO4 ; 1 mL 4.5×10
-5 mol L-1 cinnamic
acid. Curve 2: Curve 1 + 1 mL 4%(V:V) glyoxal
Table 1. Effect of medium on the CL intensity
Media Maximum CL intensity Optimum concentration ( mol L-1)
HCl 490 1
H2SO4 578 0.05
H3PO4 170 1.5
HNO3 370 1.5
Figure 3. Effect of H2SO4 concentration on the CL intensity. Conditions:
KMnO4 5×10
-4 mol L-1; glyoxal 4%(V:V); cinnamic acid 2.2×10⁻⁵ mol L-1;
low rates of peristaltic pump P1 3.5 mL min
-1; low rates of peristaltic pump
Determination of cinnamic acid in human urine by low injection chemiluminescence 1407 Vol. 34, No. 8
Effect of surfactants
The effect of some surfactants (non-ionic PEG, cationic CTMAB and anionic SDBS) on the CL intensity was tested. The results showed that SDBS lowered the CL intensity about for seven times, CTMAB and PEG had no effect on the analytical signal. Therefore, these surfactants were not used for the further work.
Effect of low rate
The low rates of peristaltic pump P1 and P2 were investigated. It
was found that the CL intensity increased with increasing the low rate of P1 and the CL intensity reached the maximum at 3.5 mL min
-1
and then keeped constant. The CL intensity also increased with the
increasing low rate of P2 and the CL intensity reached the maximum
at 2.0 mL min-1. So 3.5 and 2.0 mL min-1 were, respectively, selected
for the low rates of P1 and P2.
Linear response range, detection limit and precision
Under the above optimum conditions, the CL intensity versus cinnamic acid concentration was measured. The regression equation, correlation coeficients and the detection limit were summarized in Table 2. The reproducibility was examined using 2.0×10⁻⁶ mol L-1
cinnamic acid (n = 9) and the relative standard deviation was 1.7 %. Interference
Under the selected experimental conditions, the interference tests of some foreign species were performed. The results showed that 1000-fold K+, Na+, NO
3
-, EDTA, 800-fold Zn2+, Ca2+, Cd2+, Al3+, Mg2+,
Ni2+, Pb2+, Ba2+, NH 4
+, CO
3
2−, SO
4
2−, PO
4
3−, 500-fold Cl−, Fe2+, Cu2+,
Cr3+, Fe3+, Co2+, starch, fructose glucose, lactose, 100-fold urea, uric
acid, 50-fold methanol, ethanol and two fold ascorbic acid were not interfered with the determination of 2.0×10⁻⁶ mol L-1 cinnamic acid
at the conidence level of 95%. So, the method had a high selectivity. Application
The human urine sample was obtained from a healthy person and the proposed method was directly applied to the determination of cinnamic acid in human urine without any retreatment. In order to decrease the background of the determination, the sample was diluted for 25-fold. The spiked samples were prepared by mixing the standard and the diluted sample. By this method, the determination results (Table 3) were close to those obtained by the LC methods.27
Compared with the previous reported method for the determination of cinnamic acid, the advantages of using the present method had a good reproducibility and sensitivity.
Possible reaction mechanism
It was reported that KMnO4 could react with some reductants in
the presence of formaldehyde to produce1O 2
1O 2(
1g1g), a complex
oxygen molecule of single state, which could transform into 3O 2(
3g),
a triplet state oxygen. During the transformation, it could produce CL and the formaldehyde could accelerate oxidation reaction rate.28
Thus, the cinnamic acid could also react with KMnO4 to produce CL
and the CL reaction could be accelerated by glyoxal.
Based on the above discussions, the possible reaction mechanism was suggested as following:
Figure 4. Effect of KMnO4 concentration on the CL intensity. Conditions:
H2SO4 0.05 mol L
-1; glyoxal 4%; cinnamic acid 2.2×10⁻⁵ mol L-1; low rates of
peristaltic pump P1 3.5 mL min
-1; low rates of peristaltic pump P
2 2.0 mL min -1
Figure 5. Effect of glyoxal concentration on the CL intensity. Conditions: KMnO4 5×10
-4 mol L-1; H
2SO4 0.05 mol L
-1; cinnamic acid 2.2×10⁻⁵ mol L-1;
low rates of peristaltic pump P1 3.5 mL min
-1; low rates of peristaltic pump
P2 2.0 mL min -1
Table 2. Analytical parameters for the determination of cinnamic acid
Mem Detection Line range (mol L-1) Regression equation, C (mol L-1) Correlation coeficient
limit (mol L-1)
1.0×10⁻⁸
~1.0×10⁻⁵ I = 90.61+0.605×10⁷C 0.9992 1.0×10⁻⁵
~1.0×10⁻⁴ I = -177.46 +340.64×10⁵C 0.9989 8.0×10⁻⁹ mol L-1 I is the CL intensity and C is the concentration.
Table 3. The result of recovery (n = 7)
Sample Added/µM Found/µM RSD/
﹪ Relative difference
(CL-LC %) Recovered/﹪ CL method LC method
Urine 4.00 4.35 4.28 3.0 1.63 108.8
(Dilute 25 fold) 6.00 6.87 6.65 2.7 3.31 114.5
Fan et al.
1408 Quim. Nova
MnO4- + glyoxal + H+ + cinnamic acid →1O2 (1∆g)+ Mn(II-IV) +H2O
+ products
21O 2 (
1∆g)→1O
2 1O
2(
1∆g1∆g) 1O 2
1O 2(
1∆g1∆g)→23O 2(
3Σg) + hν
CONCLUSION
A novel low injection analysis method has been proposed, it was based on that cinnamic acid can react with potassium permanganate in the acidic medium and produce chemiluminescence, which was greatly enhanced by glyoxal. Comparing to the previous methods for determination of cinnamic acid, the proposed method showed its advantages in simplicity, sensitivity, selectivity and avoided expen-sive reagent consumption. This method was successfully used in the determination of cinnamic acid in human urine.
ACKNOWLEDGEMENTS
This project was inancially supported by the Science Founda-tion of Shuoluo College, P. R. China (No. 10SKY015) and NaFounda-tional Natural Science Foundation of China (No. 30970696).
REFERENCES
1. Grayson, M.; Encyclopedia of Chemical Technology, Wiley: New York, 1981.
2. Majer, J. R.; Ellis, M; Anal. Chim. Acta1984, 165, 237.
3. Chinese Pharmacopoeia, People Hygiene Press : Beijing, 1995, chap. 2.
4. Ferreira, V. S.; Melios, C. B.; Zanoni, M. V.; Stradiotto, N. R.; Analyst 1996, 121, 263.
5. Bounias, M.; Daurade, M. H.; Lizzi, Y.; Analysis 1989, 17, 201. 6. Zhang, J.; Chen, M.; Ju, W. Z.; Liu, S. J.; Xu, M. J.; Chu, J. H.; Wu, T.;
J. Pharm. Biomed. Anal.2010, 51, 685.
7. Sladkovský, R.; Solich, P.; Opletal, L.; J. Pharm. Biomed. Anal. 2001, 24, 1049.
8. Lu, Y.; Wu, C.; Yuan, Z.; Fitoterapia2004, 75, 267.
9. Li, L. J.; Feng, J.; Chen, W.; Chinese J. Anal. Chem. 2007, 35, 401. 10. Biemer, T. A.; Asral, N.; Albanese, J. A.; J. Chromatogr. 1992, 623, 395. 11. Cheng, J.; Li, Y. S.; Roberts, R. L.; Walker, G.; Talanta1997, 44, 1807. 12. Qu, P.; Yan, S. C.; Lu, H.; Lu, Z. H.; Microchim. Acta2008, 163, 321. 13. Li, B. X.; Guo, L. L.; Xu, C. L.; Ma, L. M.; Spectrochim. Acta, Part A
2008, 71, 892.
14. Lu, J. Q.; He, W. W.; Zhou, X. W.; Chin. Chem. Lett. 2006, 17, 1233. 15. Ensai, A. A.; Khayamian, T.; Hasanpour, F.; J. Pharm. Biomed. Anal.
2008, 48, 140.
16. Nalewajko, E.; Wiszowata, A.; Kojło, A.; J. Pharm. Biomed. Anal. 2007, 43, 1673.
17. Uketa, H.; Sarker, A. K.; Kawana, D.; Sawamura, M.; Anal. Chim. Acta 2001, 438, 137.
18. Afanasev, I. B.; Ostrakhovitch, E. A.; Mikhalchik, E. V. M.; Korkina, L. G.; Luminescence2001, 16, 305.
19. Nakashima, K.; Kawaguehi, S.; Givens, R. S.; Anal. Sci. 1990, 6, 833. 20. Anastos, N.; Barnett, N. W.; Lewis, S. W.; Gathergood, N. S. J.;
NoelSims, D.; Talanta2005, 67, 354.
21. Gorman, B. A.; Barnett, N. W.; Anal. Chim. Acta2005, 541, 119. 22. Barnett, N. W.; Hindson, B. J.; Jones, P.; Smith, T. A.; Anal. Chim. Acta
2002, 451, 181.
23. Zhuang, Y. F.; Song, H. L.; J. Pharm. Biomed. Anal. 2007, 44, 824. 24. Li, L. N.; Li, N. B.; Luo, H. Q.; Anal. Sci. 2005, 21, 963.
25. Zhang, D. Y.; Ma, Y. J.; Zhou, M.; Li, L.; Chen, H.; Anal. Sci.2006, 22, 183.
26. Han, H. Y.; He, Z. K.; Zeng, Y. E.; Anal. Chim. Acta1999, 402, 113. 27. Luo, G. M.; Yang, W. L.; Lai, X. W.; Xie, S. X.; Liu, X. W.; YaowuFenxi
Zazhi1996, 16, 338.