Introduction
Methyldopa (α-methyl-3, 4-dihydrox-yphenylalanine), whose structure is shown in Figure 1, is a cathecolamine derivative widely used in the control of moderate and severe arteri-al hypertension. Methyldopa is considered a pro-drug since it acts mainly due to its metabolism in the central nervous system to α -methylnorepi-nephrine, a α2-adrenergic agonist [1].
Several methods have been proposed to quantify methyldopa in pharmaceutical formula-tions, including high-performance liquid
chro-www.scielo.br/eq www.ecletica.iq.unesp.br
Volume 33, número 3, 2008
A simple spectrophotometric method for the determination of
methyldopa using p-chloranil in the presence of Hydrogen
Peroxide
M. A. Gotardo, L. S. Lima, R. Sequinel, J. L. Rufino, L. Pezza, H. R. Pezza*
São Paulo State University - UNESP, Chemistry Institute of Araraquara, P.O. Box 355, 14801-970, Araraquara, SP, Brazil
Abstract: A simple, rapid and sensitive spectrophotometric method has been developed for the deter-mination of methyldopa in pharmaceutical formulations. The method is based on the reaction between tetrachloro-p-benzoquinone (p-chloranil) and methyldopa, accelerated by hydrogen peroxide (H2O2), producing a violet-red compound (λmax = 535 nm) at ambient temperature (25.0 ± 0.2 0C). Experimental design methodologies were used to optimize the measurement conditions. Beer’s law is obeyed in a concentration range from 2.10 x 10⁻⁴to 2.48 x 10⁻³mol L-1(r = 0.9997). The limit of detec-tion was 7.55 x 10⁻⁶mol L-1and the limit of quantification was 2.52 x 10⁻⁵mol L-1. The intraday pre-cision and interday prepre-cision were studied for 10 replicate analyses of 1.59 x 10⁻³mol L-1methyldopa solution and the respective coefficients of variation were 0.7 and 1.1 %. The proposed method was suc-cessfully applied to the determination of methyldopa in commercial brands of pharmaceuticals. No interferences were observed from the common excipients in the formulations. The results obtained by the proposed method were favorably compared with those given by the Brazilian Pharmacopoeia pro-cedure at 95 % confidence level.
Keywords:spectrophotometry; p-chloranil; hydrogen peroxide; methyldopa; pharmaceutical formulations.
Figure 1. Chemical structure of methyldopa.
Molecular absorption spectrophotometry is by far the instrumental technique of choice in indus-trial laboratories, owing mainly to its simplicity, often demanding low-cost equipment and lending itself to easy automation of trace analysis proce-dures. As already mentioned, a number of UV/visi-ble spectrophotometric methods for methyldopa determination have been reported. The visible spec-trophotometric method recommended by the Brazilian Pharmacopeia for methyldopa tablets is based on the reaction with ferrous tartarate at pH 8.5 [11]. Other visible spectrophotometric methods involve the employment of diverse chromogenic reagents such as N-bromosuccinimide and isoniazid [12], barbituric acid [13], sodium nitroprusside in the presence of hydroxylamine hydrochloride [12], peri-odate in acidic medium [14], diazotized sulphanil-amide in the presence of molybdate ions in acidic medium [15], p-dimethylaminocinnamaldehyde [16], vanillin in alkaline medium [17], cerium (IV) nitrate [18], ferric chloride in acidic medium [19], iron(III) in the presence of 1,10-phenanthroline and 2,2’-bipyridyl [20]. The methods by FIA with spec-trophotometric detection involve the use of p -tolui-dine and sodium periodate [21], metaperiodate [22],
p-aminophenol in alkaline medium [23] and ammo-nium molybdate [24] as chromogenic reagents. Nevertheless, most of the aforementioned methods present some limitations and drawbacks such as low selectivity [9], long waiting time for the color devel-opment [17,18], or heating step [9,13,18,22]. Still, there is in the literature a spectrophotometric method for the determination of methyldopa in pharmaceu-tical formulations using p-chloranil [10]. However, this method that is based on UV absorption (358 nm) shows problems related to low selectivity and requires a tedious heating step (30 minutes).
According to above considerations, the need for a simple, fast, low-cost, and selective method for determination of methyldopa seems clear. The method described in this paper is based on the reac-tion between methyldopa and tetrachloro-p-benzo-quinone (p-chloranil), accelerated by hydrogen per-oxide, yielding a violet-red compound (λmax = 535 nm) at ambient temperature (25.0 ±0.2°C). This work proposes the employment of H2O2 as a good strategy to accelerate the previously mentioned reaction. In this case, the heating step is not required. In addition, the reaction conditions were studied by experimental design approaches in order to optimize the analytical response.
The analytical results obtained by apply-ing the proposed method are trustworthy when compared with those given by Brazilian Pharmacopeia standard procedure.
Experimental
Apparatus
The absorbance measurements for the pro-posed method and for the standard method were performed using a portable UV/VIS spectropho-tometer (USB 4000 model – Ocean Optics); with wavelength range work 200 – 850 nm and equipped with a cell of 10 mm path length. Software OOI Base 32 (Ocean Optics) was used for acquisition and storage of the spectral data.
Materials
Pharmaceutical formulations (tablets) of four commercial brands were analyzed. These tablets were purchased from local drugstores and all were tested prior to the listed expiration date. All studied pharmaceuticals were package labeled to contain 250 mg of methyldopa per tablet.
The excipients used in the interference study were of pharmaceutical grade.
Reagents and solutions
All reagents and solvents employed were of analytical grade. Acetone, methanol (Mallinckrodt, Xalostoc, Mexico) were used. p-Choranil (Sigma, St Louis, E.U.A.) was used to prepare a 4.07 x 10⁻² mol L-1(1.0%, w/v) solution in acetone. A 4.55 mol L-1 hydrogen peroxide solution was prepared by appropriate dilution of H2O2 30% (w/w) (Merck, Darmstadt, Germany) in methanol and standardized by permanganometric titration, according to the procedure described in the literature [25]. A stock standard solution of methyldopa (Henrifarma – São Paulo, Brazil, purity grade > 99.8%) in methanol was prepared at 1.68 x 10⁻²mol L-1and working solutions were prepared by convenient dilutions with methanol. All solutions were daily prepared.
Preparation of the analytical curve
of H2O2(4.55 mol L-1) were added. The final vol-ume was completed to 5.00 mL with methanol. The absorbance measurements were carried out at 535 nm against reagents blank. The analytical curve was obtained by plotting absorbance values versus methyldopa concentration in mol L-1.
Analysis of pharmaceutical formulations (tablets)
Twenty tablets of each commercial phar-maceutical brand to be studied were weighed and finely powdered. A portion of this powder, equiv-alent to c.a. 100 mg of methyldopa, was accu-rately weighed. The sample was shaking with methanol in a magnetic mixer for 10 min and transferred into a 25 mL volumetric flask and the volume completed with methanol. The solution was filtered in Whatman 41 filter paper and an aliquot from this filtered solution was analyzed according to the procedure described in the preparation of the analytical curve.
Results and discussion
p-Chloranil has been used as chromogenic reagent for the determination of several drugs, such as fluoxetine and sertraline [26,27], paroxetine[27], salbutamol [28], nortriptyline [29], tranquillizers and antidepressants [30], trimetazidine dihy-drochloride [31], b-adrenergic blockers [32], dicy-clomine hydrochloride [33], omeprazole [34], iso-prenaline and methyldopa [10]. These methods are based on the interaction between electrons donors (drugs) and p-chloranil, which acts as an electron acceptor producing intensely colored charge trans-fer complexes (Scheme 1) [35].
Scheme 1. Chemical structure of methyldopa.
In order to develop a simple procedure, the proposed method used the reaction between methyldopa and p-chloranil, which was marked-ly accelerated in the presence of H2O2. This reac-tion produced a colored compound at ambient temperature (25.0 ± 0.2°C) and the absorbance measurements were carried out at 535 nm.
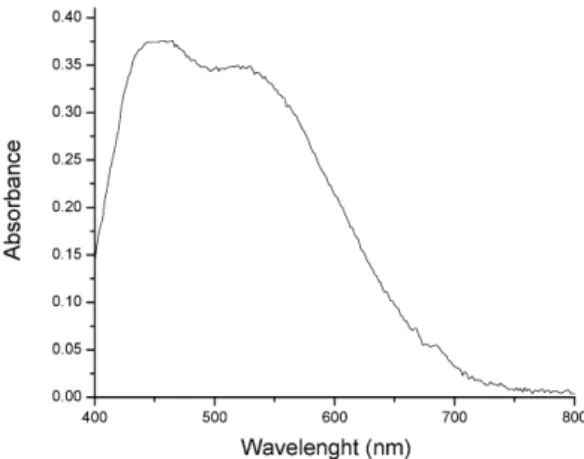
Figure 2 shows the absorption spectrum of the product of the reaction between methyldopa and
p-chloranil in the presence of H2O2. As it can be noted (Figure 2), the spectrum exhibits large bands, which are characteristic of charge transfer complex-es [35]. It should be also observed in Figure 2 that the spectrum exhibits a maximum absorption band at 535 nm and another at 535 nm.
The study of the optical stability reveals that the colored complex is stable at least 60 min at 435 nm. It is important to emphasizes that in the absence of H2O2 the reaction was extremely slow and the product was not stable.
Figure 2. Absorption spectrum of the product of the reaction between methyldopa and p-chloranil in the presence of H2O2. The analytical wavelength was 535 nm. Methyldopa solution was at 1.07 x 10⁻³mol
L-1, optical path = 1 cm.
p-Chloranil has been also used to detect methyldopa in pharmaceutical formulations on thin-layer [36]. As aforementioned, a spectropho-tometric method for the determination of methyl-dopa using p-chloranil as chromogenic reagent [10] shows problems related with the low selec-tivity, requires a tedious heating step (30 min-utes) and involve various manipulation steps.
Experimental design
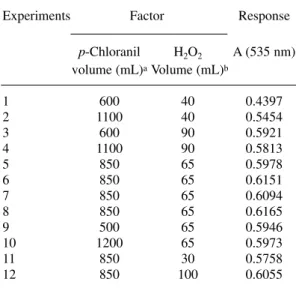
In order to investigate the best conditions for the reaction between p-chloranil and methyl-dopa in the presence of H2O2 an experimental design using central composite design was employed.
Central composite design allowed study-ing simultaneously the two factors that could have an important effect on the reaction. The fac-tors of interest were p-chloranil and H2O2 con-centration. To study these factors, aliquots were taken of the 4.07 x 10⁻²mol L-1 p-chloranil solu-tion and 4.55 mol L-1 H
2O2 solution, respectively. Table 1 shows the equivalent matrix of the cen-tral composite design as well as the absorbance data. The experiment corresponding to the cen-tral point was carried out in four replicates. All experiments were carried out with solution of methyldopa set at 1.59 x 10⁻³mol L-1.
Table 1.Matrix and results from of the central com-posite design.
Experiments Factor Response
p-Chloranil H2O2 A (535 nm)
volume (mL)aVolume (mL)b
1 600 40 0.4397
2 1100 40 0.5454
3 600 90 0.5921
4 1100 90 0.5813
5 850 65 0.5978
6 850 65 0.6151
7 850 65 0.6094
8 850 65 0.6165
9 500 65 0.5946
10 1200 65 0.5973
11 850 30 0.5758
12 850 100 0.6055
a p-Chloranil solution at 4.07 x 10⁻²mol L-1.
bH
2O2solution at 4.55 mol L-1.
Figure 3. Response surface of quadratic model for absorbance values as a function of p-chloranil vol-ume and H2O2volume.
The quadratic regression model is given by:
Z=0.177376+0.000965x+0.009891y-0.000037y2 (1)
where, Z is the response factor corresponding to the absorbance value. The factors x and y are the p -chloranil volume and H2O2 volume, respectively. The coefficient value of x2 factor as well as the coefficients of the interactions of the factors were very small and for this reason they were not shown. It can be observed by the surface shape (Figure 3) that the optimal region was found and that the maximum responses were achieved with 770 µL of p-chloranil solution and 85 µL of H2O2.
Analytical characteristics
The proposed analytical method was vali-dated by evaluating linear dynamic range, preci-sion, limit of detection (LOD), and limit of quan-tification(LOQ). Under the described experimen-tal conditions Beer’s law is obeyed in the concen-tration range from 2.10 x 10⁻⁴to 2.48 x 10⁻³mol L-1 (50 - 590 mg mL-1), with a correlation coeffi-cient of 0.9997. The absorbance values for this concentration range were adjusted by the equa-tion: A = -0.0401 + 364.315 x C, where C is the concentration of methyldopa in mol L-1and the angular coefficient value corresponds to the molar absorptivity (ε), that is 3.64 x 10²L mol-1cm-1.
Assay of precision was defined by deter-mining intraday and interday precision, The absorbance values obtained
expressed as relative standard deviation (RSD). The interday variation was evaluated over 3 days. The intraday and interday precision were studied for 10 replicate analyses of 1.59 x 10⁻³mol L-1 methyldopa solution. The coefficients of varia-tion were 0.7 and 1.1% respectively, indicating that the proposed method has high repeatability. In order to investigate the presence of matrix effects on the proposed method, a recovery study was carried out. In this study, 2.52 x 10⁻⁴; 5.04 x 10⁻⁴; 7.55 x 10⁻⁴and 1.00 x 10⁻³mol L-1of methyldopa reference solutions were added in three representative pharmaceuticals (samples A,B and C). Recovery mean values for all samples (n=3) ranged from 97.8 - 102.7% indicating the absence of significant matrix effects on the meas-urements. The LOD (3.SDblank/ slope of analytical curve) and LOQ (10.SDblank/ slope) were 7.55 x 10 -6 and 2.52 x 10⁻⁵mol L-1, respectively [38].
Study of interferences
Since the aim of this study was to determine methyldopa in pharmaceuticals, the effects of the most commonly used excipients were carefully examined. The excipients studied were starch, talc, magnesium stearate, tartaric acid, polyethylenegly-col, polypropyleneglypolyethylenegly-col, cellulose, ethylcellulose, hydroxypropylmethylcellulose, lactose, silicon dioxide and sodic croscarmelose. For this study, solutions containing methyldopa and each of the excipients taken separately in concentrations equal or 10 times greater than that of methyldopa were shaking with methanol in a magnetic mixer for 10 minute, diluted, filtered when necessary, and ana-lyzed under the same conditions described in the preparation of analytical curve.
The effect of each excipient was consid-ered interference when the absorbance signal showed an error equal or more than 3% in the determination of the drug. The percentage of methyldopa found in these solutions ranged of 97.4 to 103.1 %, with variation coefficients val-ues less than 3% for three replicates, indicating that no interferences were observed under the studied conditions.
Analytical application
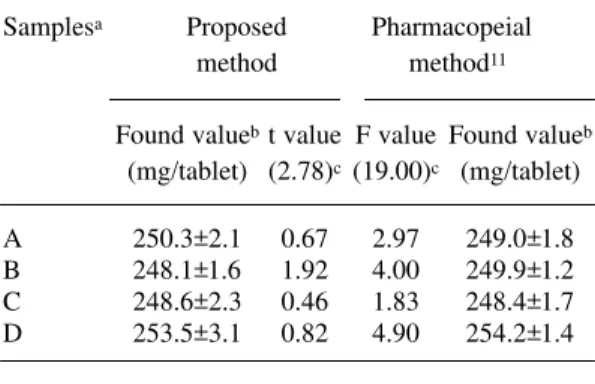
The applicability of the proposed method for determination of methyldopa in commercial dosage were statistically [39] compared with those obtained by the Brazilian Pharmacopoeia
Table 2.Determination of methyldopa in
pharma-ceutical formulations.
Samplesa Proposed Pharmacopeial
method method11
Found valueb t value F value Found valueb
(mg/tablet) (2.78)c(19.00)c (mg/tablet)
A 250.3±2.1 0.67 2.97 249.0±1.8 B 248.1±1.6 1.92 4.00 249.9±1.2 C 248.6±2.3 0.46 1.83 248.4±1.7 D 253.5±3.1 0.82 4.90 254.2±1.4
aPackage labeled to contain 250 mg methyldopa per tablet.
bAverage ± standard deviation (SD) of three determi-nations (n = 3).
cTheoretical values of t and F at 95% confidence level procedure [11] and are summarized in Table 2. In all cases, the calculated F and t values did not exceed the theoretical values, indicating that there is no significant difference between the per-formance of the two methods as regard accuracy (t-test) and precision (F-test).
Conclusions
The proposed spectrophotometric method, which is simple, rapid and inexpensive provide gain of sensitivity without the need of additional step as extraction or heating. The method does not involve stringent reaction con-ditions and gives precise and accurate results. Its usefulness for methyldopa determination in phar-maceutical formulations was demonstrated, sug-gesting its use as an attractive alternative to many other previously reported methods for analysis of methyldopa.
Acknowledgements
We would like to thank Capes, CNPq and FAPESP foundations (Brazil) for financial support.
References
[1] B.B. Hoffman, in: J.G. Hardman, L.E. Limbird, A. Goodman-Gilman (Eds.), As Bases Farmacológicas da Terapêutica, McGraw-Hill, Rio de Janeiro, 2003, pp. 163. [2] R.M.V. Camanas, J.M.S. Mallols, J.R.T. Lapasio, G. Ramis-Ramos, Analyst 120 (2005) 1767.
[3] M. Zecevic, L. Zivanovic, S.K. Agatonovic, D. Minic, J. Pharm. Biomed. Anal. 24 (2001) 1019.
[4] S. Ting, J. Assoc. Off. Anal. Chem. 66 (1983) 1436. [5] S. Ting, J. Assoc. Off. Anal. Chem. 67 (1984) 1118. [6] S.S. Badawy, Y.M. Issa, A.S. Tag-Eldin, Electroanalysis 8 (1996) 1060.
[7] J. Ballantine, A.D. Woolfson, Int. J. Pharmaceutics 3 (1979) 239.
[8] V.N. Pathak, M.S.R. Shukla, I.C. Shukla, Analyst 107 (1982) 1086.
[9] A.A.M. Wahbi, H. Abdine, M. Korany, M.H. Abdel-Hay, J. Assoc. Off. Anal. Chem. 61 (1978) 1113.
[10] M.A. Korany, A.M. Wahbi, Analyst 104 (1979) 146. [11] Farmacopéia Brasileira, fourth ed., Atheneu, São Paulo, 1996, pp. 47.1.
[12] P. Nagaraja, K.C.S. Murthy, K.S. Rangappa, N.M.M. Gowda, Talanta 46 (1998) 39.
[13] T. Aman, I.U. Khan, N. Aslam, I. Ahmad, Anal. Lett. 31 (1998) 1007.
[14] A. Afkhami, H.A. Khatami, J. Anal. Chem. 58 (2003) 135.
[15] P. Nagaraja, R.A. Vasantha, K.R. Sunitha, J. Pharm. Biomed. Anal. 25 (2001) 417.
[16] M.I. Walash, A. Abou-Ouf, F.B. Salem, J. Assoc. Off. Anal. Chem. 68 (1985) 91.
[17] F.B. Salem, Anal. Lett. 18 (1985) 1063.
[18] M.I.H. Helaleh, N. Rahman, A.N. Nafisur, S.M. Eyad, Anal. Sci. 13 (1997) 1007.
[19] L. Zivanovic, M. Vasiljevic, S. Agatonovic, D. Radulovic, Boll. Chim. Farm. 130 (1991) 162.
[20] B.S. Nagaralli, J. Seetharamappa, M.B. Melwanki, K.C. Ramesh, J. Keshavayya, J. AOAC Int. 85 (2002) 1288. [21] L.K. Abdulrahman, A.M. Al-Abachi, M.H. Al-Qaissy, Anal. Chim. Acta 535 (2005) 331.
[22] J.J.B. Nevado, J.M.L. Gallego, P.B. Laguna, Fresenius J. Anal. Chem. 353 (1995) 221.
[23] M. Tubino, A. Rodrigues Jr., M.M.D.C. Vila, J. Flow Injection Anal. 21 (2004) 132.
[24] P.R.S. Ribeiro, J.A. Gomes Neto, L. Pezza, H.R. Pezza, Talanta 67 (2005) 240.
[25] O.A. Ohlweiler, Química Analítica Quantitativa, Livros Técnicos e Científicos, Rio de Janeiro, 1982.
[26] L.I. Bebawy, N.M. El-Kousy, J.K. Suddik, M. Shokry, J. Pharm. Biomed. Anal. 21 (1999) 133.
[27] I.A. Darwish, J. AOAC Int. 88 (2005) 38.
[28] R.S. Bakry, O.A. Razak, A.F.M. El-Walily, S.F. Belal, J. Pharm. Biomed. Anal. 14 (1996) 357.
[29] F.M.A. Attia, Farmaco 55 (2000) 659.
[30] E.A. Ibrahim, A.S. Issa, M.A.A. Salam, M.S. Mahrous, Talanta 30 (1983) 531.
[31] I.A. Darwish, Anal. Chim. Acta 551 (2005) 222. [32] H. Salem, J. Pharm. Biomed. Anal. 29 (2002) 527. [33] L.I. Bebawy, Y.M. Issa, K.M.A. Moneim, J. AOAC Int. 86 (2003) 1.
[34] N.M. El-Kousy, L.I. Bebawy, J. AOAC Int. 82 (1999) 599.
[35] R. Foster, Organic Charge-Transfer Complexes, Academic Press, London, 1968.
[36] M.U. Adikwu, U. Ajali, G.B. Okide, U.E. Odoh, Boll. Chim. Farm. 141 (2002) 315.
[37] P.L. Weinert, H.R. Pezza, J.E. Oliveira, L. Pezza, J. Agric. Food Chem. 52 (2004) 7788.
[38] G.L. Long, J.D. Winefordner, Anal. Chem. 55 (1983) 712A.
[39] J. C. Miller, J. N. Miller, Statistics for Analytical Chemistry, second ed., Ellis Horwood Limited, London, 1992.
M. A. Gotardo, L. S. Lima, R. Sequinel, J. L. Rufino, L. Pezza, H. R. Pezza. Um método espec-trofotométrico simples para a determinação de metildopa usando p-cloranil na presença de peróxido de hidrogênio.
Resumo:Este trabalho descreve um método espectrofotométrico simples, rápido e sensível para a deter-minação de metildopa em formulações farmacêuticas. O método é baseado na reação entre tetracloro-p-benzoquinona (p-cloranil) e metildopa, a qual é acelerada por peróxido de hidrogênio (H2O2), produzindo um composto vermelho-violeta (λmax = 535 nm) à temperatura ambiente (25,0 ±0,2 0C). As melhores condições para a reação foram obtidas por planejamento experimental. A lei de Beer é obedecida em um intervalo de concentração de 2,10 x 10⁻⁴to 2,48 x 10⁻³mol L-1(r = 0,9997). O limite de detecção deter-minado foi de 7,55 x 10⁻⁶mol L-1e o limite de quantificação foi de 2,52 x 10⁻⁵mol L-1. A precisão intra-dia e interintra-dia do método proposto foram determinadas pela análise em decuplicata (n=10) de uma solução de metildopa 1,59 x 10⁻³mol L-1e apresentaram coeficientes de variação de 0,7 e 1,1%, respectivamente. O método proposto foi aplicado com sucesso na determinação de metildopa em diferentes marcas de medicamentos. Os resultados obtidos pelo método proposto estiveram em boa concordância com aqueles obtidos pelo método da Farmacopéia Brasileira em um nível de confiança de 95%.