Printed in Brazil - ©2004 Sociedade Brasileira de Química 0103 - 5053 $6.00+0.00
Article
* e-mail: [email protected]
Electrochemistry of Vitamin E Hydro-Alcoholic Solutions
Cristiano Giacomelli, Fernando Carlos Giacomelli, Luciano Ortigara Alves, Ana Karina Timbola and Almir Spinelli*
Departamento de Química, Universidade Federal de Santa Catarina, 88040-900, Florianópolis - SC, Brazil
O comportamento eletroquímico da vitamina E em meio hidro-alcoólico foi estudado na faixa de pH 3,1-12,1 aplicando-se as técnicas voltametria cíclica, eletrólise com potencial controlado e espectroscopias UV-Vis, IR e 13C RMN. Observou-se que a presença de água tem conseqüências
importantes na estabilidade química das espécies geradas eletroquimicamente. Em meio hidro-alcoólico e sobre eletrodos de carbono vítreo, a vitamina E apresenta três picos de oxidação, enquanto que apenas um pico é observado em outros solventes. Embora a reação eletroquímica no primeiro pico seja a mesma na presença e na ausência de água, a qual compreende a transferência de dois elétrons em uma etapa, duas reações eletroquímicas e três químicas subseqüentes ao primeiro pico foram pela primeira vez estabelecidas com base em evidências eletroquímicas em meio hidro-alcoólico. Estes resultados são considerados muito importantes levando-se em consideração o papel mediador na transferência de elétrons entre a fase aquosa e lipídica que a vitamina E exerce no organismo.
The electrochemistry of vitamin E hydro-alcoholic solutions of pH 3.1 to 12.1 was studied by cyclic voltammetry, controlled potential electrolysis, thin layer chromatography and UV-Vis, IR and
13C NMR spectroscopy. The presence of water was found to have important implications on the
chemical stability of electrogenerated species. Vitamin E exhibits three oxidation peaks in hydro-alcoholic solutions at glassy carbon electrodes in contrast to just a single peak in other solvents. Although the electrochemical reaction at the first peak was found to be the same in presence and in absence of water, which is a one-step two-electron transfer process, two heterogeneous electrochemical reactions and three homogeneous chemical reactions following this peak were established based on electrochemical evidences for the first time in alcohol aqueous conditions. This insight is considered to be very important provided the mediator character of vitamin E in the electron transfer between aqueous and lipid phase in the organism.
Keywords: vitamin E, electrochemistry, antioxidants
Introduction
Vitamin E (α-tocopherol, Figure 1) has prompted a host
of many chemical and biological studies due to the widespread occurrence in the nature and also the natural
antioxidant action.1,2 Tocopherols are present in
biomembranes and are efficient free radical scavengers through electron transfer processes, inhibiting the lipid
peroxidation.1,3 The inherent vitamin E biological
relevance is related to the mediator character in the electron transfer between aqueous (where low molecular weight antioxidants are present) and lipid phase
(practically apolar).1 Despite this, the electrochemical
behavior of vitamin E has been almost always studied in
organic solvents due to its solubility characteristics. Organic solvents can model some biological properties, nevertheless sometimes roughly. The stability of intermediate species originated by oxidation reactions is
substantially different depending on the surroundings,4
offering a very rich chemistry as consequence.3-11 In this
way, the knowledge of its electrochemical behavior in more
biological-like conditions is relevant to get insight into vitamin E action as antioxidant. The proton concentration
influence on the antioxidant activity,12,13 for example, is
an important subject that is not satisfactorily approached in electrochemical measurements in organic media. A very attractive way to overcome this problem is that used
recently by Wain et al.14 who investigated the biphasic
redox chemistry of vitamin E immobilized as microdroplets on a basal plane pyrolytic graphite electrode in aqueous media.
The aim of this work is to contribute for the understanding of vitamin E electrochemistry in hydro-alcoholic solutions at a glassy carbon electrode. It should be mentioned that in the literature most of the
investigations were carried out using platinum2,3,15-17
working electrodes, whereas rarely were glassy18,19 or
paste20-22 carbon electrodes. Undoubtedly, new
implications may evolve as result, and we indeed show here two novel oxidation peaks for the electrochemical oxidation of vitamin E dissolved in hydro-alcoholic
solutions. Along with electrochemical evidences, 13C NMR,
IR, UV-Vis and thin layer chromatography techniques were employed in order to interpret the results and propose a speculative mechanism, which is left for further and open discussion.
Experimental
Chemicals
All the reagents used in this study were of analytical
grade acquired from Fluka (vitamin E), Merck (H3PO4,
K2HPO4, KH2PO4, KOH), Grupo Química (ethanol) and
Aldrich (NH4PF6). They were used without previous
purification. Distilled and deionized water was used for all solution preparations.
Cyclic voltammetry
Cyclic voltammograms were recorded using a glassy
carbon working electrode as previously described.12
Working solutions containing K2HPO4 or KH2PO4 (0.1 mol
L-1) with adjusted pH with KOH or H
3PO4 and ethanol 1:1
(v/v) were used. Vitamin E was directly added (10 µL) to
the 15 mL cell from a stock 1.5 mol L-1 solution in ethanol
after attainment of a cyclic voltammogram of the electrode immersed in a vitamin E free solution. It should be noted that the resulting solution becomes turbid when vitamin E is added owning to its solubility. However, the results herein were found to be completely reproducible. The working electrode used in potential controlled coulometry
was a reticulated glassy carbon mounted in a non-divided electrochemical cell. All the potentials in text are quoted to the Saturated Calomel Electrode (SCE).
Column chromatography and characteristics of the products
In a typical procedure, 150 mL of a potential-controlled
electrolyzed 1.0 mmol L-1 vitamin E alcoholic solution
was evaporated. Thin layer chromatography (TLC) of the resulting oil revealed the presence of two spots (vitamin E and a more polar compound). Subsequently, the products were purified chromatographically in a silica column using mixtures of hexane/ethyl acetate (from 100/0 to 70/30 (v/v)) as eluent. Thirty fractions were collected and analyzed by TLC, then revealing the presence of two compounds (A and B) in addition to vitamin E. Fractions containing the same compound (A or B) were grouped for subsequent
analyses. Compound A was characterized using 13C NMR
(50 MHz, Brucker DRX), IR (Perkin Elmer FT16PC) and UV-Vis (Hitachi U-3000). In the case of B, only a small drop of a brown oil could be isolated, being not possible to properly handle with for further studies.
3,4,5-trimethyl-2-(3-hydroxy-3,7,11,15-tetramethyl-hexadecan-1-yl)-p-benzoquinone (tocoquinone)
IR (film) νmax/cm
-1: 3490, 3264, 2927, 2864, 2723,
1641, 1461, 1376, 1304, 1219, 1162, 1107, 933, 876, 832,
716, 646. 13C NMR (d-acetone) δ 22.4 (C-4), 33.8 (C-2a),
43.2 (C-3), 72.3 (C-2), 140.8; 141.2 (C-5 and C-7; C-8),
145.9 (C-4a), 187.8; 188.3 (C-6; C-8a).4 The numbering of
carbon atoms is shown in Figure 1.
Results
Figure 2 shows a typical cyclic voltammogram at a glassy carbon working electrode in pH 7.4 hydro-alcoholic
1:1 (v/v) solution containing 1.0 mmol L-1 vitamin E for a
scan rate (v) of 100 mV s-1. The inset depicts a cyclic
voltammogram recorded in absolute ethanol by employing the same electrochemical parameters in order to obtain data concerning the solvent influence on the chemical stability of generated species. In first positive going scan, three oxidation processes are pointed out in
hydro-alcoholic medium (EpI = +0.17 V, E
p
II = +0.84 V and E
p III =
+1.04 V), whereas just one peak is observed in ethanol (EpI
= +0.50 V). The similarity concerning peak I potential range
and the respective current intensity (ipI) suggests that the
going scan, two reduction processes can be perceived in
both hydro-alcoholic (EpIV = +0.16 V and E
p
V = -0.45 V)
and ethanol (EpIV = +0.16 V and E
p
V = -0.24 V) solutions,
but with different intensities. The overall voltammetric response shown in Figure 2 is similar to that observed by
Wain et al.14 for the biphasic oxidation of vitamin E
microdroplets immobilized on graphite electrodes immersed in aqueous solutions.
Figure 2 clearly convinces that water deeply influences the voltammetric profile of vitamin E, increasing drastically the current at peak V and producing two novel oxidation peaks (II and III) in the positive scan. Hence, it is worthwhile to evaluate the influence of pH on the voltammetric profile. Figure 3 shows cyclic voltammograms at a glassy carbon
electrode in 1.0 mmol L-1 vitamin E for v = 100 mV s-1 for pH
3.1 and 10.1 (only two curves are exhibited for the sake of clarity), based on which it can be visibly concluded that solution pH plays a major role on the chemistry of electrogenerated species. The following remarks are evident in Figure 3 when the solution pH is progressively
augmented from 3.1 (curve a) to 10.1 (curve b): i) the current
intensity related to peak I (ipI) slightly decreases with
concurrent shift of EpI towards more negative values (i.e.,
the nucleophilicity of the organic compound increases23
and its antioxidant activity is thermodynamically favored
with the increase in the pH); ii) the current associated to
peaks II (ipII) and III (i p
III) increases; iii) the shoulder IV
disappears and iv) the current of peak V (ipV) dramatically
increases with simultaneous displacement of EpV towards
more negative values.
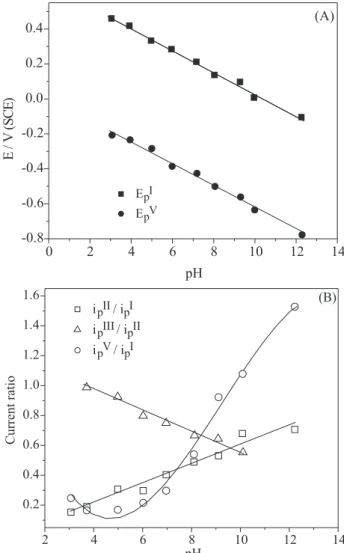
Figure 4A shows the linear dependence of EpI and E
p V
on the solution pH (data extracted from voltammograms
recorded in the same conditions as for Figure 3) with δEp
Figure 2. Cyclic voltammogram for 1.0 mmol L-1 vitamin E in
ethanol/water 1:1 (v/v) solution with pH 7.4 at a glassy carbon electrode for v = 100 mV s-1. The inset shows a cyclic voltammogram
recorded in ethanol with NH4PF6 as supporting electrolyte (the elec-trochemical parameters are identical).
Figure 3. Cyclic voltammogram for 1.0 mmol L-1 vitamin E in
ethanol/water 1:1 (v/v) solution with distinct pH at a glassy carbon electrode for v = 100 mV s-1.
Figure 4. (A) Peak I and V potential as function of pH and (B) current ratio variation as function of pH (data extracted from 1.0 mmol L-1 vitamin E hydro-alcoholic 1:1 (v/v) cyclic voltammograms
δpH-1 ~ 60 mV pH-1. This slope has been usually
determined for phenolic systems in aqueous media,24 which
stands for electrochemical reactions followed by deprotonation involving the same number of electrons (n) and protons (m). Peaks II and III are practically not changed by solution pH (Figure 3), which means that proton species are not involved in these electrochemical processes.
Figure 4B shows the current ratio (ipII/ipI; i
p III/ipII ;
ipV/ipI ) variation as function of pH (data extracted from
voltammograms recorded for v = 100 mV s-1). The i
p II/i
p I
current ratio dependence on pH is virtually linear, increasing as pH increases, the opposite behavior being observed for ipIII/i
p
II. In the case of i p
V/i p
I, a slightly decrease
occurs when pH is changed from 3.1 to 3.7, exhibiting a minimum around pH 5.0 and, afterwards, it significantly increases. These data in Figure 4B suggest the occurrence of at least three homogenous chemical reactions at the electrode/solution interface involving electrogenerated species (see Discussion).
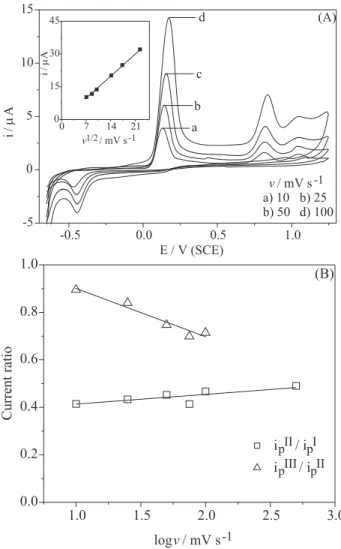
Depending on the characteristics of each particular electrochemical system, the scan rate effect on cyclic voltammetric profile is an important tool to evaluate the presence of homogenous chemical reactions perhaps
following the electrochemical ones.24 Figure 5A shows
typical cyclic voltammograms at a glassy carbon electrode
in 1.0 mmol L-1 vitamin E hydro-alcoholic 1:1 (v/v) pH
7.4 solutions recorded for different v (for the sake of clarity,
only four voltammograms are given). In general, all the
current peak intensities increased as function of v as
expected,23,24 and all the peak potentials were found to be
influenced by v describing non-reversible electrochemical
reactions. The inset in Figure 5A shows that the current intensity relative to peak I linearly depended on the square
root of the scan rate in the range 50 - 500 mV s-1, which is
a behavior characteristic for diffusion-controlled
processes.23,24 Figure 5B shows the current ratio (i
p II/ipI;
ipIII/ipII) variation as function of v for pH 7.4 solutions. In
Figure 5B, it is intended to show that the number of electrons at peak II corresponds to a half of peak I, given that ipII/i
p
I is approximately 0.5 for all conditions.
Concerning the ipIII/i
p
II current ratio dependence on v, it
suggests the occurrence of homogeneous chemical reaction involving the specie formed at peak II.
It has been proposed14,19,20,24,25 that a homogeneous
chemical reaction of hydrolysis following peak I (in water containing solutions) gives to tocoquinone (an electrochemically active compound) as product. So assuming, at least one electrochemical process in addition to those already shown herein is presumably expected. Indeed, as depicted in Figure 6A for pH 3.1 (chosen owing to its comprehensibility) solutions, for all cycles following
the first one, the peak VI could be pointed out, which means that it should correspond to the oxidation of an electroactive specie formed during the first cycle. In order to clarify its relationship with the other voltammetric peaks, an experiment employing a modified potential/time perturbation program was carried out (Figure 6B). Initially,
the cycle 1 was recorded between -0.70 and +1.30 V.
Afterwards, the anodic switching potential (Eλ,a) was shifted
to 0.00 V, then registering cycles 2 and 3. Later, El,a was
shifted again to -0.20 V, being the cycles 4 and 5 obtained
in the -0.7 V – -0.2 V potential range. The outcome of this experiment (Figure 6B) revealed that peak VI is not present
in the cycle 1. However, it is clearly noticed in the cycles
2 and 3. Cycle 3 also demonstrates the interrelation
between peaks V and VI, as long as cycle 3 has the same
profile as cycle 2.
Controlled potential coulometry was performed in
ethanol containing 1.0 mmol L-1 vitamin E at peak I. The
Figure 5. (A)Cyclic voltammograms for 1.0 mmol L-1 vitamin E in
electrolysis progress was monitored using cyclic voltammetry (Figure 7). It is shown that, proportionally to the advancement of coulometry, the anodic peak I decreases, disappearing when the charge consumption becomes about 2 electrons per molecule of vitamin E. The resulting electrolyzed solution was adequately handled in order to isolate and identify the products.
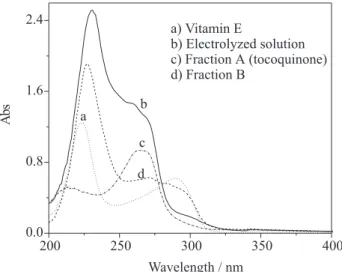
Figure 8 shows UV spectra for vitamin E (spectrum a),
electrolyzed solution (spectrum b), and two
chromatographically-resolved fractions (A and B (spectra
c and d)). Vitamin E (spectrum a) exhibits two absorption
bands at 223 and 292 nm.26,27 Upon electrolysis (spectrum
b), an new absorption band appears around 265 nm,
meanwhile that at 292 nm becomes less pronounced (observe the relationship between intensities instead of intensities itself in Figure 8 since concentration of each
compound is different) indicating the consumption of vitamin E. When the electrolyzed solution was resolved chromatographically, practically a single compound (oil) was found (fraction A), though a minor amount of another product (fraction B) could be also verified. In Figure 8, the
absorption spectrum for fraction A (spectrum c) is
characteristic for tocoquinone,26,27 as also was indicated
by 13C NMR and IR spectroscopy. Concerning fraction B
(spectrum d), it was not possible to obtain a reasonable
quantity of product for further characterization. However, it is interesting to notice that fraction B shows the absorption characteristics of both vitamin E (223 and 292 nm) and tocoquinone (265 mn).
The controlled potential electrolysis shown above was performed in ethanol instead of hydro-alcoholic solution, which is the purpose of this work. Indeed, we tried to carry
Figure 6. (A) Repetitive cyclic voltammetry at a glassy carbon electrode for v = 100 mV s-1 in 1.0 mmol L-1 vitamin E ethanol/water
1:1 (v/v) pH 3.1 solution and (B) at pH 10.1 solution employing a modified potential/time perturbation program.
Figure 8. UV spectra for vitamin E (spectrum a), potential-con-trolled electrolyzed solution (spectrum b), and two chromatographi-cally-resolved fractions A (spectrum c - tocoquinone) and B (spec-tra d).
Figure 7. Linear sweep voltammograms for 1.0 mmol L-1 vitamin E
in ethanol at a glassy carbon electrode for v = 100 mV s-1after 0 (a),
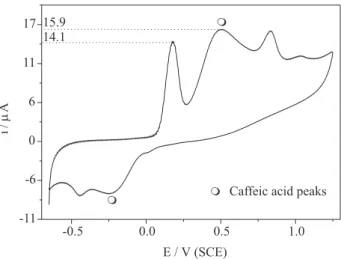
it out in a hydro-alcoholic medium, but the current decreased almost instantaneously due to the poisoning of the working electrode, probably owing to the low solubility of reagents or oxidized products in this solvent mixture. Therefore, in order to confirm the number of electrons concerned at peak I in our work, caffeic acid, whose
electrochemistry is kwon in aqueous solutions,12 was added
to cell in the same concentration (1.0 mmol L-1) as for
vitamin E. The resulting cyclic voltammogram is shown in Figure 9, which reveals that caffeic acid does not interact with vitamin E or vitamin E derivative species, so that the sum of vitamin E and caffeic acid voltammetric profiles is observed. Most importantly in Figure 9 is the current intensity of peak I for vitamin E and caffeic acid that suggests the same number of electrons being transferred in both cases.
Discussion
It is well-known that the chemical stability of vitamin E related species is substantially different depending on
the surroundings (for instance, the solvent)4 resulting in a
very rich chemistry as consequence.3-11 In this work, we
have indeed observed a number of novel characteristics for the electrochemistry vitamin E in hydro-alcoholic solutions. It is clear in Figure 2 that water deeply influences the voltammetric profile of vitamin E through a drastic increase in the peak V current intensity, also producing two novel oxidation peaks (II and III) in the positive scan in homogeneous solutions. These peaks (II and III) were not reported before in these conditions, and they may certainly have implications for the antioxidant activity of vitamin E in biological conditions, provided that the fate of electrogenerated species is an important question in the
biological system.28 Zhu and Zhang,19 who studied the
electrochemistry of vitamin E in methanol/acetate buffer solution 4:1 (v/v), did not report the occurrence of peaks II and III probably because an anodic switching potential
(Eλ,a) of +0.80 V / Ag/AgCl was applied, as did Jaiswal et al.21
in surfactant/ethanol/water solutions. In addition, vitamin E has been found to present just a single oxidation process in
other solvent systems or working electrodes.2,3,15-17,22
Recently, Wain et al.14 observed the existence of peak II in
the biphasic oxidation of vitamin E.
The solution pH was found to be the foremost variable in the system under study, as shown in Figures 3 and 4.
The dependence of EpI and E
p
V on the solution pH in Figure
4A (δEp δpH-1 = -60 mV pH-1) is distinguishing for
electrochemical reactions followed by deprotonation involving the same number of electrons (n) and protons (m). Peak I is a two-electron process (as determined by potential-controlled electrolysis (Figure 7) and by adding caffeic acid to the electrochemical cell (Figure 9)) and, therefore, an explanation (based on vitamin E structure -Figure 1) for the slope obtained in this work is not straightforward. Two two-electron oxidized intermediates
would be the dienone cation (n = 2 and m = 1)2,19,20,24 and
an orto-quinone methide (n = 2 and m = 2).4 Provided that
both the intermediates can give to the herein well characterized final compound at peak I (tocoquinone), the
δEp δpH-1 value would be easily explained by the
formation of orto-quinone methide. On the other hand, a
60 mV pH-1 slope may arise from the fact that the turbid
low ionic strength (0.05 mol L-1) working solution can
potentially provoke an appreciable ohmic drop, resulting
in an overestimated δEp δpH-1 slope.
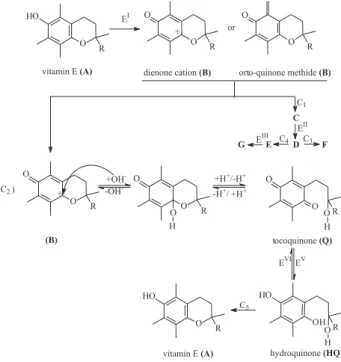
Based on the electrochemical evidences shown herein, it was possible to establish a quite detailed mechanism sketch (Scheme 1) for vitamin E electro-oxidation in hydro-alcoholic medium, which is supported principally by data from Figures 4B, 5B, 6B, as it will be outlined in the sequence.
According to Scheme 1, the oxidation of vitamin E A
at peak I (electrochemical reaction EI) yields to product B.
The structure for B has been proposed to be a dienone
Figure 9. Cyclic voltammogram for 1.0 mmol L-1 vitamin E and 1.0
mmol L-1 caffeic acid in ethanol/water 1:1 (v/v) solution with pH 7.4
at a glassy carbon electrode for v = 100 mV s-1.
cation produced by a two-electron (n = 2) one-proton (m =
1) process. The dependence of EpI on the solution pH
(Figure 4B) suggests, in contrast, n = m = 2 (as shown above) standing for orto-quinone methide intermediate. However, we are not able to discern between these two possible structures (dienone cation and orto-quinone methide) because both of them can give to the compound obtained by controlled potential coulometry and other contributions from the solution (as ohmic drop) may contribute for perhaps the overestimated slope in Figure 4A. After being electrogenerated at peak I, the compound
B undergoes a homogeneous chemical reaction (C1) that
produces an electroactive derivative C, as put forward by
the augmentation of ipII (i.e., i p
II/i p
I ratio) as function of pH
(Figure 4B). The kinetic of C1 is faster as pH increases, and
so being C1 produces a higher amount of the electroactive
derivative C (reagent for the electrochemical reaction EII)
that, therefore, results in an increase in ipII, and in the i
p II/i
p I
ratio as consequence, as a function of pH. The structure of
C (as is the case for D, E, F and G) could not be resolved
since it was not possible to achieve bulk electrolysis in hydro-alcoholic medium, the only experimental condition where peak II and III are present.
The compound D is generated from C at peak II through
an one-electron (ipII/i p
I is 0.5 – Figure 5B, thus as EI is a
two-electron process, EII should be one-electron) no-proton
(EpII is not influenced by pH – Figure 3) electrochemical
reaction (EII). The diminution of i
p III/i
p
II ratio as pH
increased in Figure 4B suggests that the compound D is
chemically instable undergoing a homogenous chemical
reaction (C3), whose product F is electrochemically
inactive. The kinetic associated to C3 reaction also depends
on the pH, being more accentuated as the proton
concentration decreases (see the ipIII/i
p
II ratio as function
of pH – Figure 4B). Thus, only the unreacted quantity of D
is further oxidized at peak III (EIII) giving to the product E.
Despite this, the occurrence of an additional homogeneous
chemical reaction (C4) between D and E is suggested by
the ipIII/i p
II current ratio dependence on v in Figure 5B.
Thereby, C4 should produce the reagent for EIII and as scan
rate is increased, the amount of reagent formed by means this reaction is lower due to shorter time interval, originating, as result, a lower ipIII/i
p
II ratio at low scan rates
(Figure 5B).
The product of controlled potential coulometry at peak
I was found to be the tocoquinone Q (see spectra data as in
Figure 8) in agreement to the findings previously reported
elsewhere in presence of water.14,19,20,24 The formation of
tocoquinone is independent of peaks II and III as revealed by studying the influence of the anodic switching potentials (data not shown). The reaction pathway that
gives to tocoquinone Q comprises the hydrolysis of B
(reaction C2 - Scheme 1). Assuming that B has a dienone
cation structure instead of orto-quinone methide, it was
observed that C2 reaction exhibits a log k – pH profile
with a minimum at pH 5.0,24,25 which is, indeed, in agreement
with the ipV/i p
I current ratio variation as function of pH
(Figure 4B) which also shows the lowest values (i.e., the
lowest ipV and thus the lowest i
p V/i
p
I ratio) around pH 5.0.
According to Scheme 1, the tocoquinone Q can be reduced
at peak V (see for example Figure 6B) via a two-electron
two-proton process (electrochemical reaction EV)
originating the respective hydroquinone HQ. Afterwards,
HQ can be re-oxidized to Q at peak VI (electrochemical
reaction EVI). Note that this statement is fully supported
by the voltammetric profiles in this work (for instance
cycles 2 and 3 in Figure 6B), being also in agreement with
the results previously communicated elsewhere in water
containing medium.20,24,25
Finally, the presence of vitamin E A even after
re-oxidation of HQ to Q is evidenced by peak I during
cycling in pH 3.1 solutions (see Figure 6A). It is believed
that HQ can rearrange into A (C5 in Scheme 1).19,26,29
Conclusions
According to the findings shown herein, the electrochemistry of vitamin E hydro-alcoholic solutions can be described as in Figure 10 (a detailed form of Scheme
1). The detached area highlights the novel chemical (C1,
C3 and C4) and electrochemical (EII and EIII) reactions
coming about at the electrode/solution interface for vitamin E containing alcohol/water 1:1 (v/v) solutions. Moreover, it would be feasible to take into account a solvolysis reaction in competition with the hydrolysis one (C2), given that ethanol is also a potential nucleophile in this case, although we have no experimental evidences supporting it.
Due to the properties of the system studied in this work,
compounds C, D, E, F and G could not be characterized
by conventional procedures. We believe that in situ surface
based spectroscopic methods or addition of co-solvents or chemicals for enhancing solubility or trapping intermediates, respectively, would be promising strategies to get insight into the characteristics of still unknown compounds.
At the best of our knowledge, this was the first approach showing these electrochemical properties of vitamin E dissolved in alcohol-aqueous solutions.
Acknowledgments
This work was supported by Conselho Nacional de Desenvolvimento Científico e Tecnológico (CNPq, Brazil). C. Giacomelli is grateful to Coordenação de Aperfeiçoamento de Pessoal de Nível Superior (CAPES, Brazil).
References
1. Wolfa, R.; Wolfb, D.; Ruoccoc, V.; J. Eur. Acad. Dermatol. Venereol. 1998, 10, 103.
2. Webster, R. D.; Electrochem. Commun. 1999, 1, 581. 3. Mukai, K.; Okade, K.; Hosose, H.; J. Org. Chem. 1989, 54,
557.
4. Rosenau, T.; Habicher, W. D.; Tetrahedron 1995, 51, 7919. 5. Suarna, C.; Craig, D. C.; Cross, J.; Southwell-Keely, P.; J. Org.
Chem. 1988, 53, 1281.
6. Witkowski, S.; Poplawski, J.; Pol. J. Chem. 1996, 70, 1448. 7. Rosenau, T.; Habicher, W. D.; Potthast, A.; Kosma, P.; Synlett
1999, 291.
8. Rosenau, T.; Habicher, W. D.; Chem. Pharm. Bull. 1997, 45, 1080.
9. Rosenau, T.; Habicher, W. D.; Tetrahedron Lett. 1997, 38, 5959.
10. Nagata, Y.; Miyamoto, C.; Matsushima, Y.; Matsumoto, S.; Chem. Pharm. Bull. 2000, 48, 71.
11. Nagata, Y.; Miyamoto, C.; Matsushima, Y.; Matsumoto, S.;
Chem. Pharm. Bull. 1999, 47, 923.
12. Giacomelli, C.; Galato, D.; Ckless, K.; Spinelli, A.; J. Braz. Chem. Soc. 2002, 13, 332.
13. Lemanska, K.; Szymusiak, H.; Tyrakowska, B.; Zielinski, R.; Soffers, A. E. M. F.; Rietjens, M. C. M.; Free Radical Biol. Med. 2001, 31, 869.
14. Wain, A. J.; Wadhawan, J. D.; France, R. R.; Compton, R. G.; Phys. Chem. Chem. Phys. 2004, 6, 836.
15. Mukai, K.; Kageyama, Y.; Ishida, T.; Fukuda, K.; J. Am. Chem. Soc. 1989, 54, 557.
16. Parker, V. D.; J. Am. Chem. Soc. 1969, 91, 5380.
17. Svanholm, U.; Bechgaard, K.; Parker, V. D.; J. Am. Chem.
Soc. 1974, 96, 2409.
18. Giacomelli, C.; Zaccaron, C. M.; Giacomelli, F. C.; Spinelli, A.; XIII Simpósio Brasileiro de Eletroquímica e Eletroanalítica, Araraquara/SP, 2002.
19. Zhang, T.-Y.; Zhu, S.-M.; Anal. Chim. Acta 1995, 309, 111. 20. Kim, O.-S.; Kusuda, K.; Bioelectrochem. Bioenerg. 1994, 33,
61.
21. Jaiswal, P. V.; Ijeri, V. S.; Srivastava, A. K.; Anal. Chim. Acta 2001, 441, 201.
22. Hart, J. P.; Trends Anal. Chem. 1986, 5, 20.
23. Sawyer, D. T.; Sobkowiak, A.; Roberts Jr., J. L.; Electrochemistry for Chemists, 2nd ed., John Wiley & Sons Inc.: New York, 1995.
24. Kissinger, P. T.; Heineman, W. H.; Laboratory Techniques in Electroanalytical Chemistry, 2nd ed., Marcel Dekker Inc.: New York, 1996.
25. Marcus, M. F., Hawley, M. D.; J. Org. Chem. 1970, 35, 2185. 26. van Haaften, R. I. M.; Evelo, C. T. A.; Haenen, G. R. M. M.;
Bast, A.; Biochem. Pharmacol. 2001, 61, 715.
27. Frampton, V. L.; Skinner, W. A.; Bailey, P. S.; J. Am. Chem. Soc. 1952, 76, 282.
28. Cheng, Z. Y.; Ren, J.; Li, Y. Z.; Chang, W. B.; Chen, Z. D.; Redox Report 2002, 7, 395.
29. Sierra, C.; Paster, M. C.; De Ramon, M.; Clin. Chim. Acta 1992, 15, 119.
Received: January 7, 2004