Article
J. Braz. Chem. Soc., Vol. 26, No. 8, 1632-1641, 2015. Printed in Brazil - ©2015 Sociedade Brasileira de Química 0103 - 5053 $6.00+0.00
A
*e-mail: [email protected]
Non-Enzymatic Amperometric Determination of Glucose by CuO Nanobelt
Graphene Composite Modified Glassy Carbon Electrode
Sreeramareddygari Muralikrishna,a Kempahanumakkagari Sureshkumar,a Zhou Yan,b
Carlos Fernandezc and Thippeswamy Ramakrishnappa*,a
aCenter for Nano and Material Science, Global Campus, Jain University, Jakkasandra (P),
Kankapura (T), 560001 Bangalore, Karnataka, India
bDepartment of Chemistry, School of Science, China University of Petroleum (East China),
266580 Qingdao, China
cSchool of Pharmacy and Life Sciences, Robert Gordon University, Garthdee Road,
AB10 7GJ Aberdeen, United Kingdom
We have successfully developed for the first time an electrochemical sensor for glucose by using a simple and effective design of growing CuO nanobelts graphene composites (CuO@G). The as prepared composites were characterized by X-ray diffraction studies (XRD), field emission scanning electron microscopy (FESEM) and transmission electron microscopy (TEM). The prepared composite material exhibits higher electrocatalytic activity for the oxidation of glucose compared to chemically reduced graphene (C rGO) and bare CuO nanobelts. The optimized protocol has linearity with current response for glucose concentration in the range 0.5-6.5 µmol L−1 and
detection limits were found to be 0.05 µmol L−1 (3σ). The method exhibits good reproducibility
and selectivity towards glucose in the presence of other electro active compounds that are normally present in blood serum like dopamine, ascorbic acid, uric acid and sodium chloride. The protocol has been successfully applied for glucose determination in clinic human blood serum samples.
Keywords: graphene, CuO nanobelts, non-enzymatic sensor, glucose
Introduction
The development of reliable, fast and cheap sensing devices for monitoring of glucose is of considerable importance. This is because the blood glucose level is the basis of diagnosis and treatment of diabetes mellitus, a global health care problem that seriously affects normal life of hundreds of millions of people.1 Besides the clinical diagnosis, the glucose detection finds applications in the food industries, fermentation analysis, textile industries and bionanotechnology.1 Commercial pocket sized glucose sensors based on glucose oxidase electrodes have been used by diabetic patients for monitoring their blood glucose levels at any time conveniently.1 But enzyme based electrodes have several drawbacks like chemical (sensitive to oxygen concentration in the environment) and thermal instability, high cost, complicated immobilization procedures and critical operating situations.2 In recent
material.11 Some of the composite materials prepared using noble metal (Pd, Pt and Au) and carbon nanotube are reported for glucose sensing.12,13 These noble metals are highly expensive, hence non-noble metalic and more earth abundant metals like Cu in the form of copper oxide and carbon nanotube composites has been reported for glucose sensing.14-21
Graphene, a 2D unique planar structure and extensively used in the field of electrochemistry due to its exceptional electronic, thermal and mechanical properties. Further, the electron transfer rate can be accelerated with the addition of different metal nanoparticles (MNPs). In recent years, designing of novel composites materials for bio sensing application, using metal nanoparticles modified graphene has become a hot topic. Some of the attempts have been made to grow CuO nanoparticle graphene composites for glucose sensing.22-29 Zheng et al.22 proposed sonication assisted electro deposition of copper nano flower graphene composite in the presence of ethaline on to glassy carbon (GC) and used for glucose sensing. Qian et al.23 reported synthesis of copper oxide nanoparticle graphene composite by in situ reduction and its application to
glucose sensing using sodium citrate as reducing agent. Luo et al.24 reported in situ electro chemical reduction and synthesis of copper nanoparticle graphene modified electrode using graphene oxide (GO) and copper ions. Ritz et al.25 reported CuO nano cubes graphene nano
composite modified electrode in which graphene was casted on GC and then electrochemical oxidation was performed for deposition of CuO nano cubes. Luo et al.26 reported Cu nanoparticle graphene sheet modified glassy carbon in which chemically reduced graphene (C rGO) was prepared and drop casted on the GC and then Cu nanoparticles were electrochemically coated on to the GC. Hsua et al.27 reported CuO/graphene nanocomposites
as glucose sensor. This protocol involves the chemical reduction of GO to graphene followed by the preparation of CuO/graphene nanocomposites. Chen et al.28 reported graphene-copper nanoparticle composite by in situ
chemical reduction. In this protocol, GO and CuII ions were treated with potassium borohydride in order to get graphene copper nanoparticle composites. Wang et al.29 reported copper oxide-reduced graphene oxide nanocomposites synthesized from water-isopropanaol medium in which GO and CuII were heated in the water-isopropanaol mixture. Some of the methods mentioned above involve two steps for preparation of CuO or Cu nanoparticle graphene composites.22-27 Even though
in situ reduction and formation of CuO or Cu nanoparticle
graphene sheets are also reported, but these procedures involve use of organic solvents like isopropanaol or
harsh reducing agents like potassium borohydride.28,29 Qian et al.23 protocol is interesting, it involves single step and simple salt like sodium citrate is used as reducing agent in aqueous media but protocol requires 24 h for complete conversion of GO to reduced GO (rGO) and to get CuO graphene composites.
In order to overcome the above said problems, simple sonochemical protocol involving in situ reduction
and growth of CuO nanobelts reduced graphene oxide in aqueous media has been reported. Recently, the chemically reduction of GO to rGO using NaOH has been proposed.30 This method is found to be easier and greener compared to earlier chemical methods. Based on this, we are proposing a new method where NaOH and surfactant (cetyltrimethyammonium bromide) medium has been used for growing CuO nanobelts as well as for conversion of GO to graphene. NaOH and surfactant (cetyltrimethyammonium bromide, CTAB) medium assists in growing CuO nanobelts sonochemically.31 The same medium is used for conversion of GO to graphene by conventional heating in which NaOH assist in reduction of oxygen moieties of GO.30
Herein, a facile and straight forward strategy is designed based on sonochemical method in which in situ reduction
of GO and growing of CuO nanobelts on reduced graphene sheets in the presence of CTAB and sodium hydroxide. As prepared CuO nanobelts@G showed higher sensitivity and excellent selectivity than C rGO or CuO nanobelts in alkaline media for electrochemical glucose sensing. To the best of our knowledge, only a little research on the fabrication of CuO graphene nano hybrids in a sodium hydroxide system has been reported so far.
Experimental
Chemicals and reagents
Graphite flakes were purchased from Sigma Aldrich. D-(+)-glucose, dopamine (DA), ascorbic acid (AA), uric acid (UA), NaCl, NaOH and Cu(NO3)2, potassium permanganate (99%) were purchased from SD Fine chemicals. Cetyltrimethylammonium bromide (CTAB), K2HPO4, KH2PO4, sodium nitrate (≥ 98%), hydrogen peroxide (≥ 30%), sulphuric acid (95-98%) and ethanol (synthesis grade) were purchased from Merck. All the other reagents were of analytical grade and used without further purification. Double distilled ultrapure water with an electrical resistance > 18.3 MΩ was used for all reagent preparations. Phosphate buffer solutions were prepared from the 0.1 mol L−1 K
Instrumentation
Electrochemical measurements were performed at a standard three-electrode electrochemical cell with a CHI 800 electrochemical work station (CH Instrument, USA) with a CuO nanobelts graphene composite modified glassy carbon electrode as the working electrode, a platinum wire as the counter electrode and Ag/AgCl as the reference electrode. A field emission scanning electron microscopy (FESEM) image was prepared using a JEOL MICROSCOPE (JSM-7000F). A transmission electron microscopy (TEM) was done with a JEOL JEM-2010 F. X-ray diffraction analysis (XRD) was recorded on a Smart APEXCCD, Bruker, Germany. All pH measurements were recorded using digital pH meter MK VI of Systronics make.
Preparation of GO
Graphite oxide was synthesized from oxidation of graphite powder by using modified Hummers and Offmann method.32 In a typical procedure, 3 g of graphite powder, 1.5 g of NaNO3 and 69 mL of concentrated H2SO4 were mixed by constant stirring and the mixture was cooled to below 0 °C in an ice bath. Then, 9 g of KMnO4 was gradually added under vigorous stirring and the temperature was maintained below 10 °C. The reaction mixture was stirred for 60 min at room temperature followed by a slow addition of 138 mL of deionised water with stirring. The temperature of the mixture was increased to 98 °C and maintained at this temperature for 15 min. Finally, the reaction was terminated by adding 3 mL of H2O2 followed by continuous stirring for another 30 min at room temperature. The resultant precipitate was washed with 5% HCl followed by distilled water until the supernatant of the solution become neutral. The obtained graphite oxide was sonicated in deionised water (1 mg mL−1) for 30 min to get GO, then centrifuged and dried at room temperature.
Preparation of (CuO nanobelts@G) composite
In a typical procedure, 50 mg GO, 25 mg Cu (NO3)2, 100 mL distilled water and 100 mL EtOH were mixed in a 1000 mL beaker. Then, 8 mL NaOH aqueous solution (0.5 mol L−1) and 0.1 g of CTAB were added slowly with vigorous stirring. Then the mixture was irradiated with an ultrasonication for 1 h at room temperature. It was then removed from the ultrasonic bath and refluxed for 4 h at 80 °C. Finally, the obtained precipitates were collected by centrifugation and washed several times with absolute ethanol and distilled water. The precipitates were then dried at 60 °C for 12 h before morphology characterization and
fabrication of sensor. For comparison, C rGO was also synthesized by chemical reduction. Similarly, the CuO nanobelts were synthesized by reported procedure.30
Fabrication of (CuO nanobelts @G) composite modified glassy carbon electrode
Glassy carbon electrode (3 mm diameter) was polished on a micro cloth with 1.0, 0.3 and 0.05 micron alumina slurry for 5 min, followed by sonication in double distilled water and ethanol for 5 min respectively. 1 mg of CuO nanobelts@G was uniformly dispersed in the solution (0.5 mL water + 0.5 mL EtOH + 10 µL of 5% nafion) by sonicating for 30 min. 20 µL of above solution was casted on to the pre-treated glassy carbon and dried at room temperature. Similar procedure was applied to get chemically reduced graphene glassy carbon electrode as well as CuO nanobelt modified glassy carbon electrode. Before the experiment, the electrolytic solution was purged with nitrogen gas in order to remove dissolved oxygen. Working electrode was cycled 20 times in 0.1 mol L−1 NaOH solution between 0 and 0.9 V through cyclic voltammograms (CV) until a reproducible background voltammograms were obtained. Amperometric experiments for glucose measurement were carried out in 0.1 mol L−1 NaOH at a desired potential (+0.55 V vs. Ag/AgCl).
Results and Discussion
The formation of CuO nanobelts by epitaxial growth process from Cu(OH)2 nanowires to Cu(OH)2/CuO 1D core-shell nanostructure followed by CuO nanobelts has been reported.31 Similarly, the reduction of GO to rGO in the presence of NaOH is reported.30 Based on these two reports, we have developed new protocol for preparation of rGO-CuO nano belt composites by in situ reduction of
GO and CuO nano belt formation using sonication method. In the presence of ethanol, water system and CTAB help the growth of Cu(OH)2 nano wires morphology on the GO surface. Then, epitaxial growth process of these materials resulted in the formation of Cu(OH)2/CuO 1D core-shell nanostructure. The Oswald ripening of these structures results in the formation of CuO nanobelts. Finally, refluxing the above reaction mixture at 80 °C for 4 h leads to the formation of CuO nanobelts graphene composite.
Characterization of CuO nanobelts graphene composite
corresponding to the interlayer basal spacing of 7.3 Å due to presence of oxygen functionalities present on the surface of GO and the reflection peak (100) at 2θ = 42.57°
suggesting that GO exhibits turbostratic disorder.33,34 In the case of CuO nanobelt graphene composite the reflection peak (002) shifted to 2θ = 20.18° corresponding to basal
spacing of 4.32 Å. The decrease in basal spacing suggests that GO is converted into reduced graphene oxide. The peaks at 2θ values of 31.91°, 35.69°, 38.7°, 47.87°, 53.9°,
58.8°, 65.5° and 67.33° corresponding to (110), (002), (111), (202), (020), (202), (113) and (220) crystal planes of pure CuO, which is in good agreement with the reported values for the bulk CuO (JCPDS, 41-0254) indicating high degree purity and crystallinity quality.30 The small intense peak at 2θ = 13° corresponds to incomplete conversion
of GO to graphene and 42.6° indicates retainment of turbostratic disorder.
The morphologies and microstructures of the products were characterized by FESEM and TEM.
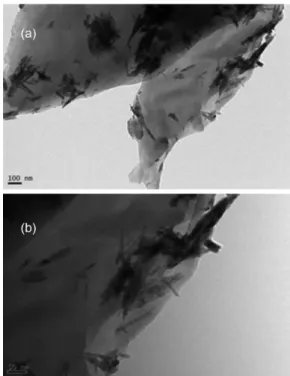
Figures 2a and 2b represents FESEM images of CuO nanobelt graphene composites. The one-dimensional (1D) nano structures, with several µm in length spread over the surface of graphene layer (Figure 2b). The EDX spectrum (Figure 2c) confirmed that the product was composed of 85.5% C, 13.13% O and 1.31% Cu (atomic %). The TEM images in Figure 3 illustrate CuO nanobelts with the length and width in the range of 38-120 nm and 7-15 nm, respectively. The image in Figure 3b indicates the nanobelt to be of single crystal, which can be indexed to monoclinic CuO phase, which is in accordance with the XRD result.
10 20 30 40 50 60 70
50 100 150 200 250 300
GO
1
0
0
0
0
2
(a)
10 20 30 40 50 60 70
0 2 4 6 8 10 12
Cu Cu Cu Cu Cu Cu Cu
2 / degreeθ
2 / degreeθ
Intensity / a.u.
Intensity / a.u. c
CuO nanobelt graphene composite JCPDS No (CuO)-4-254
Cu c
1
0
0
0
0
2
0
2
0
2
2
0
1
1
3
2
0
2
2
0
2
1
1
1
0
0
2
1
1
0
(b)
Figure 1. (a) XRD pattern of synthesized GO and (b) XRD pattern of synthesized CuO nanobelt graphene composite.
Figure 2. (a) and (b) FESEM images and (c) EDX spectrum of CuO nano belt graphene composite.
Electrochemical characterization of CuO nanobelts graphene composites
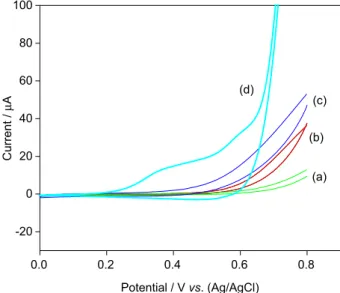
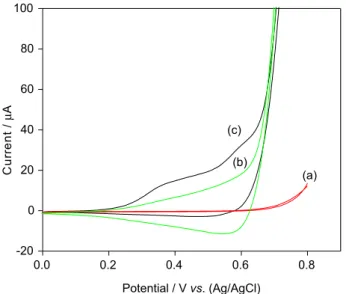
Before applying the CuO nanobelts graphene composite modified glassy carbon electrode to electrocatalytic oxidation of glucose, we carried out cyclic voltammetric studies. From Figure 4, it is clear that the electrode kinetics is faster for CuO nanobelts graphene composite modified glassy carbon electrode than CuO nanobelts modified glassy carbon electrode. This indicates that graphene assists in faster electron transport in addition to providing large surface area compared to CuO nanobelts alone. These results were similar to that of several reported results regarding metal oxide graphene composites.22-29 The electro catalytic oxidation of glucose with different electrodes like glassy carbon electrode, CuO nanobelt modified glassy carbon electrode, C rGO modified glassy carbon electrode and CuO nanobelt graphene composite modified glassy carbon electrode were investigated by CV studies (Figure 5). The glassy carbon exhibits very low oxidation current for glucose at 0.4 V and completed at 0.8 V for 0.4 mmol glucose at scan rate of 0.01 V s−1 (Figure 5a). Whereas with the CuO nanobelt modified glassy carbon electrode under same conditions, the oxidation current increases compared to that of the former system (Figure 5b). However, in case of graphene modified glassy carbon electrode the oxidation of glucose onsets at 0.38 V and the oxidation current was found to be greater compared to that of the two former electrode systems (Figure 5c). This may be due to the faster electron transfer as well as high surface area available on the graphene for electro oxidation of glucose. The
electrocatalytic oxidation of glucose with CuO nanobelts graphene composite modified glassy carbon electrode was completely different from the studied above electrodes. The oxidation of glucose onsets at 0.2 V itself and goes to completion at 0.6 V and the well defined oxidation peak centered at 0.39 V was observed (Figure 5d). The oxidation potential for glucose by earlier reported sensors were found to be more than 0.4 V.22-25 With our present sensor, the over potential for oxidation of glucose shows to be decreased by about 0.2 V. This decrease in over potential may be due to the synergetic effect of both CuO nanobelts and graphene present on the glassy carbon electrode. The CuO nanobelts assisted in electrocatalytic oxidation whereas the graphene provides larger surface area for nanobelts as well as for glucose adsorption and then assists in faster electrode kinetics. Figure 6 presents the CV responses obtained at the CuO nanobelts graphene composite modified glassy carbon electrode in 0.1 mol L−1 NaOH solution containing different concentrations of glucose. In the absence of glucose, a single small broad reduction peak at 0.6 V was observed (curve a). This peak might be due to the CuII/CuIII redox couple similar to the reported literature.35-37 Upon the addition of 0.2 mmol L−1 glucose, notable enhancement of oxidative peak current corresponding to the irreversible oxidation of glucose is observed and the voltammetric response increased with a rising concentration of glucose (0.4 mmol L−1) at about 0.4 V (curves b and c). The oxidation peak for glucose was observed at about 0.37 V. The effect of potential scan rate on oxidation peak current at the CuO nanobelts graphene composite modified glassy -0.6 -0.4 -0.2 0.0 0.2 0.4 0.6
-4 -2 0 2 4 6 8 10 12 14
Current /
A
µ
Potential / Vvs. (Ag/AgCl)
(a) (b)
Figure 4. Cyclic voltammograms obtained in 0.1 mol L−1 NaOH solution
of pH 7 at scan rate of 0.01V s−1 of (a) CuO nanobelts modified glassy
carbon electrode and (b) CuO nanobelts graphene composite modified glassy carbon electrode.
0.0 0.2 0.4 0.6 0.8
-20 0 20 40 60 80 100
Potential / Vvs. (Ag/AgCl)
(a) (b)
(c) (d)
Current /
A
µ
Figure 5. Cyclic voltammograms obtained in 0.1 mol L−1 NaOH solution
containing 0.4 mmol L−1 glucose at a scan rate of 0.01 V s−1 of (a) glassy
carbon electrode; (b) CuO nanobelts modified glassy carbon electrode; (c) (C rGO) modified glassy carbon electrode and (d) CuO nanobelts graphene composite modified glassy carbon electrode.
-0.6 -0.4 -0.2 0.0 0.2 0.4 0.6
-4 -2 0 2 4 6 8 10 12 14
Current /
A
µ
Potential / Vvs. (Ag/AgCl)
(a) (b)
0.0 0.2 0.4 0.6 0.8
-20 0 20 40 60 80 100
Potential / Vvs. (Ag/AgCl)
(a) (b)
(c) (d)
Current /
A
carbon electrode has been investigated in the range 0.1 to 0.5 V s−1 in 0.1 mol L−1 NaOH containing 0.4 mmol L−1 glucose (Figure 7). From Figure 7 it is clear that anodic peak current linearly increased with scan rates, implying that the electrochemical oxidation of glucose on CuO nanobelts graphene composite modified glassy carbon electrode is a surface controlled electrochemical process. The mechanism of electrocatalytic oxidation of glucose by CuO in alkaline medium is as given below (Scheme 1).38 In the first step, the CuO is electrochemically oxidized to strong oxidizing agent CuIII species such as CuOOH or [Cu(OH)
4]
−.39 This species
oxidizes the glucose to give hydrolyzed gluconic acid.
Optimization of reaction parameters
Various reaction parameters that affect the current response during glucose determination have been optimized. In non-enzymatic sensors, pH of the sensing medium plays a vital role in the electrocatalytic activity of the catalysts towards glucose. Hence, we systematically investigated various mediums like 0.1 mol L−1 solutions of NaOH, phosphate and carbonate buffers. Under fixed reaction, conditions (applied oxidation potential 0.5 V, 1.0 µmol glucose) the amperometric responses were good in the 0.1 mol L−1 NaOH compared to other physiological mediums mentioned above (Figure S1 in the Supplementary Information (SI) section). This may be due to the less glucose anion obtained or may be the less electrocatalytic oxidation of glucose by CuO nanobelts graphene composite modified glassy carbon electrode in those media.40 Then, the other important parameter studied is applied oxidation potential which was investigated in the range 0.4 to 0.75 V. The amperometric response increases in potential up to 0.55 V and then decreases. So, 0.55 V has been set as optimum oxidation potential in all further investigations (Figure S2). The electrocatalytic activity of the material also depends on the amount of composite material deposited on to the electrode. To investigate this parameter under fixed conditions (applied oxidation potential 0.55 V, 1.0 µmol L−1 glucose and 0.1 mol NaOH), different aliquots of the composite dispersed in ethanol (0.01 mg L−1) were deposited and their current response was plotted against the amount of composite deposited. From Figure S3 it is clear that 20 µL of composite dispersed in ethanol-water (1 mg mL−1) was sufficient to generate enough current.
Amperometric response of the (CuO nanobelts@G) composite modified glassy carbon electrode
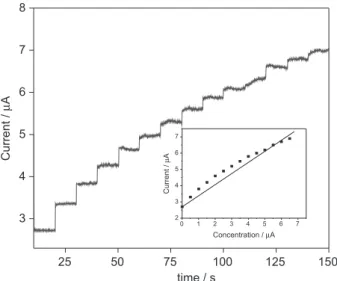
The amperometric response of the CuO nanobelts@G composite modified glassy carbon electrode for glucose was investigated under optimized conditions. Figure 8 illustrates that after each addition of 0.5 µmol L−1 glucose, the enhancement in the current at 0.55 V in 0.1 mol L−1 NaOH solutions was enormous. The response time was also found to be very quick and the steady state current was obtained
0.0 0.2 0.4 0.6 0.8
-20 0 20 40 60 80 100 C u rr e n t / µ A
Potential / Vvs. (Ag/AgCl)
(a) (b)
(c)
Figure 6. Cyclic voltammograms of CuO nanobelt graphene modified glassy carbon electrode in 0.1 mmol L−1 NaOH solution containing
different concentrations of glucose: (a) 0; (b) 0.2 and (c) 0.4 mmol L−1 at
a scan rate of 0.01 V s−1.
0.3 0.4 0.5 0.6 0.7 0.8
0 50 100 150 200 Current / A
µ Current /
A
µ
Potential / Vvs. (Ag/AgCl)
0.01 0.02 0.03 0.04 0.05 110 120 130 140 150 160 170 180
Scan rate / (V s )-1
Figure 7. Cyclic voltammograms obtained in 0.1 mol L−1 NaOH solution
containing 0.4 mmol L−1 glucose at different scan rates (inner to outer
0.1, 0.2, 0.3, 0.4 and 0.5 V s−1) at CuO nanobelts graphene composite
modified glassy carbon electrode. Inset shows current as a function of different scan rate.
Scheme 1. Mechanism for electro catalytic oxidation of glucose by CuO.
0.0 0.2 0.4 0.6 0.8
-20 0 20 40 60 80 100 C u rr e n t / µ A
Potential / Vvs. (Ag/AgCl)
(a) (b)
(c)
0.3 0.4 0.5 0.6 0.7 0.8 0 50 100 150 200 Current / A
µ Current /
A
µ
Potential / Vvs. (Ag/AgCl)
0.01 0.02 0.03 0.04 0.05 110 120 130 140 150 160 170 180
within 5 s. These results confirm that the CuO@G nano belt hybrid exhibits excellent sensitivity and rapid response time. This may be due to the high electro conductivity and good electrocatalytic activity of the CuO nanobelts@G composite materials. These electrodes displayed a good linear range from 0.5 to 6.5 µmol L−1 with a correlation coefficient of 0.9735. The limit of detection (LOD) was found to be 0.05 µmol L−1 at a signal to noise ratio of 3. The analytical parameters of the CuO nanobelts@G composite materials were compared with some of the reported CuO nano material carbon composites (Table 1).7,11,16-19,22,27,40-42 The present composite material exhibits better sensitivity, selectivity, response time and linear calibration range than some of the reported methods. This better performance,
which includes high electrocatalytic activity of CuO nanobelts and large active surface area originating from the electrical network formed by CuO nanobelts and graphene is attributed to the synergetic effect of CuO nanobelts and graphene.
Interference study
In real physiological samples, for example, human blood, interfering species such as chloride ion, AA, UA and DA normally co-exist with glucose. The concentration of chloride ions is about ten times as that of glucose concentration. It is known that, many non-enzyme glucose sensors based on metal oxides, usually prevent them from being poisoned by chloride ions.43 The concentration of ascorbic acid and uric acid are about one-tenth of the glucose concentration. In order to investigate the antifouling ability of the CuO nanobelts@G composite modified glassy carbon electrode, 50 and 100 µmol L−1 of glucose were added to 0.1 mol L−1 NaOH containing 0.2 mol L−1 NaCl. The electrochemical response was investigated by recording change in current. Figure 9 illustrates that the current response of the glucose was not altered even in the presence of excess of chloride ions, indicating that the proposed electrode exhibits good resistance to surface fouling. Then in the presence of 0.2 mol L−1 NaCl, the recovery of spiked samples was about 99%, which indicates that, the effect of the NaCl on the sensor material towards glucose analysis were negligible. The current response of glucose (100 µmol L−1) in 0.1 mol NaOH at 0.55 V was not disturbed even in the presence of other oxidisable species like ascorbic acid (100 µmol L−1), uric acid (100 µmol L−1) and dopamine
Table 1. Analytical parameters of some of the CuO nanoparticle composites
Type of electrode Response
time / s Potential / V
Linear range / (µmol L−1)
LOD /
(µmol L−1) Reference
CuO nanobelts @G 5.00 +0.50 0.5-6.5 0.05 This work
Cu2O NPs/SWNTs 1.00 +0.40 0.4-2000 0.20 7
Cu-GENTFs/GCE 3.00 +0.30 5.0-900 1.00 11
Cu2O NPs/CNTs 10.0 −0.20 0.05-10 0.05 16
Cu2O NPs/MWNTs 5.00 +0.35 10-300 0.50 17
CuO nano cubes/MWCNTs − +0.55 up to 7500 1.00 18
Cu nano clusters/CNTs 5.00 +0.65 0.7-3500 0.21 19
Cu NPs/G GCE − +0.45 0.1-1100 1.20 22
Cu NB − +0.60 − 10.0 27
Cu2O/SMWCNTs 3 .00 +0.40 0.5-2500 0.20 40
CuO G GCE 5.00 +0.59 2-4000 0.70 41
Cu NPs/SWNTs − +0.65 0.25-500 0.25 42
G: graphene; NPs: nano particles; SWCNTs: single walled carbon nano tubes; GENTFs: graphene ethaline nano flowers; GCE: glassy carbon electrode; CNTs: carbon nano tubes; MWNTs: multi walled carbon nano tubes; NB: nano belts and SMWCNTs: straight multi walled carbon nano tubes.
25 50 75 100 125 150 3
4 5 6 7 8
Current /
A
µ
Current /
A
µ
Concentration /µA
0 1 2 3 4 5 6 7
2 3 4 5 6 7
time / s
Figure 8. Amperometric responses obtained at CuO nanobelts@G composite modified glassy carbon electrode in 0.1 mol L−1 NaOH solution
by successive addition of 0.5 µmol L−1 glucose at 0.55 V vs. Ag/AgCl
(10 µmol L−1) was obtained for each measurement with a relative standard deviation of 5.0%. This confirms that the present electrode material exhibits excellent reproducibility. The stability of the fabricated electrodes stored in vacuum desiccator was determined. The electrode retained about 95% responses even after 2 months (Figure 10) suggesting that the present electrode is very stable.
Application study
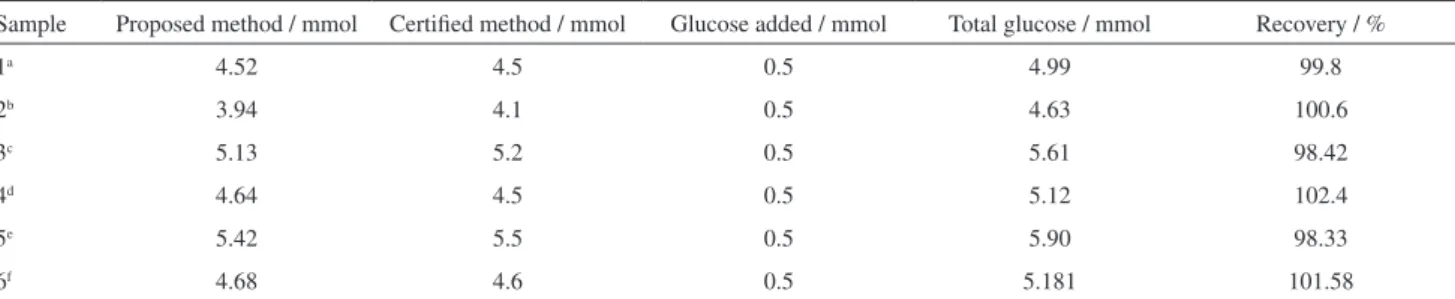
The applicability of the proposed sensor in real samples have been evaluated. The sensor was utilized for glucose monitoring in human blood serum samples. The human blood serum samples were diluted to 100 folds by 0.1 mol L−1 NaOH and glucose was monitored under optimized conditions in five different serum samples. The results obtained by the proposed method are in good agreement with certified values (measured by hospital staff using CA-958 H Rapid Semi-Automatic Biochemical Analyzer) which are depicted in Table 2.
Table 2. Amperometric determination of glucose in blood serum samples
Sample Proposed method / mmol Certified method / mmol Glucose added / mmol Total glucose / mmol Recovery / %
1a 4.52 4.5 0.5 4.99 99.8
2b 3.94 4.1 0.5 4.63 100.6
3c 5.13 5.2 0.5 5.61 98.42
4d 4.64 4.5 0.5 5.12 102.4
5e 5.42 5.5 0.5 5.90 98.33
6f 4.68 4.6 0.5 5.181 101.58
aSpiked with mannose along with glucose; bspiked with galactose along with glucose; cspiked with dopamine along with glucose; dspiked with ascorbic
acid along with glucose; espiked with uric acid along with glucose; fspiked with lactose along with glucose.
0 30 60 90 120 150
4 6 8 10 12 14 16
C
u
rr
e
n
t
/
µ
A
100 µmol L-1
glucose
time / s 50 µmol L-1glucose
100 µmol L-1glucose
AA UA DA
NaCl Gal Lac
Man
Figure 9. Amperometric responses obtained at CuO nanobelts@G composite modified glassy carbon electrode in 0.1 mol L−1 NaOH
solution containing 50 and 100 µmol L−1 glucose and in the presence
of other oxidants like AA, UA, DA, mannose (Man), galactose (Gal), lactose (Lac) (100 µmol L−1) and NaCl (0.2 mol L−1) (applied potential
0.55 V vs. Ag/AgCl electrode).
10 20 30 40 50 60 70
38 40 42 44 46 48
C
u
rr
e
n
t
/
µ
A
time / day
Figure 10. Stability of the CuO nanobelts@G composites stored in vacuum desiccator over 60 days (amperometric currents obtained in 0.1 mol L−1 NaOH solution containing 1.0 µmol glucose, applied potential
0.55 V vs. Ag/AgCl electrode). (100 µmol L−1) and other carbohydrates (galactose,
lactose and mannose (100 µmol L−1 each). Then the recovery studies of the spiked samples in the presence of these species were found to be nearly 100%. The above results indicate that the proposed electrode exhibits good selectivity towards glucose in the presence of common interferents present in blood and is promising for development of non-enzymatic glucose sensor.
Reproducibility and stability
Conclusions
We have successfully demonstrated for the first time a simple and efficient sonochemical route for in situ
reduction of GO to graphene and growing CuO nanobelts in the presence of CTAB and NaOH. As prepared CuO@G composite were deposited on glassy carbon electrode and used as non-enzymatic sensor for glucose. Our sensor exhibits better electrocatalytic oxidation properties compared to traditional graphene and CuO nanobelt alone. The CuO-graphene sensor also exhibits low detection limits (0.05 µmol L−1), good sensitivity, selectivity, fast response time, good reproducibility and stability. This study would open a new avenue to design metal oxide graphene composites by simple sonochemical route for variety of electrochemical devices.
Supplementary Information
Supplementary data are available free of charge at http://jbcs.sbq.org.br as PDF file.
Acknowledgements
The authors acknowledge Jain University for financial support.
References
1. Hellers, A.; Feldman, B.; Chem. Rev.2008, 108, 2482. 2. Wilson, R.; Turner, A. P. F.; Biosens. Bioelectron. 1992, 7, 165. 3. Si, P.; Huang, Y.; Wanga, T.; Ma, J.; RSC Adv.2013, 3, 3487. 4. Umar, A.; Rahman, M. M.; Hajry, A. A.; Hahn, Y. B.;
Electrochem. Commun. 2009,11, 278.
5. Wang, X. J.; Wang, G. F.; Liu, X. W.; Wu, J. J.; Li, M.; Gu, J.; Liu, H.; Fang, B.; J. Phys. Chem.A 2008, 112, 16845. 6. Zhang, L.; Li, H.; Ni, Y. H.; Li, J.; Liao, M.; Zhao, G. C.;
Electrochem. Commun. 2009, 11, 812.
7. Wang, W.; Zhang, L. L.; Tong, S. F.; Li, X.; Song, W. B.;
Biosens. Bioelectron. 2005, 25, 708.
8. Wang, X.; Hu, C. G.; Liu, H.; Du, G. J.; Xi, X. S.; Sens.
Actuators, B 2010, 144, 220.
9. Li, C. I.; Su, Y.; Zhang, S. W.; Lv, X. Y.; Xia, H. L.; Wang, Y. Z.;
Biosens. Bioelectron. 2010, 26, 903.
10. Sun, S.; Zhang, X.; Sun, Y.; Yang, S.; Song, X.; Yang, Z.; ACS
Appl. Mater. Interfaces2013,5, 4429.
11. He, Y.; Zheng, J.; Anal. Methods 2013, 5, 767.
12. Meng, L.; Jin, J.; Yang, G. X.; Lu, T. H.; Zhangand, H.; Cai, C. X.; Anal. Chem.2009, 81, 7271.
13. Xiao, F.; Zhao, F. Q.; Mei, D. P.; Mo, Z. R.; Zeng, B. Z.; Biosens.
Bioelectron. 2009,24, 3481.
14. Yang, Z.; Feng, J.; Qiao, J.; Yan, Y.; Yu, Q.; Sun, K.; Anal.
Methods 2012, 4, 1924.
15. Myung, Y.; Jang, D. M.; Cho, Y. J.; Kim, H. S.; Park, J.; J. Phys.
Chem. C 2009, 113, 1251.
16. Zhang, X.; Wang, G.; Zhang, W.; Wei, Y.; Fang, B.; Biosens.
Bioelectron. 2009, 24, 3395.
17. Wu, H. X.; Cao, W. M.; Li, Y.; Liu, G.; Wen, Y.; Yang, H. F.; Yang, S. P.; Electrochim. Acta 2010, 55, 3734.
18. Yang, J.; Zhang, W. D.; Gunashekaran, S.; Biosens. Bioelectron. 2010, 26, 279.
19. Kang, X. H.; Mai, Z. B.; Zou, X. Y.; Cai, P. X.; Mo, J. Y.; Anal.
Biochem. 2007, 363, 143.
20. Ziang, L. C.; Zhang, W. D.; Biosens. Bioelectron. 2010, 25, 1402. 21. Jiang, F.; Wang, S.; Lin, J. J.; Jin, H. L.; Zhang, L. J.; Huang,
S. M.; Wang, J. C.; Electrochem. Commun. 2011, 13, 363. 22. He, Y.; Zheng, J.; Anal. Methods 2013, 5, 767.
23. Qian, Y.; Ye, F.; Xu, J.; Le, Z. G.; Int. J. Electrochem. Sci. 2012, 7, 10063.
24. Luo, J.; Zhang, H. Y.; Jiang, S. S.; Jiangand, J. Q.; Liu, X. Y.;
Microchim. Acta 2012, 177, 485.
25. Ritz, E.; Jia, W. Z.; Gentile, M.; Wang, Y.; Lei, Y.; Electroanalysis 2008, 20, 2482.
26. Luo, J.; Jiang, S.; Zhang, H.; Jiang, J.; Liu, X.; Anal. Chim.
Acta 2012, 709, 53.
27. Hsua, Y. W.; Hsua, T. K.; Suna, C. L.; Nienc, Y. T.; Pud, N. W.; Gere, M. D.; Electrochim. Acta2012, 82, 152.
28. Chen, Q.; Zhang, L.; Chen, G.; Anal. Chem. 2012, 84, 171.
29. Wang, X.; Liu, E.; Zhang, X.; Electrochim. Acta2014, 130, 253. 30. Zhou, H.; Wang, X.; Yu, P.; Chen, X.; Mao, L.; Analyst2012,
137, 305.
31. Chen, Y. J.; Meng, F.; Yu, H.; Zhu, C.; Wang, T.; Gao, P.; Ouyang, Q.; Sens. Actuators, B 2013, 176, 15.
32. Hummers, W. S.; Offeman, R. E.; J. Am. Chem. Soc. 1958, 80, 1339.
33. Muralikrishna, S.; Sureshkumar, K.; Varley, T. S.; Nagaraju, D. H.; Ramakrishnappa, T.; Anal. Methods2014, 6, 8698. 34. Nethravathi, C.; Viswanath, B.; Michael, J.; Rajamath, M.;
Carbon2012, 50, 4839.
35. Huang, T. K.; Lin, K. W.; Tung, S. P.; Cheng, T. M.; Chang, I. C.; Hsieh, Y. Z.; Lee, C. Y.; Chiu, H. T.; J. Electroanal. Chem. 2009, 636, 123.
36. Zhuang, Z. J.; Su, X. D.; Yuan, H. Y.; Sun, Q.; Xiao, D.; Chio, M. M. F.; Analyst 2008, 33, 126.
37. Casella, I. G.; Gatta, M.; Guascito, M. R.; Cataldi, T. R. I.; Anal.
Chim. Acta 1997,357, 63.
38. Safavi, A.; Maleki, N.; Farjami, E.; Biosens. Bioelectron. 2009, 24, 1655.
39. Wang, J.; Zhang, W. D.; Electrochim. Acta2011,56, 7510. 40. Zhou, X.; Nie, H.; Yao, Z.; Dong, Y.; Yang, Z.; Huang, S.; Sens.
41. Zhu, L.; Wang, Z.; Bioelectrochemistry 2012, 88, 156. 42. Male, K. B.; Hrapovic, S.; Liu, Y.; Wang, D.; Luong, J. H. T.;
Anal. Chim. Acta 2004,516, 35.
43. Chen, J.; Zhang, W. D.; Ye, J. S.; Electrochem. Commun. 2008, 10, 1268.