Sho
rt
R
ep
or
t
0103 - 5053 $6.00+0.00
*e-mail: [email protected], [email protected]
QSPR Study of Partition Coeficient (K
o/w) of some Organic Compounds using
Radial Basic Function-Partial Least Square (RBF-PLS)
Nasser Goudarzi*,a and Mohammad Goodarzib
aFaculty of Chemistry, Shahrood University of Technology, P.O. Box 316, Shahrood, Iran
bDepartment of Chemistry, Faculty of Sciences, Islamic Azad University, Arak branch, Arak,
Markazi, Iran. Young Researchers Club, Islamic Azad University, Arak branch, Arak, Markazi, Iran
Neste trabalho, nós introduzimos um novo método da função de base radial por regressão de mínimos quadrados (RBF-PLS) com elevada exatidão e precisão nos estudos quantitativos da relação entre a estrutura-propriedade de compostos orgânicos (QSPR). Três métodos QSPR foram comparados para a predição dos coeicientes de partição no sistema n-octanol-água (Ko/w) (de alguns compostos orgânicos). A regressão linear múltipla (MLR), a regressão parcial dos mínimos quadrados (PLS) e a regressão base radial com funções pelo método de mínimos quadrados (RBF-PLS) foram empregadas para construir os modelos lineares e não-lineares e predizer o valor de Ko/w. Os descritores teóricos foram calculados por Dragon e por Gaussian 98 e foram explorados pelas regressões parciais, codiicando diferentes aspectos topológicos, geométricos e eletrônicos das estruturas moleculares. A raiz quadrada dos erros médios previstos (RMSEP) para as etapas de testes e da previsão teórica por modelos de MLR, de PLS e de RBF-PLS foram 0,4022; 0,4128; 0,3050; 0,3564; 0,0364 e 0,0533 respectivamente. Também, o erro padrão relativo previsto (RSEP) para os testes e de previsão teórica por MLR, PLS e RBF-PLS foram de 13,24; 13,60; 10,04; 11,74; 1,197 e 1,757 respectivamente. Os dados mostram que o RBF-PLS produziu resultados melhores do que PLS e MLR.
In this work, we introduce a new method ability radial basic function-partial least square (RBF-PLS) with high accuracy and precision in QSPR studies. Three quantitative structure-propertty relationship (QSPR) methods have been compared for the prediction of n-octanol-water partition coeficients (Ko/w) of some organic compounds. The multiple linear regressions (MLR),partial least
square (PLS) and radial basis function-partial least squares (RBF-PLS) models were employed to construct linear and nonlinear models to predict of Ko/w. The theoretical descriptors that calculated by Dragon and Gaussian 98 were explored by stepwise regressions, encoding different aspects of the topological, geometrical and electronic molecular structures. The root means square error of prediction (RMSEP) for training and prediction sets by MLR, PLS and RBF-PLS models were 0.4022, 0.4128, 0.3050, 0.3564, 0.0364 and 0.0533, respectively. Also, the relative standard error of prediction (RSEP) for training and prediction sets by MLR, PLS and RBF-PLS models were 13.24, 13.60, 10.04, 11.74, 1.197 and 1.757 respectively. The resultant data explained that RBF-PLS produced better results than RBF-PLS and MLR.
Keywords: quantitative structure-activity relationship,n-octanol-water partition coeficients,
MLR, PLS, RBF-PLS
Introduction
If a third substance is added to a system of two immiscible liquids in equilibrium, the added component will distribute itself between the two liquid phases until the ratio of its concentrations in each phase attain a certain value
so called the distribution constant or partition coeficient. The measurement of liquid-liquid partition coeficients is extremely important in: (i) fundamental chemistry for studying inorganic and/or organic complex equilibria; (ii) industrial chemistry for optimization of production and waste treatment; and (iii) food chemistry for puriication and extraction of sugars, fat or caffeine.1 The n-octanol/water
chemical species in n-octanol to that in water for a two-phase system at equilibrium. The logarithm of this coeficient, log Ko/w has been shown to be one of the key parameters in quantitative structure-property relationship (QSPR) studies. Also, the n-octanol-water partition coeficient is a measure of the hydrophobicity and hydrophilicity of a substance. Hydrophobic interactions are very importance in many areas of chemistry, including enzyme-ligand interactions, drug-receptor interactions, transport of drug to the active site, the assembly of lipids in biomembranes, aggregation of surfactants, coagulation and detergency, etc.2,3 Hydrophobic
“bonding” is actually not bond formation at all, but rather the tendency of hydrophobic molecules or hydrophobic parts of molecules to avoid water because they are not readily accommodated in the highly ordered hydrogen bonded structure of water.4 Hydrophobic interactions are favored
thermodynamically because of increased entropy of the water molecules that accompanies the association of non-polar molecules which squeeze out water. The hydrophobic “bonding” resulting from an unwelcome reception of non-polar molecules in water involves van der Waals forces, hydrogen bonding of water molecules in 3D structure and other interactions.5 Distribution coeficient could be
measured for basic, acidic and neutral compounds. There are various methods to determine liquid-liquid partition coeficients and especially Ko/w appeared recently.6-9 Many
studies on the modeling of log Ko/w values using topological, topographic, quantum chemical and other descriptors have been reported where log Ko/w values have been the response variable to explore suitability of the descriptors/schemes in QSPR studies.10-16 There are some reports about the
applications of MLR17-20 and artiicial neural network,21-24
modeling to predict the n-octanol/water partition coeficient of organic compounds. Some of papers, about application of QSPR techniques in the development of a new and simpliied approach to prediction of compounds properties were published.25-29 Experimental determination of K
o/w is
often complex and time-consuming and can be done only for already synthesized compounds. For this reason, a number of computational methods for the prediction of this parameter have been proposed. In this work, a QSPR study is performed to develop models that relate the structures of some acidic, basic and neutral organic compounds to their n-octanol-water partition coeficients. The radial basis function-partial least squares (RBF-PLS) method was used for predicting the log Ko/w of mentioned organic compounds.
Theoretical background
About RBF-PLS, let us denote the matrix containing independent variables by X. For m objects and n
variables its dimensionality is m×n. Matrix Y, describing the belongingness of m objects to g classes has the dimensionality m×gand contains only ones and zeros. The principle of RBF-PLS can be summarized as follows: Instead of applying PLS2 to the X and Y data matrices containing the initial data, it can be applied to the matrices Aand Y, where Ais the so called activation matrix deined as:
(1)
where Θ is the radial basis function, characterized by the center and width parameters.
In the linear PLS2 model30,31 the centered data matrices
A and Y are projected onto the low dimensional score matrices of T and U respectively:
A = TP' + E' (2)
Y = UC' + F ' (3)
where the matrices P and C represent the regression coeficients (loadings).
When the C weights are not normalized, the linear inner relation between the scores matrices Tand U can be presented as:
U = T + H (4)
and then
Y = TC' + F* (5)
where E, F, F* and H matrices contain residuals.
An optimal number of factors are established using the cross-validation procedure.31,32 All independent variables
are scaled to the range [0, l].
As known, PLS is a method for building regression models on the latent variable decomposition relating two blocks, matrices X and Y which contain the independent x and dependent y variables respectively. These matrices can be simultaneously decomposed into a sum of f latent variables as follows:
X = TPT + E = ∑t
fp'f + E (6)
Y = UQT + F =∑u
which T and U are the score matrices for X and Y respectively. Also, P and Q are the loadings matrices for X and Y respectively and inally E and F are the residual matrices. Two matrices are correlated by the scores T and U for each latent variable as follows:
uf= bftf (8)
where bf is the regression coeficient for the f latent variable. The acidity constant of the new samples can be estimated from the new scores T 'which are substituted in equation (9), leading to equation (10). Applications of PLS have been discussed by some researchers.31,34
Y = TBQT + F (9)
Ynew = T 'BQT (10)
The general purpose of multiple linear regressions (MLR) is to quantify the relationship between several independent or predictor variables and a dependent variable:
y = b1x1 + b2x2+ b3x3 + … + bmxm + ε (11)
where mis the number of independent variables, b1, …, bm the regression coeficients and yis the dependent variable. Multiple linear regression (MLR) techniques based on least-squares procedures are very often used for estimating the coeficients involved in the model equation.35
Experimental
Materials and methods
Data set
Experimental n-octanol-water partition coeficients (Ko/w) data of some neutral, basic and acidic organic compounds were taken from reference 36. Several review articles describing the various methods used to determine liquid-liquid partition coefficients and especially Ko/w appeared recently.37-40 Names of these compounds and
their experimental n-octanol-water partition coeficients are shown in Table 1. As can be seen, this set contains in total namely 61 n-octanol-water partition coeficients data. Also the calculated n-octanol-water partition coeficients for these compounds by MLR, PLS and RBF-PLS methods are tabulated in Table2. The n-octanol-water partition
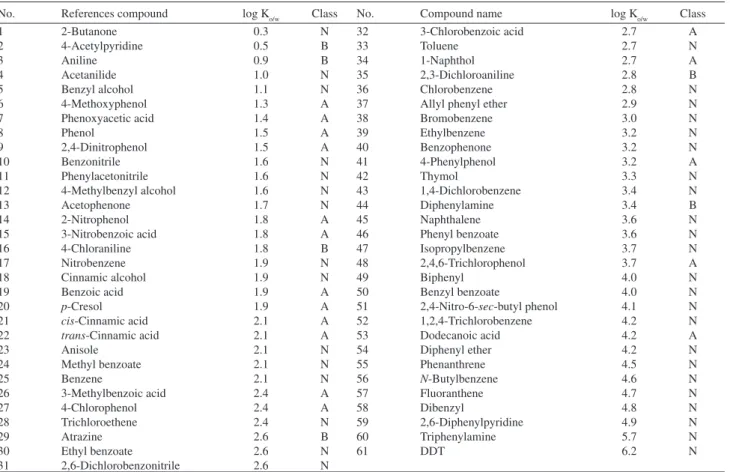
Table 1. Data set and their n-octanol-water partition coeficients (Ko/w)
No. References compound log Ko/w Class No. Compound name log Ko/w Class
1 2-Butanone 0.3 N 32 3-Chlorobenzoic acid 2.7 A
2 4-Acetylpyridine 0.5 B 33 Toluene 2.7 N
3 Aniline 0.9 B 34 1-Naphthol 2.7 A
4 Acetanilide 1.0 N 35 2,3-Dichloroaniline 2.8 B
5 Benzyl alcohol 1.1 N 36 Chlorobenzene 2.8 N
6 4-Methoxyphenol 1.3 A 37 Allyl phenyl ether 2.9 N
7 Phenoxyacetic acid 1.4 A 38 Bromobenzene 3.0 N
8 Phenol 1.5 A 39 Ethylbenzene 3.2 N
9 2,4-Dinitrophenol 1.5 A 40 Benzophenone 3.2 N
10 Benzonitrile 1.6 N 41 4-Phenylphenol 3.2 A
11 Phenylacetonitrile 1.6 N 42 Thymol 3.3 N
12 4-Methylbenzyl alcohol 1.6 N 43 1,4-Dichlorobenzene 3.4 N
13 Acetophenone 1.7 N 44 Diphenylamine 3.4 B
14 2-Nitrophenol 1.8 A 45 Naphthalene 3.6 N
15 3-Nitrobenzoic acid 1.8 A 46 Phenyl benzoate 3.6 N
16 4-Chloraniline 1.8 B 47 Isopropylbenzene 3.7 N
17 Nitrobenzene 1.9 N 48 2,4,6-Trichlorophenol 3.7 A
18 Cinnamic alcohol 1.9 N 49 Biphenyl 4.0 N
19 Benzoic acid 1.9 A 50 Benzyl benzoate 4.0 N
20 p-Cresol 1.9 A 51 2,4-Nitro-6-sec-butyl phenol 4.1 N
21 cis-Cinnamic acid 2.1 A 52 1,2,4-Trichlorobenzene 4.2 N
22 trans-Cinnamic acid 2.1 A 53 Dodecanoic acid 4.2 A
23 Anisole 2.1 N 54 Diphenyl ether 4.2 N
24 Methyl benzoate 2.1 N 55 Phenanthrene 4.5 N
25 Benzene 2.1 N 56 N-Butylbenzene 4.6 N
26 3-Methylbenzoic acid 2.4 A 57 Fluoranthene 4.7 N
27 4-Chlorophenol 2.4 A 58 Dibenzyl 4.8 N
28 Trichloroethene 2.4 N 59 2,6-Diphenylpyridine 4.9 N
29 Atrazine 2.6 B 60 Triphenylamine 5.7 N
30 Ethyl benzoate 2.6 N 61 DDT 6.2 N
31 2,6-Dichlorobenzonitrile 2.6 N
Table 2. Calculated n-octanol-water partition coeficients (Ko/w) by MLR, PLS and RBF-PLS methods
No. Actual Prediction Recovery (%)
RBF-PLS PLS MLR RBF-PLS PLS MLR
1 0.3 0.30784 0.20 0.03 102.61 68.06 8.94
2 0.5 0.53 0.36 0.27 106 72.8 54.9
3T 0.9 1.06 1.26 1.11 117.77 140.6 123.3
4 1.0 1.09 1.43 1.34 109 143.1 134.5
5 T 1.1 1.2 1.57 1.39 109.09 142.7 126.3
6 1.3 1.3 1.2 1.16 100 90.9 89.3
7 1.4 1.4 1.3 1.05 100 92.6 74.8
8 T 1.5 1.41 1.44 1.85 94 96.4 123.3
9 1.5 1.5 1.8 1.7 100 119.3 112.2
10 1.6 1.5885 1.64 1.05 99.28 64.8 66.05
11 T 1.6 1.5932 1.62 1.97 99.57 101.3 123.6
12 1.6 1.5857 1.76 1.88 99.106 110.3 117.9
13 1.7 1.6316 1.91 2.86 95.97 112.6 168.5
14 T 1.8 1.7647 1.54 1.04 98.03 85.9 57.7
15 1.8 1.7429 2.7 2.49 96.82 105.2 138.8
16 1.8 1.8106 1.9 1.74 100.58 104.5 96.6
17 1.9 1.9297 1.7 1.16 101.56 89.4 60.98
18 1.9 1.8844 1.14 1.94 99.17 59.9 102.2
19 T 1.9 1.9 1.6 1.63 100 84.9 86.14
20 1.9 1.8497 1.3 1.85 97.35 67.9 97.41
21 2.1 2.06 1.8 1.4 98.095 87.8 66.65
22 2.1 2.1392 1.84 1.9 101.86 87.8 90.60
23 T 2.1 2.1146 1.39 1.87 100.69 66.19 89.22
24 2.1 2.0322 1.32 2.25 96.77 63.1 107.38
25 2.1 2.1717 2.1 1.72 103.4 99.7 81.85
26 T 2.4 2.351 2.2 2.14 97.95 91.6 89.14
27 2.4 2.4183 2.16 2.19 100.76 90.1 91.3
28 T 2.4 2.406 2.4 2.13 100.25 100.0 88.6
29 2.6 2.6153 2.6 2.6 100.58 100.46 100
30 2.6 2.6116 2.76 2.46 100.44 106.1 94.7
31 2.6 2.5892 2.7 2.71 99.58 103.1 104
32 2.7 2.6858 2.6 2.6 99.474 96.5 96.0
33 2.7 2.73 2.15 2.17 101.11 79.7 80.53
34 T 2.7 2.6941 2.7 2.72 99.781 100 100.6
35 2.8 2.7949 2.76 2.73 99.818 98.7 97.5
36 T 2.8 2.8493 3.1 2.04 101.76 110.2 72.85
37 2.9 2.9701 3.0 3.00 102.41 103.2 103.5
38 3.0 3.0037 3.12 3.01 100.123 104.5 100.4
39 T 3.2 3.2106 3.36 3.34 100.33 105.1 104.3
40 3.2 3.1531 3.43 3.73 98.53 107.1 116.7
41 3.2 3.1928 3.1 3.05 99.77 96.2 95.35
42 T 3.3 3.3032 3.3 3.41 100.09 99.5 103.3
43 3.4 3.3802 3.3 3.4 99.41 98.3 100
44 3.4 3.4218 3.55 3.47 100.64 104.3 102.2
45 T 3.6 3.5709 3.01 3.7 99.19 83.6 102.8
46 3.6 3.66 3.72 3.7 101.66 103.2 102.8
47 3.7 3.7049 3.6 3.28 100.13 92.6 88.64
48 T 3.7 3.7055 3.42 3.71 100.14 98.2 106.6
49 4.0 4.0034 4.3 4.26 100.085 106.2 106.5
50 4.0 4.0 3.97 4.0 100.00 99.2 100
51 4.1 4.1153 4.0 4.0 100.37 97.5 97.6
52 4.2 4.11 4.1 4.18 97.85 74.7 99.5
53 T 4.2 4.2051 4.2 4.18 100.12 100 99.5
54 4.2 4.2084 3.74 3.80 100.2 89.2 90.5
55 4.5 4.4733 4.52 4.2 99.40 101 92.7
56 4.6 4.6014 4.4 3.5 100.03 95.4 76.2
57 4.7 4.6935 4.57 4.6 99.86 97.2 97.9
58 T 4.8 4.7942 4.17 3.7 99.87 86.87 77.08
59 4.9 4.9019 5.23 4.1 100.03 103 83.4
60 T 5.7 5.7015 5.16 5.63 100.02 90.7 98.7
61 6.2 6.2067 6.21 6.31 100.10 100.2 101.7
coeficients values for these compounds were obtained in the same instrumental conditions.
Descriptor generation and screening
The n-octanol-water partition coeficients (Ko/w) of solutes in separation method are related to some structural, topological, electronic and geometric properties of solutes. The value of these molecular features can be encoded quantitatively by numerical values named molecular descriptors. These molecular parameters are to be used to search for the best QSPR model of n-octanol-water partition coeficients (Ko/w). Figure 1 shows the normal distribution of logarithm Kow, which indicates that, the experimental values distributed normally and their frequency is completely reasonable. The 2D structures of the molecules were drawn using Hyperchem 7 software.41 Pre-optimized
data with the molecular mechanics force ield (MM+) and inal geometries were obtained with the semi-empirical AM1 method in Hyperchem program. All calculations were carried out at the restricted Hartree-Fock level with no coniguration interaction. The molecular structures were optimized using the Polak-Ribiere algorithm until the root mean square gradient was 0.001 kcal mol−1. The
resulted geometry was transferred into the Dragon program package which was developed by Milano chemometrics and QSPR group,42 to calculate about 1497 descriptors
in constitutional, topological, geometrical, charge, GETAWAY (geometry, topology and atoms-weighed assembly), WHIM (weighed holistic invariant molecular descriptors), 3D-MoRSE (3D-molecular representation of
structure based on electron diffraction), molecular walk count, BCUT, 2D-autocorrelation, aromaticity index, randic molecular proile, radial distribution function, functional group and atom-centered fragment classes. Meanwhile the Hyperchem output iles again were used by the Gaussian 98,43 program to calculate 2 classes of descriptor including:
electrostatic (minimum and maximum of partial charge, polarity parameters, charge surface area descriptors, etc) and quantum chemical (dipole moment, HOMO and LUMO energies, etc) was operated to optimized with 6-31+G** basis set for all atoms at the B3LYP level.44,45
No molecular symmetry constrain was applied rather full optimization of all bond lengths and angles was carried out at the level B3LYP/6-31++G**. We used from 7 descriptors
for building of different models. It should be noted that we did Y-shufled and the result was 0.0921, which indicated that there is no chance correlation. These descriptors are complementary information content (neighborhood symmetry of 1-order) (CIC1), average eigenvector coeficient sum from distance matrix (VED2), partial charge weighed topological electronic charge (PCWTe), shape profile no.01 (SP01), 3D-MoRSE-signal03/ weighed by atomic masses (Mor03m), T total size index/ weighed by atomic van der Waals volumes (Tv) and mean molecular polarizability (α). These descriptors and their characterizations are shown in Table 3.
Results and Discussion
Selection of the optimum number of factors
The optimum number of factors (latent variables) to be included in the calibration model was determined by computing the prediction error sum of squares (PRESS) for cross-validated models using a high number of factors (half the number of total standard +1), which is deined as follows:
(12)
where yi is the reference Ko/w for the ith compound and ^
yi represents the estimated Ko/w. The cross-validation method employed was to eliminate only one compound at a time and then PLS calibrate the remaining standard descriptor. By using this calibration, the Ko/w of the compound that left out was predicted. This process was repeated until each standard had been left out once. One reasonable choice for the optimum number of factors would be that number which yielded the minimum PRESS value. Since there are a inite number of compounds in the training set, in many cases the minimum PRESS value causes over itting for
unknown compounds that were not included in the model. For solution of this problem, Haaland et al. 46-48 has been
suggested, which the PRESS values for all previous factors are compared with the PRESS value at the minimum. The F-Statistical test can be used to determine the signiicance of PRESS values greater than the minimum. In all instances, the number of factors for the irst PRESS values whose F-ratio probability drops below 0.75 was selected as the optimum. Number of factors were used in PLS model is 5. Figure 2 shows the variation of the R2 parameter with
number of factors. For presentation of the effect of number of factor on the consecutive RBF-PLS models, variation of the root means square error (RMSE) of cross-validation
versusσ is presented in Figure 3. It is clear from this igure
that in σ value of 0.1 and two number of factors we have maximum RMSE value.
Selection of the number of descriptors factors
The basic parameter that is important in different models is number of the descriptors. The liquid-liquid partition coeficient of solutes is related to some structural, electronic and geometric properties of solutes and solvent molecules. These molecular parameters are to be used to search for the best QSPR model of liquid-liquid
partition coeficients and they are geometric, electronic and topological descriptors. Geometric descriptors were calculated using optimized cartesian coordinates and the van der Waals radius of each atom in the molecule. The method of stepwise multiple linear regression (MLR) was used for the selection of importance descriptors and model construction. Descriptors that appear in the best MLR equation are shown in Table 3. As it can be seen from the correlation matrix in Table 4 except a correlation there is no signiicant correlation between the selected descriptors. We used from 7 descriptors for RBF-PLS model. The statistical parameters and speciication of the MLR, PLS and RBF-PLS models are shown in Table 5. As can be seen from this table, the values of root mean square error of prediction (RMSEP) for training and prediction set for the RBF-PLS model are 0.0364 and 0.0533, which should be compared with the values of 0.3050, 0.3564, 0.4022 and 0.4128 respectively for the PLS and MLR models. Comparison of these values and also other statistical results of these two models in Table 5 indicate that the obtained results by RBF-PLS are better than those obtained using the MLR and PLS methods. This is believed to be due to the nonlinear capabilities of the RBF-PLS. It should be noted that we performed a Y-randomization test, in which the Y-block was shufled, whilst the descriptors block was kept unaltered. After analyzing 10 cases of Y-randomization for the model, the average square correlation coeficients achieved which was 0.1011, is compared to the one found
Table 3. The descriptors were used in model construction
No. Symbol Class Meaning
1 CIC1 Topological Complementary information content (neighborhood symmetry of 1-order)
2 VED2 Topological Average eigenvector coeficient sum from distance matrix
3 PCWTe Charge Partial charge weighed topological electronic charge
4 SP01 Randic molecular proiles Shape proile No. 01
5 Mor03m 3D-MoRSE 3D-MoRSE-signal03/weighed by atomic masses
6 Tv WHIM T total size index/weighed by atomic van der Waals volumes
7 α Electronic Mean molecular polarizability; unit: 10−30 esu
Figure 2. Plot of PRESS vs. number of factors by PLS model.
when considering the true Y. The results show that, there is not a chance correlation.
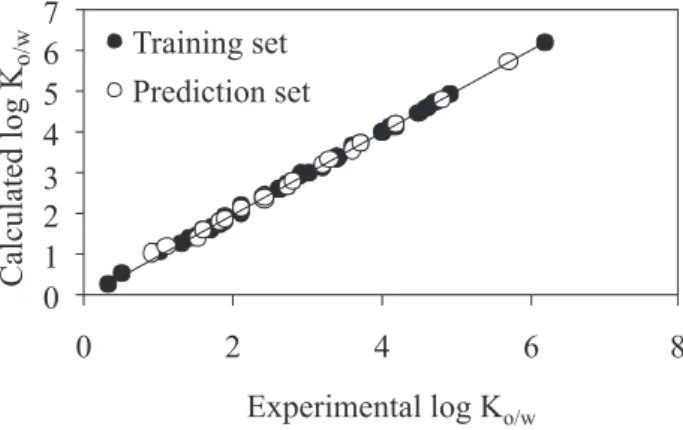
Figure 4 shows the plot of the RBF-PLS predicted against the experimental values of n-octanol-water partition coeficients (Ko/w) for the molecules included in the data set. This plot illustrate that the RBF-PLS is a power technique for prediction of n-octanol-water partition coeficients. The residuals of the RBF-PLS calculated values of n
-octanol-water partition coeficients (Ko/w) are plotted against the experimental values in Figure 5. The propagation of residuals at both sides of the zero line indicates that no systematic error exists in the development of the RBF-PLS model.
Conclusion
MLR, PLS and RBF-PLS are used as feature mapping techniques for prediction of the n-octanol-water partition coeficients of some neutral, basic and acidic organic compounds. The result obtained reveals the superiority of RBF-PLS over the MLR and PLS models. This is due to the ability of the RBF-PLS to allow for lexible mapping of the selected features by manipulating their functional dependence implicitly unlike regression analysis. Descriptors appearing in these QSPR models provide information related to different molecular properties which can participate in the physicochemical process that affected the n-octanol-water partition coeficients of the solutes.
References
1. Rydberg, J.; Musikas, C.; Choppin, G. R.; Principle and Practices of Solvent Extraction, Marcel Dekker: New York, 1992.
Table 5. Statistical parameters and RBF-PLS models
Parameters by RBF-PLS by PLS by MLR
No. Fa 5
PRESS 0.49662
σ 1
No. of interaction 100
RMSEP Training set 0.0364 0.3050 0.4022 Prediction set 0.0533 0.3564 0.4128 RSEP(%) Training set 1.1973 10.0454 13.2464
Prediction set 1.7573 11.7481 13.6044 MAE(%) Training set 2.4436 7.1187 8.1429
Prediction set 4.2226 12.2726 12.8380 R2 Training set 0.9992 0.946 0.9053
Prediction set 0.9983 0.9352 0.9012 a Number of factor: Statistical parameter obtained using RBF-PLS, PLS, MLR models. These parameters are root mean square error of prediction (RMSEP), relative standard error of prediction (RSEP), mean absolute error (MAE) and square of correlation coeficient (R2).
Table 4. Correlation matrix for the seven selected descriptors
CIC1 VED2 PCWTe SP01 Mor03m Tv α
CIC1 1
VED2 0.2126 1
PCWTe 0.4985 0.4896 1
SP01 0.3837 0.9031 0.5303 1
Mor03m 0.0002 0.1342 0.0637 0.1274 1
Tv 0.4364 0.5864 0.4287 0.808 0.1027 1
α 0.2802 0.1777 0.2782 0.2276 0.0511 0.2173 1
Figure 4. Plot of the calculated n-octanol-water partition coeficients against the experimental values.
2. Selassie, C. D.; Abraham, D. J.; Burger’s Medicinal Chemistry and Drug Discovery, Wiley: New Jersey, 2003.
3. Franke, R.; Theoretical Drug Design Methods, Elsevier: Amsterdam, 1984.
4. Taylor, P. J.; Hansch, C.; Sammes, P. G.; Taylor, J. B.; Comprehensive Medicinal Chemistry, Pergamon Press: Oxford, 1990.
5. Martin, A.; Bustamante, P.; Chun, A. H. C.; Physical Pharmacy, Lippincott, Williams and Wilkins: Baltimore, 2001.
6. Sangster, J.; Octanol-Water Partition Coeficients, Fundamentals and Physical Chemistry, Wiley: Chichester, 1997.
7. Poole, S. K.; Poole, C. F.; J. Chromatogr., B2003, 797, 3. 8. Danielsson, L. G.; Zhang, Y. H.; Trends Anal. Chem. 1996,15,
188.
9. Valko, K.; Separation Methods in Drug Synthesis and Puriication, Elsevier: Amsterdam, 2000.
10. Kier, L. B.; Hall, L. H.; Molecular Connectivity in Chemistry and Drug Research, Academic Press: New York, 1976. 11. Saxena, A. K.; Quant. Struct. Act. Relat. 1995,14, 142. 12. Mandloi, M.; Sikarwar, A.; Sapre, N. S.; Karmakar, S.;
Khadikar, P. V.; J. Chem. Inf. Comput. Sci.2000, 40, 57. 13. Vaes,W. H.; Ramos, E. U.; Verhaar, H. J.; Cramer, C. J.;
Hermens, J. L.; Chem. Res. Toxicol. 1998, 11, 847.
14. Estrada, E.; Molina, E.; J. Chem. Inf. Comput. Sci. 2001, 41, 791. 15. Du, Q.; Arteca, G. A.; J. Comput. Aided Mol. Des. 1996, 10,
133.
16. Roy, K.; Saha, A.; Internet Electron. J. Mol. Des. 2003, 2, 288. 17. Moriguchi, I.; Hirono, S.; Nakagome, I.; Hirano, H.; Chem.
Pharm. Bull.1994, 42, 976.
18. Meylan,W. M.; Howard, P. H.; J. Pharm. Sci.1995, 84, 83. 19. Gombar,V. K.; Enslein, K.; J. Chem. Inf. Comput. Sci.1996,
36, 1127.
20. Basak, S. C.; Gute, B. D.; Grunwald, G. D.; J. Chem. Inf. Comput. Sci. 1996, 36, 1054.
21. Huuskonen, J. J.; Livingstone, D. J.; Tetko, I. V.; J. Chem. Inf. Comput. Sci.2000, 40, 947.
22. Tetko, I. V.; Tanchuk, V. Y.; Villa, A. E. P.; J. Chem. Inf. Comput. Sci. 2001, 41, 1407.
23. Molnar, L.; Keseru, G. M.; Papp, A.; Gulyas, Z.; Darvas, F.; Bioorg. Med. Chem. Lett. 2004, 14, 851.
24. Duprat, A. F.; Huynh, T.; Dreyfus, G.; J. Chem. Inf. Comput. Sci. 1998, 38, 586.
25. Porto, L. C.; Souza, E. S.; Junkes, B. S.; Yunes, R. A.; Heinzen, V. E. F.; Talanta2008, 76, 407.
26. Zhang, Q; Huang, J.; Yu, G.; Prog. Nat. Sci.2008, 18, 867. 27. Sârbu, C.; Oni or, C.; Posa, M.; Kevresan, S.; Kuhajda, K.;
Talanta2008, 75, 651.
28. Mittermayr, S.; Olajos, M.; Chovan, T.; Bonn, G. K.; Guttman, A.; TrAC Trends Anal. Chem. 2008, 27, 407.
29. Duchowicz, P. R.; Garro, J. C. M.; Castro, E. A.; Chemometrics Intell. Lab. Syst. 2008,91, 133.
30. Wold, H.; Joreskog, K. G.; Systems under Indirect Observation, Vol. I and II, North Holland Publishing: Amsterdam, 1982. 31. Martens, H.; Neas, T.; Multivariate Calibration, Wiley:
Chichester, 1989.
32. Stone, M.; J. Roy. Stat. Sot., B1974, 36, 111.
33. Goudarzi, N.; Goodarzi, M.; Mohammad Hosseini, M.; Nekooei, M.; Mol. Phys. 2009, 107, 1739.
34. Höskuldsson, A.; J. Chemometrics.1988, 2,211.
35. Draper, N. R.; Smith, H.; Applied Regression Analysis, Wiley, Series in Probability and Statistics, 1998.
36. Berthod, A.; Carda-Broch, S.; J. Chromatogr., A2004, 1037,3. 37. Goudarzi, N.; Goodarzi, M.; Mol. Phys.2008, 106, 2525. 38. Hansch, C.; Leo, A.; Hoelkman, D.; Exploring QSAR:
Fundamentals and Applications in Chemistry and Biology, American Chemical Society: Washington DC, 1995. 39. Taylor, P.C. In Comprehensive Medicinal Chemistry:
The Rational Design, Mechanistic Study and Therapeutic
Application of Chemical Compounds; Deardon J.C., ed.; Pergamon Press: New York, 1990, pp. 241.
40. Ahmed, H.; Poole, C. F.; Kozerski, G. E.; J. Chromatogr., A 2007, 1169, 179.
41. HyperChem. re. 4 for Windows; AutoDesk, Sausalito, CA, 1995. 42. Todeschini, R.; Milano Chemometrics and QSPR Group, http://
www.disat.unimib.it/vhml.
43. Frisch, M. J.; Trucks, G. W.; Schlegel, H. B.; Scuseria, G. E.; Robb, M. A.; Cheeseman, J. R.; Zakrzewski, V. G.; Montgomery Jr., J. A.; Stratmann, R. E.; Burant, J. C.; Dapprich, S.; Millam, J. M.; Daniels, A. D.; Kudin, K. N.; Strain, M. C.; Franks, O.; Tomasi, J.; Barone, V.; Cossi, M.; Cammi, R.; Mennucci, B.; Pomelli, C.; Adamo, C.; Clifford, S.; Ochterski, J.; Petersson, G. A.; Ayala, P.Y.; Cui, Q.; Morokuma, K.; Malick, D. K.; Rabuck, A. D.; Raghavachari, K.; Foresman, J. B.; Cioslowski, J.; Ortiz, J. V.; Stefanov, B. B.; Liu, G.; Liashenko, A.; Piskorz, P.; Komaromi, I.; Gomperts, R.; Martin, R. L.; Fox, D. J.; Keith, T.; Al-Laham, M. A.; Peng, C. Y.; Nanayakkara, A.; Gonzalez, C.; . Challacombe, M.; Gill, P. M. W.; Johanson, B.; Chen, W.; Wong, M. W.; Andres, J. L.; Gonzalez, C.; Head-Gordon, M.; Replogle, E. S.; Pople, J. A.; GAUSSIAN 98, Gaussian Inc.: Pittisburg PA, 1998. 44. Padmanabhan, J.; Parthasarathi, R.; Subramanian, V.; Chattar,
P. K.; Bioorg. Med. Chem.2006, 14, 1021.
45. Zhou, W.; Zhai, Z.; Wang, Z.; Wang. L.; J. Mol. Struct. (THEOCHEM)2005, 755, 137.
46. Haaland, D. M.; Thomas, E.V.; Anal. Chem. 1988, 60, 1193. 47. Haaland, D. M.; Thomas, E.V.; Anal. Chem. 1990, 62, 1091. 48. Goodarzi, M.; Goodarzi, T.; Ghasemi, N. Ann. Chim. 2007, 97,
303.
Submitted: November 22, 2009