Article
0103 - 5053 $6.00+0.00*e-mail: [email protected]
Tuning of Photochemical and Photophysical Properties of [Ru
II(2,2’-bipyridine)
2L
x]
Complexes using Nonchromophoric Ligand Variations
Simone D. Inglez,a Francisco C. A. Lima,a Mariana R. Camilo,b Juliana F. S. Daniel,b
Evania D. A. Santos,a Benedito S. Lima-Neto*,a and Rose M. Carlosb
aInstituto de Química de São Carlos, Universidade de São Paulo, CP 780, 13650-970 São Carlos-SP, Brazil
bDepartamento de Química, Universidade Federal de São Carlos, CP 676, 13565-905 São Carlos-SP, Brazil
Cálculos de orbitais moleculares para o complexo cis-[Ru(bpy)2Lx](PF6)2, onde bpy é
2,2’-bipiridina e L é 3-aminopiridina (complexo 1 com x = 2), foram realizados com o programa
Gaussian 03 usando o método DFT. A estrutura eletrônica e as propriedades moleculares de 1
foram caracterizadas no vácuo e em solução com acetonitrila e comparadas com os resultados obtidos para o complexo com L = 5,6-bis(3-amidopiridina)-7-oxanorborneno (complexo 2 com
x = 1). Os espectros eletrônicos dos complexos 1 e 2 foram investigados por TD-DFT. Os dados
experimentais de voltametria cíclica, UV-vis, fotoquímica e fotofísica foram comparados com dados teóricos de maneira a estabelecer a inluência de L nas transições eletrônicas e interpretar as diferenças entre os comportamentos fotoquímicos desses complexos.
MO calculations were carried out on a cis-[Ru(bpy)2Lx](PF6)2 complex, where bpy is
2,2’-bipyridine and L is 3-aminopyridine (complex 1 withx = 2), with the Gaussian 03 package using the DFT method. The electronic structure and molecular properties of 1 were characterized in vacuum and in acetonitrile solution, and the results were compared to those obtained from the complex with L = 5,6-bis(3-amidopyridine)-7-oxanorbornene (complex 2 with x = 1). The electronic
spectra of 1 and 2 were investigated by TD-DFT. Experimental data from cyclic voltammetry,
UV-visible spectroscopy, photochemical and photophysical experiments were compared to the theoretical data to discover the inluence of L on the electronic transitions and to interpret the differences between the photochemical behaviors of these complexes.
Keywords: DFT, TDDFT, photophysical, photochemistry, ruthenium, 2,2’-bipyridine
Introduction
Previous studies conducted in our laboratories demonstrated that visible light photolysis of complex 1,
cis-[Ru(bpy)2L2](PF6)2, where bpy is 2,2’-bipyridine and L = 3-aminopyridine (3Amnpy), in CH3CN solution, leads to ligand photosubstitution.1 On the other hand, the similar
complex2, cis-[Ru(bpy)2L](PF6)2, where L =
5,6-bis(3-amidopyridine)-7-oxanorbornene (3Amdpy2oxaNBE),
shows photophysical properties with emission in the visible region (λem = 600 nm; τ = 650 ns) and undergoes an electron transfer process using methylviologen (MV2+)
as quenching agent.1
The ligand 3Amdpy2oxaNBE contains a cyclic olein connected to two pyridine rings which are coordinated
to the {RuII(bpy)
2} moiety in complex 2 (Scheme 1).1
This bidentate monomer-ligand was obtained from a reaction between 3Amnpy and
5,6-bis-carboxylate-7-Ru
N N
N N
O
N O
O H N
N H
N
2+
oxanorbornene monomer, so that, in the RuII complexes,
the inluence of the substitute groups in the meta-positions of the pyridine rings could be compared.1
In view of the different photobehaviors of 1 and 2,
the primary photoprocesses and the characterization of the electronic transitions of these complexes need to be understood. Thus, a theoretical investigation of 1 based
on DFT calculations was carried out to gain further insight into the influence of the nonchromophoric ligand on the transition between the MLCT and MC states, which are closely related to the photochemical properties. In addition to what has already been calculated for complex
2,1 a more detailed theoretical investigation was performed
with 2 to improve the discussion. Investigations of the
photoreactivity of 1 in various solvents and in different
irradiation wavelengths were also performed.
The understanding of the consequences of these molecular perturbations is essential for the design of chemical systems with practical applications such as the conversion of radiant to chemical energy.2-11
Experimental
Materials and procedures
Complexes 1 and 2 were prepared as previously
described.1 All solvents used were of HPLC grade. The
optical spectra were recorded on a Varian spectrophotometer model Cary 500 NIR, using 1.00 cm path length quartz cells.
The NMR data were acquired using a Bruker DRX-400 spectrometer. The samples were prepared under argon and analyzed at room temperature using CD3CN. The chemical shifts (d) are given with reference to tetramethylsilane (TMS).
Monochromatic irradiations at 330, 440 and 500 nm were generated either using a 200 W xenon lamp in an Oriel model 68805 Universal Arc Lamp source selected with an appropriate interference ilter (Oriel) or a RMR-600 model Rayonet Photochemical reactor using RMR-4200 lamps. The experiments were carried out at room temperature in 1.00 cm path length quartz cells with 4 polished sides capped with rubber septa. The magnetically stirred solutions (initial complex concentration of ca. 10-5-10-2 mol L-1) were deoxygenated with argon. Potassium (tris-oxalate) ferrate(III) was used in actinometry.12,13 The progress of the
photoreactions was monitored either by UV-vis or 1H NMR
spectra.
The emission spectra at 25.0 oC and 77 K were recorded
on an Aminco-Bowman spectroluorometer model J4-8960A with a high-pressure xenon lamp and an IP 28 type photomultiplier.
Computational methods
The calculations were made using the Gaussian 03 package.14 The starting molecular geometries were obtained
at the HF/3-21G level of theory. The final molecular geometry optimizations were performed using the Kohn-Sham density functional theory (DFT).15 The Becke
three-parameter hybrid exchange-correlation function (B3LYP)16 was used with the pseudo-potential basis
set LanL2DZ.17 No symmetry condition was imposed.
Vibrational frequencies were calculated from the analytic second derivatives to check the minimum on the potential energy surface. The natural bond orbital (NBO) calculation was made using the NBO 3.0 program, as implemented in the Gaussian 03 package.18-20
The fragments {RuII(bpy)
2}, {3Amnpy} and
{3Amdpy2oxaNBE} were used to investigate the metal-ligand interaction energies and the composition of the orbitals. The molecular orbitals are expanded in the converged molecular or atomic orbital of these fragments. The Mulliken population of a fragment orbital in a molecular orbital was used to denote the percentage of the fragment orbital character of that molecular orbital. The differences between the one-electron energies of the appropriate virtual and occupied molecular orbitals were used as a irst approximation for excitation energies.
Molecular orbital (MO) compositions and the overlap populations between molecular fragments were calculated using the AOMix program.21,22 The atomic charges were
calculated using NBO analyses.
Time-dependent density functional theory (TDDFT) was used to calculate the energies and intensities of the electronic transitions.23,24 The electronic transitions were
transformed into simulated spectra using the Swizard program25 and Gaussian functions with half-widths of
25,000 cm-1.
Results and Discussion
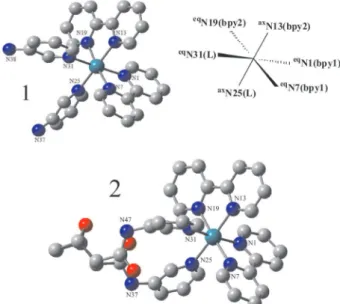
A general view of the structures for complexes 1
and 2 in CH3CN is shown in Figure 1. Selected bond
lengths and angles for the optimized geometry are given in Table 1. The X-ray data for [Ru(bpy)3](PF6)2 are also listed.26
Both complexes 1 and 2 have very similar geometrical
arrangements.Each complex exhibits the Ru atom bounded to two bipyridyl ligands (bpy1 and bpy2) in cis coniguration along with the L (3Amnpy or 3Amdpy2oxaNBE) ligands. The bpy1 molecule (characterized by eqN1 and eqN7
pyridinic atoms), one pyridine N atom from bpy2 (eqN19),
roughly in the equatorial plane. The other N-pyridine atom (axN25) of L is trans-positioned to a pyridine unit of the
bpy2 (axN13) located in the axial position. The complexes
are characterized by C1 symmetry.
There is a satisfactory agreement between the theoretical data of complexes 1 and 2 concerning the bond length of
each N-pyridinic atom and the central atoms (Table 1). The largest difference between complexes 1 and 2 concerns the
bond lengths when one bpy ligand in [Ru(bpy)3](PF6)2 is replaced by a different L (3Amnpy or 3Amdpy2oxaNBE). The experimental bond lengths of the bpy N atoms for the tris-bpy complex are rather short in relation to complexes
1 and 2. The bond lengths Ru-N(L) for L = 3Amnpy (ca. 2.16 Å) and 3Amdpy2oxaNBE (ca. 2.20 Å) are longer when compared with the Ru-N bond lengths observed for the bpy ligand, which is 2.05 Å. This could be caused by a diminished back bonding in complexes 1 and 2.
The polyhedral coordination of the complexes corresponds to an octahedral arrangement of the ligands in the coordination sphere of the metal. For complex 2, the
polyhedron is slightly distorted, with the transeq
N1(bpy1)-Ru-eqN31(3Amdpy
2oxaNBE) angle equal to 171o, for
instance.
Considering that [Ru(bpy)3](PF6)2differs from 1 and 2
by replacing one bpy molecule for L, while the coordinated bpy molecules show similar N(bpy)-Ru-N(bpy) biting angles of 78 oC as expected, the N(L)-Ru-N(L) angles in
complexes 1 and 2 increase by 14-17 degrees. In addition,
while the angle axN25(L)-Ru-eqN31(L) for complex 2
(96.5°) is larger than that found for complex 1, 92.6°,
the eqN1(bpy1)–Ru-eqN31(L)angle decreases ca. 4.0o.
The large bite ring could explain why the two py rings of the 3Amdpy2oxaNBE are not orthogonal, contrary to the 3Amnpy molecules.
Additional information about complex binding was obtained by NBO charge analyses and charge decomposition analyses (CDA) using the AOMix program.21,22
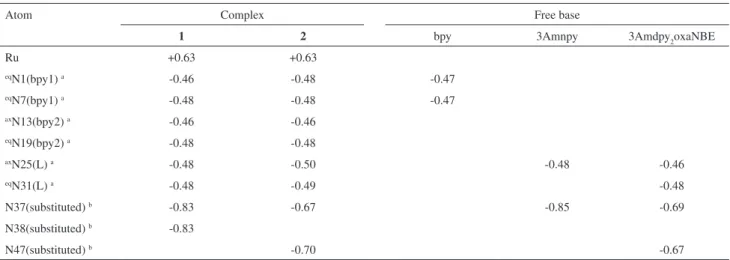
Table 2 shows the NBO charges for complexes 1 and 2. The calculated charge distributions show that Ru atoms
carry similar positive charges, while the N-pyridinic atoms bound to Ru (N1, N7, N13, N19, N25, N31) and the N-substituted (N37, N38, N47) atoms in the L ligands are negatively charged. The highest negative charges are in the N-substituted atoms of each complex (N37, N38, N47) and the highest ones among them are located in complex 1 (N37
and N38). Investigation of the NBO charges in free bpy, 3Amnpy and 3Amdpy2oxaNBE shows that no noticeable global charge transfer occurs between the pyridine units from either bpy or L (3Amnpy or 3Amdpy2oxaNBE) and the Ru centre after L coordination, considering the fact that the NBO charge values in the N-pyridinic atoms are similar in each case. In counterpart, the negative charges in the N-substituted atoms differ 0.15-0.17 units between the 3Amnpy and 3Amdpy2oxaNBE. This probably occurs because of the greater electronegativity of O in relation to N. As a consequence, the electron densities from the N37/ N47 atoms migrate towards the amide-carbonyl moiety. Figure 1. Optimized molecular structures obtained at the B3LYP/
LanL2DZ level for complexes 1 and 2.
Table 1. Selected bond lengths and angles obtained for complexes 1 and
2 (by simulation at the B3LYP/LanL2DZ level) and for [Ru(bpy)3](PF6)2 (from X-ray data)
Atomsa 1 2 1 [Ru(bpy)
3](PF6)2 26 Bond lengths / Å
Ru-eqN1(bpy1) 2.092 2.093 2.056
Ru-eqN7(bpy1) 2.107 2.107
Ru-axN13(bpy2) 2.092 2.085
Ru-eqN19(bpy2) 2.107 2.102
Ru-axN25(L) 2.162 2.208
Ru-eqN31(L) 2.162 2.177
Bond angles / deg eqN1(bpy1)-Ru-eqN7(bpy1) 78.4 78.3 78.6 axN13(bpy2)-Ru-eqN19(bpy2) 78.4 78.6
axN25(L)-Ru-eqN31(L) 92.6 96.5
eqN1(bpy1)-Ru-axN13(bpy2) 88.2 86.1 89.1 eqN7(bpy1)-Ru-axN13(L) 97.3 99.0
eqN1(bpy1)-Ru-axN25(L) 89.6 90.9 eqN7(bpy1)-Ru-axN25(L) 85.8 86.2 eqN19(bpy2)-Ru-eqN31(L) 85.8 85.9 axN13(bpy2)-Ru-eqN31(L) 89.7 86.9 eqN7(bpy1)-Ru-eqN31(L) 98.3 97.5
eqN1(bpy1)-Ru-eqN31(L) 175.8 171.2 173.0 eqN7(bpy1)-Ru-eqN19(bpy2) 174.1 175.7
axN13(bpy2)-Ru-axN25(L) 175.6 173.3 a L = 3Amnpy or 3Amdpy
The relative values of these transfers can indeed be deduced from the NBO orbital occupancies.
Table 3 shows the donation and back-donation charge transfer between different fragments for complexes 1
and 2. It can be observed that, while the back-donation
from the {RuII(bpy)
2} moiety to L is insigniicant, the
donation from L to the {RuII(bpy)
2} moiety involves 0.56
electron. It is interesting to note the CDA between the {RuII(bpy)
2(3Amdpy2-)} and {(-oxaNBE)} fragments,
suggesting that the oxaNBE moiety has a large contribution in the relative charge donation to the {RuII(bpy)
2} moiety.
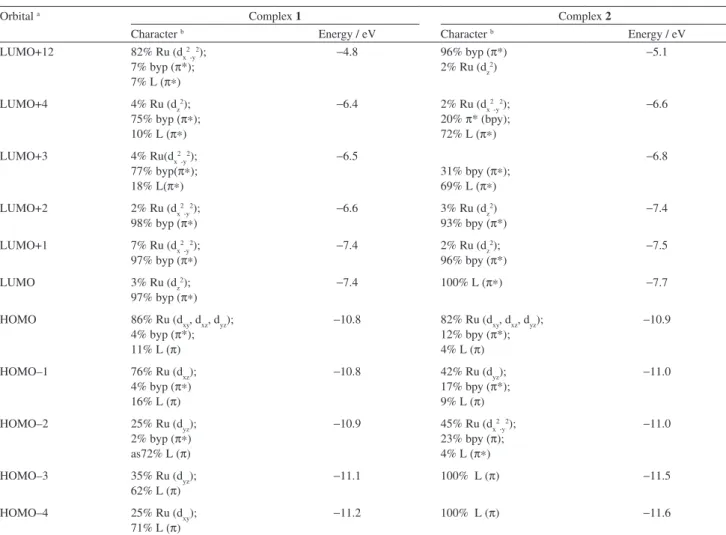
Molecular orbital compositions
Further understanding of the nature of the coordination bonds and the electronic structure in the studied complexes can be provided by analysis of the valence molecular orbital composition. The energies and composition of the frontier molecular orbitals of complexes 1 and 2 are given
in Table 4. The frontier molecular orbital representations are presented as Electronic Supplementary Information (Tables S1 and S2).
The theoretical data for complex 1 show that the HOMO
orbital has a high percentage of Ru non-bonding d-orbital
(86%), as occurs with 2.1 In fact, the Ru orbitals are present
in all HOMOs of 1 shown in the selected frontier orbitals,
but it is not the case for 2. However, the type of L deines
differences between the LUMOs from 1 and 2. The LUMO
in 2 is exclusively located on the 3Amdpy2oxaNBE ligand,
whereas the bpy orbital predominates in the LUMO+1 and LUMO+2.1 For complex 1, the π* orbitals of the
bpy predominate in the LUMO, LUMO+1, LUMO+2 and LUMO+3 with a few Ru antibonding participation. Another substantial difference, considering the analyses of the frontier orbitals from 1 and 2, is the LUMO+12
situated 6 eV above the HOMO, which has a large Ru antibonding character (82%). The HOMO-1 in complex 1
comes basically from the Ru nonbonding orbitals, while the HOMOs −2, −3 and −4 have a sizeable contribution from the 3Amnpy.
The HOMO-LUMO gaps are 3.4 and 3.2 eV for 1 and 2 respectively, whereas the back-donation towards the L
ligand is weak in both cases, as revealed by the charge donation analysis (Table 3). Considering a correlation between the HOMO-LUMO energy gap and the degree of charge delocalization,27 it can be deduced that the Ru-bpy
covalent interaction involves charge-donation from the L ligands to the {RuII(bpy)
2} fragment. Similar values were
observed in the case of L = 3Amdpy2oxaNBE (complex 2).1
The presence of the 3Amdpy2oxaNBE ligand in 2
decreases the oxidation potential of the metal complex to a less positive value compared to the 3Amnpy and bpy derivative complexes (E1/2([Ru(bpy)3]2+) = +1.29, E
1/2(1) =
+1.11 and E1/2(2) = +0.77 V vs. Ag/AgCl in CH3CN). This occurs in agreement with the large Ru-L bond lengths in relation to Ru-bpy.1 Since the HOMO-LUMO gap energies
are unaffected by the different L, the net effect of L = 3Amdpy2oxaNBE in 2 is to lower the energy of the 3MLCT
Table 2. NBO charge analyses calculated at the B3LYP/LanL2DZ level for complexes 1 and 2
Atom Complex Free base
1 2 bpy 3Amnpy 3Amdpy2oxaNBE
Ru +0.63 +0.63
eqN1(bpy1) a -0.46 -0.48 -0.47
eqN7(bpy1) a -0.48 -0.48 -0.47
axN13(bpy2) a -0.46 -0.46
eqN19(bpy2) a -0.48 -0.48
axN25(L) a -0.48 -0.50 -0.48 -0.46
eqN31(L) a -0.48 -0.49 -0.48
N37(substituted) b -0.83 -0.67 -0.85 -0.69
N38(substituted) b -0.83
N47(substituted) b -0.70 -0.67
a N-pyridinic atoms in the pyridine rings; b N-substituted atoms (amine in 1 or amide in 2) in the position 3 of the L pyridine rings.
Table 3. Charge decomposition analyses (CDA) calculated at the B3LYP/ LanL2DZ level for fragments from complexes 1 and 2
Donation / a.u. Back-donation / a.u. {RuII(bpy)
2-} and {-(3Amnpy)2}
0.558 0.058
{RuII(bpy)
2-} and {-(3Amdpy2oxaNBE)}
0.566 0.066
{RuII(bpy)
2(3Amdpy2-)} and {(-oxaNBE)}
states, as previously discussed.1 Thus, when comparing
complex 2 to the parent complex 1, this effect helps to
decouple the 3MLCT from the higher energy 3MC states,
resulting in an emissive 3MLCT, which does not occur in 1.
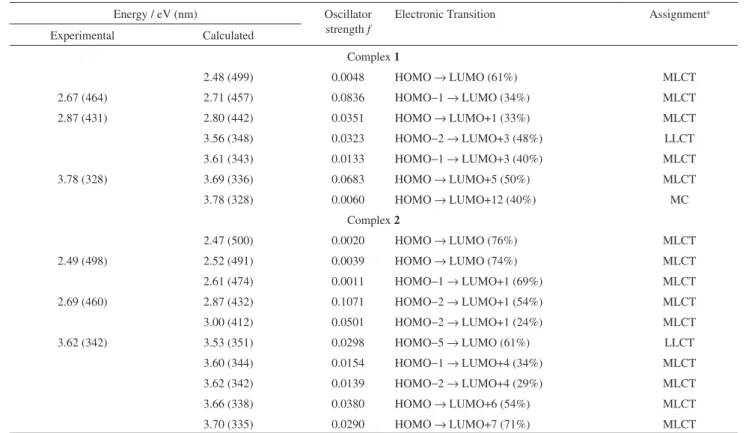
Theoretical and experimental electronic spectrum studies
The experimental and theoretical absorption spectra of complexes 1 and 2 in CH3CN are characterized by two rather
strong bands (Table 5; Figure 2). The relative positions and intensities are dependent on the nonchromophoric ligands. According to the experimental data (Table 5), the lowest energy absorption bands of complex 2 are
red-shifted approximately 30 nm in relation to those of complex 1.
When the oxaNBE monomer-group is present in the substituted pyridine ligand, an extended conjugation is observed (Table 5), lowering the transition energy while increasing the oscillator strength. Similar tendencies are observed for the oxidation of RuII to RuIII (Table 6). The
higher metal oxidation potential of complex 1, compared to
that of 2, relects the stabilization of the +2 oxidation state
by the 3Amnpy, the less σ donor ligand. Figure 3 points out that more electron-withdrawing ligands decrease the electron density at the metal center for the related series of complexes and lead to more positive potentials than the complexes with more electron-donating ligands.
The calculated spectrum of complex 1 presents four MLCT
absorption transitions at 2.71 eV (HOMO-1→LUMO), 2.80 eV (HOMO→LUMO+1), 3.61 eV (HOMO-1→ LUMO+3) and 3.69 eV (HOMO→LUMO+5) (Table 5).
For complex 2, the lowest energy calculated absorption
could be assigned as a HOMO-2→LUMO+1 electronic transition with an MLCT nature (Table 5). There are four electronic transitions at higher energies: HOMO-1→ LUMO+4, HOMO-2→LUMO+4, HOMO→LUMO+6 and HOMO→LUMO+7. The energy differences among these transitions are not signiicant, ca. 0.1 eV, although the differences in the calculated intensities are substantial (f = 0.015-0.038).
Table 4. Molecular orbital characters and energies for complexes 1 and 2 obtained from calculations at the B3LYP/LanL2DZ level
Orbital a Complex 1 Complex 2
Character b Energy / eV Character b Energy / eV
LUMO+12 82% Ru (dx2
-y2); 7% byp (π*); 7% L (π∗)
−4.8 96% byp (π*)
2% Ru (dz2)
−5.1
LUMO+4 4% Ru (dz2);
75% byp (π∗); 10% L (π∗)
−6.4 2% Ru (dx2
-y2); 20% π* (bpy); 72% L (π∗)
−6.6
LUMO+3 4% Ru(dx2
-y2); 77% byp(π∗); 18% L(π∗)
−6.5
31% bpy (π∗); 69% L (π∗)
−6.8
LUMO+2 2% Ru (dx2
-y2); 98% byp (π∗)
−6.6 3% Ru (dz2) 93% bpy (π*)
−7.4
LUMO+1 7% Ru (dx2
-y2); 97% byp (π∗)
−7.4 2% Ru (dz2); 96% bpy (π*)
−7.5
LUMO 3% Ru (dz2);
97% byp (π∗)
−7.4 100% L (π∗) −7.7
HOMO 86% Ru (dxy, dxz, dyz); 4% byp (π*); 11% L (π)
−10.8 82% Ru (dxy, dxz, dyz); 12% bpy (π*); 4% L (π)
−10.9
HOMO–1 76% Ru (dxz);
4% byp (π∗) 16% L (π)
−10.8 42% Ru (dyz); 17% bpy (π*); 9% L (π)
−11.0
HOMO–2 25% Ru (dyz);
2% byp (π∗) as72% L (π)
−10.9 45% Ru (dx2 -y2); 23% bpy (π); 4% L (π∗)
−11.0
HOMO–3 35% Ru (dyz);
62% L (π)
−11.1 100% L (π) −11.5
HOMO–4 25% Ru (dxy);
71% L (π)
−11.2 100% L (π) −11.6
a HOMO is Highest Occupied Molecular Orbital; LUMO is Lowest Unoccupied Molecular Orbital; b d
Table 5. Experimental and simulated (TDDFT) 1MLCT absorption spectrum data for complexes 1 and 2
Energy / eV (nm) Oscillator
strength f
Electronic Transition Assignmenta
Experimental Calculated
Complex 1
2.48 (499) 0.0048 HOMO → LUMO (61%) MLCT
2.67 (464) 2.71 (457) 0.0836 HOMO−1 → LUMO (34%) MLCT
2.87 (431) 2.80 (442) 0.0351 HOMO → LUMO+1 (33%) MLCT
3.56 (348) 0.0323 HOMO−2 → LUMO+3 (48%) LLCT
3.61 (343) 0.0133 HOMO−1 → LUMO+3 (40%) MLCT
3.78 (328) 3.69 (336) 0.0683 HOMO → LUMO+5 (50%) MLCT
3.78 (328) 0.0060 HOMO → LUMO+12 (40%) MC
Complex 2
2.47 (500) 0.0020 HOMO → LUMO (76%) MLCT
2.49 (498) 2.52 (491) 0.0039 HOMO → LUMO (74%) MLCT
2.61 (474) 0.0011 HOMO−1 → LUMO+1 (69%) MLCT
2.69 (460) 2.87 (432) 0.1071 HOMO−2 → LUMO+1 (54%) MLCT
3.00 (412) 0.0501 HOMO−2 → LUMO+1 (24%) MLCT
3.62 (342) 3.53 (351) 0.0298 HOMO−5 → LUMO (61%) LLCT
3.60 (344) 0.0154 HOMO−1 → LUMO+4 (34%) MLCT
3.62 (342) 0.0139 HOMO−2 → LUMO+4 (29%) MLCT
3.66 (338) 0.0380 HOMO → LUMO+6 (54%) MLCT
3.70 (335) 0.0290 HOMO → LUMO+7 (71%) MLCT
a MLCT is Metal to Ligand Charge Transfer; LLCT is Ligand to Ligand Charge Transfer; MC is Metal-Centered.
Figure 2. Experimental (dash line) and simulated (TDDFT, solid line) absorption spectra of complexes 1 and 2 in CH3CN.
Table 6. Electronic absorption spectra (λ; ε) and electrochemical data (E1/2) for complexes 1, 2 and related cis-complexes
Complexes λ / nm
(ε / L mol-1 cm-1)
E1/2 / V a
[Ru(bpy)2(CH3CN)2](PF6)228 426 (8,700) b +1.43 [Ru(bpy)3](PF6)21,28 345 (4,500) c
420 (8,035) 451 (14,000)
+1.25
[Ru(bpy)2(py)2](PF6)21,28 338 (15,900) c 460 (9,200)
+1.25
Complex 11,31 328 (14,768) c 430 (7,220) 464 (8,119)
+1.14
[Ru(bpy)2(4Amnpy)2](PF6)2 31,d 337 (11,600) c 454 (6,800) 490 (7,700)
+0.95
Complex 21 342 (16,367) c
460 (10,247) 498 (9,762)
+0.77
[RuCl2(bpy)2] 28 380 (9,400) b 556 (9,400)
+0.27
[RuCl(bpy)2(3Amnpy)](PF6) 31,d 350 (11,480) c 506 (7,000)
+0.74
[RuCl(bpy)2(py)](PF6) 28 358 (10,000) b 505 (8,200)
+0.72
a In 0.1 mol L-1 NBu
4(PF6)/CH3CN solution vs. Ag/AgCl; b in CH2Cl2 solution; c in CH
In this context, for complex 2,it is noteworthy that the
experimental absorption at 3.62 eV could be originated from the highest illed Ru dπ orbitals to the π* orbital of 3Amdpy2oxaNBE. Furthermore, the calculations do not predict any MC transitions in the region studied for complex
2 (up to LUMO+20). These features correlate with the
electrochemical behavior and structural features, such as the photophysical and photochemical results described in the next section.
Apart from the MLCT transitions, complex 1 has
an MC transition at 3.78 eV (328 nm), on account of the HOMO→LUMO+12 transition. Because of the low intensity (f = 0.0060), this transition is obscured by the intense MLCT transition at 3.69 eV (f = 0.0683). The ground state calculation predicts 0.09 eV (726 cm-1)
as the energy gap between the first MLCT and the MC states.
Replacement of bpy by 3Amdpy2oxaNBE does not have any significant influence on the position of the highest MLCT absorption at ca. 340 nm (3.64 eV) of the {RuII(bpy)
2} moiety (Table 6), although the ε value
increases signiicantly on account of the contribution of the Ru→3Amdpy2oxaNBE transition. In contrast, the
3Amnpy ligand shifts this band to 328 nm (3.78 eV), which matches the MC transition as attributed by the simulated spectrum. For a series of related [RuII(bpy)
2Lx)]q+
complexes (Table 6), the experimental energy of this transition decreases in the order 3Amnpy (3.78 eV) > py (3.67 eV) > 3Amdpy2oxaNBE (3.62 eV) > bpy (3.59 eV) > 4Amnpy (3.56 eV) > Cl− (3.26 eV).
Table 7 presents the lowest energy bands for complexes
1 and 2 in different media. The absorption bands are solvent
sensitive in agreement with the MLCT assignments.
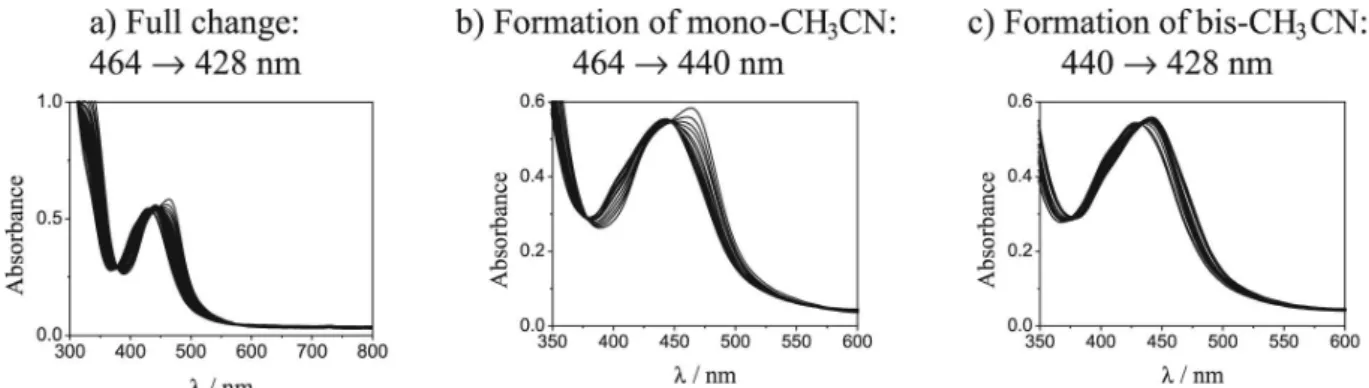
Photochemistry studies
As reported in the earlier paper, complex 2 was
photochemically unreactive.1 On the other hand, the
photolysis of complex 1 in CH3CN caused photoreaction
with a quantum yield of 0.26 at λexc = 440 nm, producing the cis-[Ru(bpy)2(CH3CN)2]2+ ion.1 In order to better
understand this photochemical process, the changes in the UV-vis spectra of complex1 ina CH3CN solution during
photolysis with 440 nm light (I0 = 1×10⁻⁹ einstein s-1)
were analyzed (Figure 4a). A progressive depletion of the absorption band is noted at 464 nm, with concomitant blue shifts to 440 nm (Figure 4b) and then to 428 nm (Figure 4c). This implies that the formation of the cis-[Ru(bpy)2(3Amnpy)(CH3CN)]2+ ion with λ
max = 440 nm
occurs, followed by a second coordination of the π acceptor CH3CN ligand, leaving a complex with a much smaller extinction coeficient when compared to complex 1. The
λmax of the mono-solvent complex coincides with the irradiation wavelength. Then, after 20 measurements, a depletion of the absorption of the irst photoproduct species can be observed due to secondary photolysis (Figure 4b-c). The new band proile is similar to that shown by the cis-[Ru(bpy)2(CH3CN)2]2+ complex ion (Table 6). From these UV-vis spectrophotometer time scale measurements, these reactions occur quite smoothly. Isosbestic points are preserved even at a very high conversion. The quantum yield Figure 3. Correlation between MLCT λabs and E1/2 values for complexes
1, 2 and related complexes in CH3CN.
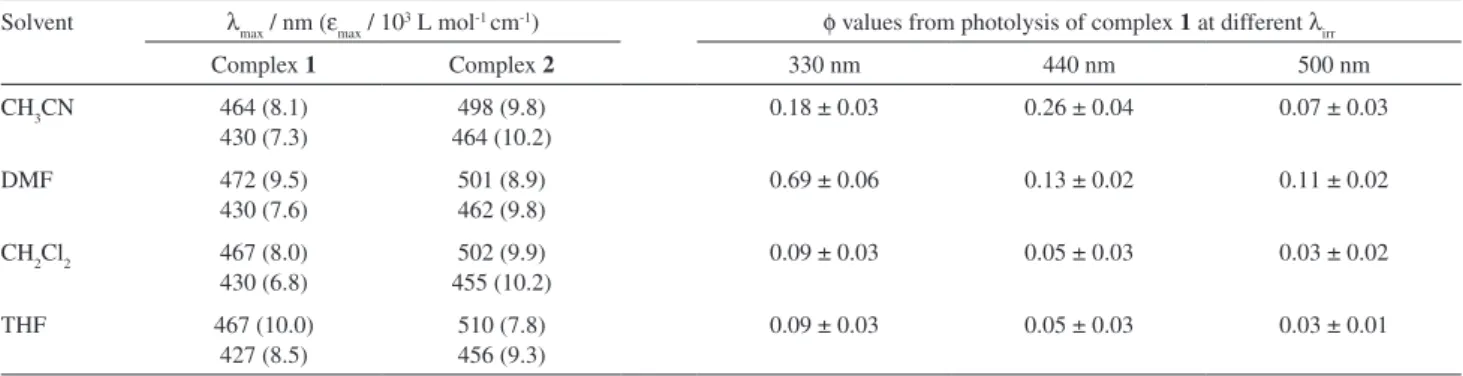
Table 7. Spectroscopic (λmax ; εmax) and quantum yield (φ) data in various solvents
Solvent λmax / nm (εmax / 103 L mol-1 cm-1) φ values from photolysis of complex 1 at different λ irr
Complex 1 Complex 2 330 nm 440 nm 500 nm
CH3CN 464 (8.1)
430 (7.3)
498 (9.8) 464 (10.2)
0.18 ± 0.03 0.26 ± 0.04 0.07 ± 0.03
DMF 472 (9.5)
430 (7.6)
501 (8.9) 462 (9.8)
0.69 ± 0.06 0.13 ± 0.02 0.11 ± 0.02
CH2Cl2 467 (8.0) 430 (6.8)
502 (9.9) 455 (10.2)
0.09 ± 0.03 0.05 ± 0.03 0.03 ± 0.02
THF 467 (10.0)
427 (8.5)
510 (7.8) 456 (9.3)
for the 3Amnpy photosubstitution at 440 nm was dependent on the irradiation time up to at least 3% decomposition of complex 1 due to the secondary photolysis.
The presences of the mono and bis-acetonitrile complexes during photolysis of 1 were confirmed by
1H NMR measurements. A CD
3CN solution of
cis-[Ru(bpy)2(3Amnpy)2]2+ was irradiated at room temperature
with 420 nm light (I0 = 1x10⁻⁷ einstein s-1). The 1H NMR
spectra were recorded with 30 min time intervals (Figure 5). Simple intensity arguments tell us that the peaks with chemical shifts between 6.9 and 9.5 ppm are from the bipyridine and Amnpy hydrogens.29 During
irradiation, decreasing and increasing resonance peaks were observed, indicating photorelease of 3Amnpy for 2 h. In particular, the signal at 9.0 ppm decreases and a new signal at 9.4 ppm appears. This indicates the replacement of 3Amnpy by acetonitrile in the metal coordination sphere. The shift of the bipyridine hydrogen signal at 9.0 ppm to a higher frequency indicates the change of the σ-donor nature of the trans ligand (3Amnpy versus acetonitrile). It is interesting to note that the shift of the 3Amnpy NH2 signal from 4.42 to 4.52 ppm also indicates that the 3Amnpy is released. After four irradiation cycles, a
well-resolved 1H NMR spectrum is observed and assigned to
the bis-acetonitrile complex. It differs from the spectrum of the sample irradiated for 30 min, attributed to the cis-[Ru(bpy)2(3Amnpy)(CH3CN)]2+ complex ion. The
final 1H NMR spectrum profile was identical to the 1H NMR spectrum of the cis-[Ru(bpy)
2(CH3CN)2]
(PF6)2 species synthesized thermally, confirming the attribution.
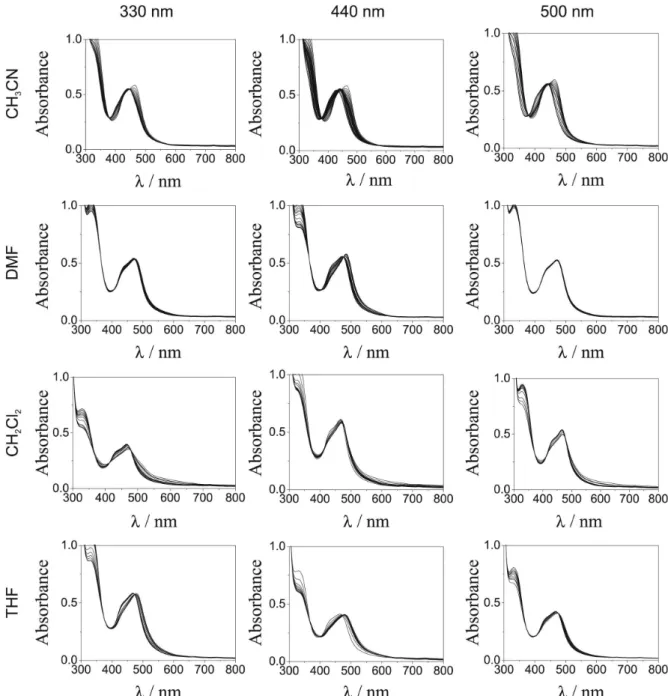
Considering the observed stepwise photosubstitution of
1 in CH3CN, photolyses in different solvents were carried
out as a function of the irradiation wavelength (Figure 6). While thermal reactions were not observed up to 10 h at 25.0 °C, in all the irradiated solutions changes in the UV-vis spectra with blue shifted final spectra were observed. Table 7 shows the initial quantum yield data calculated for wavelengths where the ε value ratios between the starting complex 1 and the products were the largest.
Photolysis at 330 nm provides large quantum yields (Table 7). It is relevant that this wavelength is close to the calculated λmax of the lowest-energy spin-allowed MC absorption band (Table 5).
The quantum yield data in Table 7 involve two simultaneous variables: λmax(MLCT) and λirr. The variation of λirr should not influence the quantum yields if the deactivation from upper to lower energy excited states were 100% eficient. However, it is clear from Table 7 that photosubstitution quantum yields are quite dependent on λirr for all the studied cases. Furthermore, the interconversions to common states, presumably the lowest in energies, do not occur with 100% eficiency.
The signiicant decrease in the φ values and the large dependence on λirr suggest a change in the nature of the lowest excited state from 3MC to 3MLCT. These results,
combined with the absorption experiments and DFT calculations, conirm that the lowest energy reactive excited state is a 3MC for 1.
The tendency in the photochemical properties of complexes 1 and 2 parallels the changes in the photophysical
properties found in the emission spectra.1
Figure 4. Changes in the absorption spectra resulting from the continuous photolysis of complex 1 in CH3CN using 440 nm light.
Figure 5.1H NMR spectra of complex 1 in CD
Figure 6. Changes in the absorption spectra resulting from the continuous photolysis of complex 1 in various solvents and different λirr at 25.0 oC.
Emission spectra
The emission spectra of 1, 2 and [Ru(bpy)3](PF6)2
complexes in 4:1 EtOH/MeOH glasses at room and liquid nitrogen (77 K) temperatures are characterized by broad unstructured bands. These consisted of well-defined vibrational progressions with the energy differences between the two peaks ranging from 1,182 to 1,275 cm-1
(8.46 to 7.84 nm), close to the 3MLCT transition
found for [Ru(bpy)3](PF6)2 at 1,262 cm-1 (7.92 nm)
(Figure 7).
In sharp contrast with the photochemical results, substitution of bpy in [Ru(bpy)3](PF6)2 by 3Amdpy2oxaNBE
shifts the MLCT emission maximum to 565 nm, while the 3Amnpy ligand shifts this band to 590 nm. The excited state energy (0-0 energy) can be calculated according to the equation: E0-0 = ν
max + 1.29 ∆ν1/2.30 Although proposed
for a Gaussian band shape, this relationship provides a qualitative basis for comparing the spectra of closely analogous complexes. For 2, [Ru(bpy)3](PF6)2 and 1, the
νmax and ∆ν1/2 values, deined as the full width at half maximum, are 2.20, 2.16, 2.10 and 0.16, 0.11, 0.11 eV, respectively. Thus E0-0 values are 2.42, 2.29 and 2.24 eV
according to the assumption of a Gaussian band shape for
2, [Ru(bpy)3](PF6)2 and 1 respectively. From these results,
Figure 7. Emission spectra of [Ru(bpy)3](PF6)2 (a),complex 2 (b) and complex 1 (c) excited at 450 nm in EtOH-MeOH (4:1) at room temperature
(rt) and 77 K.
Scheme 2. Ground and excited state energy diagrams for complexes 1 and 2.
Energy
1Ru-bpy
hν'
3Ru-bpy
1MC
0.09 eV
1Ru-bpy
3MC
products N
N H
H
L =
L =
1Ru-bpy
hν'
3Ru-bpy
1Ru-bpy
1Ru-3AmdpyoxaNBE
O
N O
O H
N
N
H N
cis-[Ru(2,2'-bipyridyne)2Lx)](PF6)2
hν
hν
1 and 2 is 0.18 eV. The difference seems to be reasonable
on account of the change in the electron densities about the metal centers after the attachment of the oxaNBE group to the substituted pyridine ligand.
Concerning the excitation of complex 2 at 450 nm at
room temperature, the position of the emission maximum does not change when compared to the corresponding [Ru(bpy)3](PF6)2 emission (577 nm). Complex 1 shows an
emission at 592 nm with intensity much lower than that of complex 2 (Figure 7).
The observation of a weaker MLCT luminescence at the longer wavelength and the high sensitivity of φ for λirr
suggest that complex 1 has moved from the reactive to the
unreactive category at room temperature, although still showing some intermediate nature (Table 7).
Scheme 2 shows a simple relative energy diagram illustrating the difference between the photochemical and photophysical properties of complexes 1 and 2. For
complex 1, the energy gap between the MLCT state and the
MC state is only 0.09 eV. Thus, the MLCT state lies close to the MC state and it is reached by direct light excitation. Consequently, the intersystem crossing will rapidly decay to the lower 3MLCT states, which is weakly emissive
and will crossover preferentially to the 3MC state. The
presence of the 3Amdpy2oxaNBE ligand in 2 displaces the 3MC states towards energy levels which are much higher
than the 3MLCT state. Therefore, when 2 is irradiated in
the MLCT band, the system rapidly decays to the lower
3MLCT state, increasing its population and the emission
without photoreaction.
Conclusions
The theoretical and experimental results demonstrated that the orbital nature of the lowest excited states changed when the pyridine ligands were connected to the oxaNBE group. The disturbances in the orbital nature introduced by this type of group can be used to tune the photochemical and photophysical properties of [Ru(bpy)2(X-substituted-py)x]2+
complexes: whereas complex 1 is photochemically reactive,
complex 2 shows luminescence and is photochemically
unreactive. The oxaNBE-substituted group showed unique properties when compared to other X-substituted-pyridines. This change is also related to the high degree of electron delocalization in the {RuII(3Amdpy
2oxaNBE)} unit on
account of the more extended π conjugated system of
the 3Amdpy2oxaNBE ligand. Therefore, attaching the oxanorbornene unit to the 3Amnpy ligand seemed to be an effective way to prolong the MLCT (Ru→bpy) triplet
lifetime.
As suggested by a referee, it cannot be ruled out that the lack of photoreaction from complex 2 is related to the
chelating property of the ligand. Photochemical labilization of one of the two pyridines would not completely detach the ligand from the metal, offering a chance for a back coordinating reaction, which is obviously impossible in the case of complex 1.
Supplementary Information
Electronic Supplementary Information (contour plots of selected frontier molecular orbitals obtained from DFT calculations for complexes 1 and 2, Tables S1 and S2) is
available free of charge at http://jbcs.sbq.org.br, as a PDF ile.
Acknowledgments
We thank the inancial support from FAPESP (Proc. 06/57577-4), CAPES and CNPq.
References
1. Inglez, S. D.; Lima, F. C. A.; Silva, A. B. F.; Simioni, A. R.; Tedesco, A. C.; Daniel, F. S. J.; Lima-Neto, B. S.; Carlos, R. M.; Inorg. Chem. 2007, 46, 5744.
2. Weck, M.; Polymer Int. 2007, 56, 453.
3. Pearson, P.; Bond, A. M.; Deacon, G. B.; Forsyth, C.; Spiccia, L.; Inorg. Chim. Acta2008, 361, 601.
4. Kitao, O.; Sugihara, H.; Inorg. Chim. Acta2008, 361, 561. 5. Mishra, D.; Barbieri, A.; Sabatini, C.; Drew, M. G. B.; Figgie,
H. M.; Sheldrick, W. S.; Chattopadhyay, S. K.; Inorg. Chim. Acta2007, 360, 2231.
6. Lundqvist, M. J.; Galoppini, E.; Meyer, G. J.; Persson, P. J.; Phys. Chem. A 2007, 111, 1487.
7. Balzani, V.; Bergamini, G.; Marchioni, F.; Ceroni, P.; Coord. Chem. Rev.2006, 250, 1254.
8. Jun, L.; Lian-Cai, X.; Jin-Can, C.; Kang-Cheng, Z.; Liang-Nian, J.; J. Phys. Chem. A 2006, 110, 8174.
9. Chen, B. Z.; Metera, K.; Sleiman, H. F.; Macromolecules 2005, 38, 1084.
10. Guillemoles, J. F.; Barone, V.; Joubert, L.; Adamo, C.; J. Phys. Chem. A 2002, 106, 11354.
11. Monat, J. E.; Rodriguez, J. H.; McCusker, J. K.; J. Phys. Chem. A 2002, 106, 7399.
12. Calvert, J. G.; Pitts, J. N.; Photochemistry, 2nd ed., Wiley: New
York, 1967.
13. Calvert, J. M.; Caspar, J. V.; Binstead, R. A.; Westmoreland, T. D.; Meyer, T. J.; J. Am. Chem. Soc. 1982, 104, 6620.
Supplementary Information
0103 - 5053 $6.00+0.00
*e-mail: [email protected]
Tuning of Photochemical and Photophysical Properties of [Ru
II(2,2’-bipyridine)
2L
x]
Complexes using Nonchromophoric Ligand Variations
Simone D. Inglez,a Francisco C. A. Lima,a Mariana R. Camilo,b Juliana F. S. Daniel,b
Evania D. A. Santos,a Benedito S. Lima-Neto*,a and Rose M. Carlosb
aInstituto de Química de São Carlos, Universidade de São Paulo, CP 780, 13650-970 São Carlos-SP, Brazil
bDepartamento de Química, Universidade Federal de São Carlos, CP 676, 13565-905 São Carlos-SP, Brazil
Table S1. Contour plots of selected LUMO molecular orbitals obtained from DFT calculations for complexes 1 and 2
Orbital Complex 1 Complex 21
LUMO+12
LUMO+2
LUMO+1
Table S2. Contour plots of selected HOMO molecular orbitals obtained from DFT calculations for complexes 1 and 2
Orbital Complex 1 Complex 21
HOMO
HOMO–1
C.; Pople, J. A.; Gaussian 03, revision C.02, Gaussian, Inc.: Wallingford , 2004.
15. Kohn, W.; Sham, L.; J. Phys. Rev.1965, 140, A1133. 16. Lee, C.; Yang, W.; Parr, R. G.; Phys. Rev. 1998, 37, B785. 17. Becke, A. D.; J. Chem. Phys. 1993, 98, 5648.
18. Hay, P. J.; Wadt, W. R.; J. Chem. Phys. 1985, 82, 270. 19. Wadt, W. R.; Hay, P. J.; J. Chem. Phys.1985, 82, 284. 20. Hay, P. J.; Wadt, W. R.; J. Chem. Phys. 1985, 82, 299. 21. Gorelski, S. I.; AOMix: Program for Molecular Orbital Analysis,
York University: Toronto, 1997; http://www.sg-chem.net. 22. Gorelsky, S. I.; Lever, A. B. P.; J. Organomet. Chem. 2001, 635,
187.
23. Casida, M. E. In Recent Advances in Density Functional Methods; Chong, D.P., ed., World Scientiic: Singapore, 1995. 24. Stratmann, R. E.; Scuseria, G. E.; Frisch, M. J.; J. Chem. Phys.
1998, 109, 8218.
25. Gorelsky, S. I.; Swizard, Department of Chemistry, York University: Toronto, 1999; http://www.sg-chem.net.
26. Rillema, D. P.; Jones, D. S.; Woods, C.; Levy, H. A.; Inorg. Chem. 1992, 31, 2935.
27. Gorelsky, S. I.; Basumallick, L.; Vura-Weis, J.; Sarangi, R.; Hodgson, K. O.; Hedman, B.; Fujisawa, K.; Solomon, E. I.; Inorg. Chem. 2005, 44, 4947.
28. Durham, B.; Walsh, J. R.; Carter, C. L.; Meyer, T. J.; Inorg. Chem. 1980, 19, 860.
29. Hitchcock, P. B.; Seddon, K. R.; Turp, J. E.; Yousif, Y. Z.; Zora, J. A.; Constable, E.; Wernberg, C. O.; J. Chem. Soc., Dalton Trans. 1988, 1837.
30. Lever, A. B. P.; Inorganic Electronic Spectroscopy, 2nd ed.,
Elsevier: Amsterdam, 1984.
31. Ellis, D. E.; Margerum, L. D.; Murray, L. W.; Meyer, T. J.; Inorg. Chem. 1983, 22, 1283.
Received: April 13, 2009
Web Release Date: October 30, 2009
 2 (a), complex 2 (b) and complex 1 (c) excited at 450 nm in EtOH-MeOH (4:1) at room temperature (rt) and 77 K.](https://thumb-eu.123doks.com/thumbv2/123dok_br/18994929.461896/10.892.101.383.108.522/figure-emission-spectra-complex-complex-excited-etoh-temperature.webp)
