Article
J. Braz. Chem. Soc., Vol. 22, No. 4, 780-789, 2011.Printed in Brazil - ©2011 Sociedade Brasileira de Química 0103 - 5053 $6.00+0.00
A
*e-mail: [email protected]
Synthesis, Characterization and Photovoltaic Properties of
Di-Anchoring Organic Dyes
Tzi-Yi Wu,a,b Ming-Hsiu Tsao,aShyh-Gang Su,a H. Paul Wang,c,d Yuan-Chung Lin,e Fu-Lin Chen,a Cheng-Wen Changa and I-Wen Sun*,a,c
aDepartment of Chemistry, cSustainable Environment Research Center and dDepartment of
Environmental Engineering, National Cheng Kung University, Tainan 701, Taiwan
bDepartment of Polymer Materials, Kun Shan University, Tainan 71003, Taiwan
eInstitute of Environmental Engineering, National Sun Yat-Sen University, Kaohsiung 804, Taiwan
Três novos pigmentos orgânicos contendo grupamentos carbazol, iminodibenzil e fenotiazina como doadores de elétrons e anéis rodanina bi-ancoradores como receptores de elétrons, foram sintetizados e avaliados como fotossensibilizadores em células solares. Células solares empregando corantes com grupos fenotiazinas como unidades transportadora de buracos e anéis rodanina biancoradores como receptores de elétrons exibiram uma densidade de fotocorrente de curto
circuito de 10,6 mA cm-2, voltagem de circuito aberto de 0,658 V e fator de preenchimento de
0,7, correspondendo a uma eiciência de conversão total de 4,91% sob luz solar padrão AM 1.5.
Three new organic dyes comprising carbazole, iminodibenzyl and phenothiazine moieties, as electron donors and di-anchoring rhodanine rings as the electron acceptors, were synthesized and evaluated for use in dye-sensitized solar cells. A solar cell employing dye-containing phenothiazine as a hole-transporting unit and di-anchoring rhodanine rings as the electron
acceptors exhibits a short circuit photocurrent density of 10.6 mA cm-2, an open-circuit voltage
of 0.658 V and a ill factor of 0.7, corresponding to an overall conversion eficiency of 4.91% at standard AM 1.5 sunlight.
Keywords: dye-sensitized solar cells, electrochemistry, organic dyes, electron donor, rhodanine
Introduction
Compounds with extending conjugated π-electron systems are of importance in a wide variety of applications, such as optical, electronic, optoelectronic and magnetic materials.1-7 The development of
organic electroactive and photoactive materials has progressed signiicantly in recent years due to their potential applications in optoelectronic devices, such as electroluminescence (EL) devices, photovoltaic devices, thin ilm transistors and solid-state lasers.8,9
Donor-acceptor (D-A) organic molecules are one of the most important conjugated organic materials; they have attracted considerable attention as electroluminescent (EL) materials for organic light-emitting diodes (OLEDs) and as photovoltaic materials for organic solar
cells. The physical and chemical properties of donor-acceptor materials can be modiied by selecting suitable donor moieties or/and acceptor moieties.
Studies of donor (D)-π (bridge)-acceptor (A) chromophores have found that the intramolecular charge transfer characteristics of these molecules in the excited state are essential for dye sensitizers in dye-sensitized solar cells (DSSCs),10 since the light-induced
intramolecular electron transfer can easily occur from the electron donor to the electron acceptor through the π-bridge, which favors photocurrent generation.11 D-A
anchoring units, such as carboxylic groups, are necessary for eficient dye adsorption on the surface of TiO2 to
favor charge injection.12
Recently, impressive photovoltaic performance has been reported for some organic coumarin,13 indoline,14
merocyanine,15 and hemicyanine dyes.16 Reasonable
photo-conversion efficiencies have been achieved with some push-pull-type organic chromophores.17
However, due to the formation of dye aggregates on the semiconductor surface and the presence of unstable radical species during redox reaction cycles, many organic dyes exhibit conversion efficiency and operational stability lower than those of metal-complex dyes in DSSCs. Thus, it is desired to develop eficient stable organic dyes which do not aggregate. Phenothiazine is a well-known heterocyclic compound that has electron rich sulfur and nitrogen heteroatoms. Iminodibenzyl is a diphenylamine, wherein two ortho positions are joined by a dimethylene bridge. Phenothiazine-based organic dyes have found numerous applications in electronics and optoelectronics, including light-emitting diodes,18 photovoltaic cells, thin ilm
transistors,19 and electrochromic cells.20,21 The highly
nonplanar structure of iminodibenzyl and phenothiazine units impedes π-stacking aggregation and intermolecular excimer formation, making them suitable for diverse optoelectronic applications.22
In previous work, Wu et al.23 have reported some
organic dyes with a rhodanine ring as mono-anchoring acceptors. In the present work, new metal-free carbazole, iminodibenzyl and phenothiazine sensitizers with two electron acceptors of rhodanine-3-acetic acid are reported. These acceptor-donor-acceptor π-conjugated dyes with an amine derivative act as the electron donors and two rhodanine-3-acetic acid moieties acts as the anchoring group for attachment on the metal oxide and as the electron acceptors. A π-conjugated methane unit connects the donor and acceptor units. We investigate the electron-donating nature and structural variations of the amine unit and study its optical, electrochemical and photovoltaic properties.
Experimental
Chemicals
All starting materials and tetrabutylammonium perchlorate (TBAP) were commercial available and used as received. 1,2-dimethyl-3-propylimidazolium iodide (DMPImI) were synthesized and puriied according to a procedure in the literature.24
Preparation of dye-sensitized TiO2 electrode (photoanode) and counter electrode
The working TiO2 electrode (photoanode) and counter
electrode for dye-sensitized solar cells were prepared as follows. F-doped tin oxide (FTO) glass plates (3 mm thick, 7 Ω cm-2) were irst cleaned in a cleaning detergent aqueous
solution with an ultrasonic bath for 15 min and rinsed with water and ethanol. Then, the FTO electrodes were immersed into 40 mmol L-1 TiCl
4 (aqueous) at 70
oC for 30 min and
rinsed with water and ethanol. Two kinds of TiO2 paste,
containing nanocrystalline (ca. 25 nm) TiO2 (Degussa P25,
paste A) and 500 nm submicroparticle TiO2 (TOHO, Japan,
paste B), respectively, were prepared using a previously reported procedure.25 To prepare paste A, commercial titania
powder (3 g, Degussa P25) was ground in a mortar with a small amount of water (1 mL) containing acetylacetone (0.1 mL), which was added to prevent reaggregation of the particles. After the TiO2 particles were dispersed, the paste was
diluted by the slow addition of water (3 mL) under continued grinding and a surfactant, Triton X-100 (0.05 mL), was added to facilitate the spreading of the colloid on the substrate. Paste A was kept in ultrasound bath for about 24 h, at 28 oC.
Paste B was prepared by a similar method. The spin coating procedure for paste A was repeated to get the appropriate thickness of TiO2 ilms (12 µm). After paste A was dried at
125 oC, paste B was coated two more times, in such a way that
the TiO2 ilms with 500 nm particles for the scattering layer
were ca. 4 µm thick. The electrodes coated with TiO2 pastes
were gradually heated (5 oC min–1) under airlow up to 450 oC,
which was kept for 30 min. The electrodes were treated with 40 mmol L-1 solution of TiCl
4 in (solvent ethanol). The TiO2
ilms were then rinsed with water and ethanol and sintered again at 450 oC for 30 min. An active area of 0.5 × 0.5 cm
was selected from a sintered electrode. The electrodes were immersed in a 5 × 10⁻⁴ mol L-1 solution of dye containing
tetrahydrofuran (THF). Dye coatings were applied at room temperature for 24-30 h. The dye-adsorbed TiO2 ilms were
taken out and rinsed with dry ethanol. The rinsing process was repeated several times to remove unbound dyes completely. Finally, the dye-adsorbed TiO2 ilms were dried in air. Counter
electrodes were prepared by sputtering a 50 nm thick platinum layer on an FTO substrates using a Hitachi E 1045 instrument and controlling the amount of sputtered platinum with a quartz crystal thickness monitor. The thicknesses of the TiO2 ilms
were determined by proilometry.
DSSC assembly
The dye adsorbed TiO2 electrode and Pt-counter electrode
them with hot-melt ionomer ilm (25 µm thick, Solaronix) as a spacer. A drop of electrolyte solution [0.1 mol L-1 LiI,
0.05 mol L-1 I
2, 0.6 mol L-1 DMPII, 0.5 mol L-1 tert-butyl
pyridine (TBP) in acetonitile (ACN)] was injected through a hole in the counter electrode, which was then sealed with hot-melt ionomer ilm and glass. The electrolyte was introduced into the cell and sealed with AB epoxy 906 Adhesive for 30 min. The working area of the electrode was 0.25 cm2.
Characterization of the dyes and photovoltaic measurements of the solar cells
The 1H spectra were obtained on a Bruker 400 MHz
FT-NMR. Chemical shifts were reported in ppm relative to tetramethylsilane d units. The absorption spectra of the dyes in solution and adsorbed on TiO2 ilms were recorded
on a Cary 100 UV-Vis spectrophotometer. Fluorescence measurements were carried out using a Hitachi F-4500 luorescence spectrophotometer. Cyclic voltammetry was performed using an electrochemical workstation (CH instruments Inc., CHI, model 750A) and conducted using 0.1 mol L-1 tetrabutylammonium perchlorate (TBAP) as the
supporting electrolyte. The working electrode was a glassy carbon electrode, the auxiliary electrode was a Pt wire and the reference electrode was Ag/Ag+. The scan rate was
100 mV s-1 and the temperature was 25 oC. Ferrocene was
added to each sample solution at the end of the experiments. The ferrocenium/ferrocene (Fc/Fc+) redox couple was used
as an internal potential reference. The potential vs. SCE in DMF was calibrated according to a procedure published by Matsui et al.26 The photovoltaic measurements of the
DSSCs were performed using a Newport M-66907 450 W xenon light source through an infrared blocking ilter and a Keithley 2400 digital source meter linked to a computerized control and data acquisition system. The light intensity was 1000 W m-2 under an AM 1.5 light source. Cell temperatures
were kept at 25 oC during the illumination. Light intensity
was calibrated using a mono-Si reference solar cell (PVM134). The incident photon-to-current conversion eficiency (IPCE) as a function of excitation wavelength was measured using an incident light 300 W xenon lamp. A 300 W xenon arc lamp solar simulator (#91160A, Oriel) with an AM 1.5 Globe ilter (#59044, Oriel) was used to measure the I-V characteristics of the quasi-solid-state DSSC. The illumination was ixed at 100 mW cm-2 using
a reference solar cell and meter (#91150, Oriel).
Computation methods
The geometric and electronic properties of the carbazole, iminodibenzyl and phenothiazine-containing
dyes S1-S3 were obtained using the Gaussian 03 program package.27 The calculation was optimized using B3LYP
(Becke three parameter hybrid function with Lee-Yang-Perdew correlation functions) with the Pople 6–31+g(d) atomic basis set.
Results and Discussion
Synthesis and structure of sensitizers
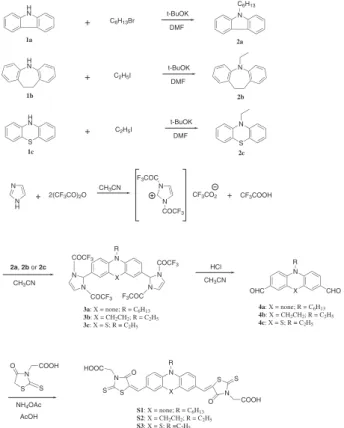
In Figure 1, S1-S3 are the carbazole, iminodibenzyl and phenothiazine-containing dyes, respectively. The rhodanine dialdehydes 4a-c were prepared using the well-known Vilsmeier reaction in a way similar to that reported by Chen et al.28
However, the Vilsmeier reaction gave low yields for the dialdehyde compounds. Therefore, a two-step strategy was used for their preparation.29 N-hexylcarbazole (2a),
N-ethyliminodibenzyl (2b) and N-ethylphenothiazine (2c) were irst treated with a reactive derived from the reaction of imidazole and triluoroacetic anhydride to give the respective intermediates containing triluoroacetyl (CF3CO) groups (3a-c) that could be readily hydrolyzed to
dialdehydes (4a-c). The inal products S1, S2 and S3 were obtained by the condensation of the respective aldehyde
+
H
N t-BuOK
C2H5I
N R CHO X 1a N R X S N O COOH S
NH4OAc AcOH N S S O COOH OHC N S S O HOOC DMF N N H
+ 2(CF3CO)2O
CH3CN N N F3COC
COCF3
CF3CO2 + CF3COOH
2a, 2b or 2c
N R
X
CH3CN N
N N
N
COCF3
F3COC
COCF3
COCF3
HCl CH3CN
3a: X = none; R = C6H13
3b: X = CH2CH2; R = C2H5
3c: X = S; R = C2H5
4a: X = none; R = C6H13
4b: X = CH2CH2; R = C2H5
4c: X = S; R = C2H5
S1: X = none; R = C6H13
S2: X = CH2CH2; R = C2H5
S3: X = S; R =C2H5
H N H N 1b 1c S + + C6H13Br
C2H5I
t-BuOK DMF t-BuOK DMF N 2a N N 2b 2c S C6H13
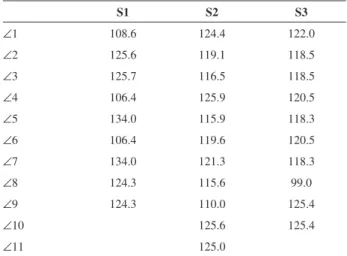
with rhodanine-3-acetic acid via the Knoevenagel reaction in the presence of ammonium acetate. The structural differences of those photosensitizers (Table 1 and Figure 2) were evaluated from their optimized structures. When viewed from the top, the angles (∠1) of the S1 carbazole, the S2 iminodibenzyl and the S3 phenothiazine rings are 108.6o, 124.4o and 122.0o, respectively, implying that
the addition of a dimethylene bridge and sulfur units signiicantly increases the angle (∠1) of nitrogen atoms. The angle between two phenyl units in the carbazole unit (∠4) is 106.4o; however, the angle between the phenyl unit
and dimethylene bridge inside the iminodibenzyl unit (∠4) is 125.9o. This can be attributed to the incorporation of a
dimethylene bridge between two phenyl units increasing the steric hindrance, which increases the angles ∠1 and ∠4. The angle of the S3 phenothiazine sulfur atom (∠8) is 99.0o, which is smaller than that of the phenothiazine
nitrogen atom (∠1: 122.0o). This may be attributed to the
character between nitrogen and sulfur atoms.
When viewed from the front, the carbazole unit is coplanar with two rhodanine rings; the dimethylene bridge decreases the coplanarity of the iminodibenzyl unit and induces the nonplanar geometry of S2. The phenothiazine is bent along the N-S axis, as conirmed by X-ray structural analysis.30 The nitrogen atom in the phenothiazine moiety
induces a nonplanar geometry similar to that of the sp3-hybridized pyramidal nitrogen.
Optical properties
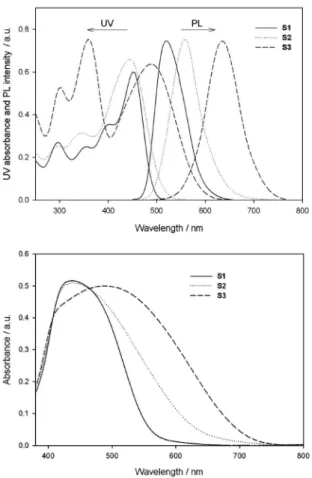
The UV-Vis absorption and emission spectra of S1,
S2 and S3 in DMF solution and the absorption spectra of the corresponding dyes adsorbed on TiO2 film are
shown in Figure 3 and the λmax values are listed in Table 2.
The absorption spectrum of S2 in DMF exhibits two
Table 1. Optimized geometric parameters (angle, degree) of S1, S2
and S3
S1 S2 S3
∠1 108.6 124.4 122.0
∠2 125.6 119.1 118.5
∠3 125.7 116.5 118.5
∠4 106.4 125.9 120.5
∠5 134.0 115.9 118.3
∠6 106.4 119.6 120.5
∠7 134.0 121.3 118.3
∠8 124.3 115.6 99.0
∠9 124.3 110.0 125.4
∠10 125.6 125.4
∠11 125.0
Figure 2. Optimized geometric structures of (a) S1 top view, (b) S1
front view, (c) S2 top view, (d) S2 front view, (e) S3 top view and (f)
major prominent bands, appearing at 300-400 nm and at 400-600 nm, respectively. The former is ascribed to a localized aromatic π–π* transition and the latter is of charge-transfer character between the iminodibenzyl-based donor and the rhodanine-3-acetic acid,31 providing eficient charge
separation at the excited state. Under similar conditions, the
S1 sensitizer had an absorption peak at 450 nm that was slightly red-shifted relative to the peaks of S2, implying that the incorporation of the carbazole unit leads to better coplanarity than that achieved by the iminodibenzyl unit.
Wherein the phenothiazine unit substitutes the carbazole or iminodibenzyl unit in S3, the absorption maximum red-shifted to 489 nm. The signiicant red shift
of S3 relative to S1 and S2 is due to stronger intramolecular charge transfer in S3 as a result of phenothiazine being a stronger electron-donating ring than are carbazole and iminodibenzyl. Red-shifting in the absorption spectra helps utilize solar light. The absorption spectra of S1-S3 on a TiO2 electrode are broader than those in DMF solution.
When the S1 and S3 sensitizers are adsorbed on the TiO2
electrode, there is a slight blue shift from 450 to 442 nm and 489 to 488 nm (Table 2), respectively, implying that dyes adsorbed on the TiO2 surface have partial H-type
aggregates. Under similar conditions, the S2 sensitizer has a slight red shift from 445 to 447 nm after being adsorbed on the TiO2 electrode. The molar extinction coeficients
(ε) of S1, S2 and S3 are 26360 L mol-1 cm-1 (at 450 nm),
24040 L mol-1 cm-1 (at 445 nm) and 25480 L mol-1 cm-1
(at 489 nm), respectively; larger than that of Ru organic complex (14200 L mol-1 cm-1),32 indicating that they are
beneicial to light harvesting.
Figure 3(a) shows the emission spectra of the dyes in DMF solution. The excitation wavelength for emission was the maximum absorption in the visible region. The corresponding data are summarized in Table 2. It can be seen that the maximum emission wavelengths in DMF solution follow the order S3 > S2 > S1. The maximum emission wavelength was red-shifted when iminodibenzyl was substituted by phenothiazine (558 nm for S2
and 635 nm for S3), but the peak was blue-shifted by introducing a 9-hexylcarbazole moiety as an electron donor (521 nm for S1). S3 exhibited a relatively large Stokes shift, which could be attributed to the geometrically relaxed structure of the phenothiazine center upon excitation.33 A
large Stokes shift is advantageous because it minimizes interference by the excitation light in the measurement of the luorescence emission.
Electrochemical properties
To evaluate the thermodynamic allowed electron transfer processes from the excited dye molecule to the conduction band of TiO2, cyclic voltammetry (CV)
measurements were performed. The electrochemical behavior of S1-S3 in the anodic direction was irreversible.
Table 2. Absorption and emission properties of S1, S2 and S3 dyes
Dye Absorption Emission Stokes shifta / nm
λabsb / nm ε / L mol-1 cm-1 (at λ
abs) λabsb / nm (on TiO2) λemb / nm
S1b 295, 355, 403, 450 26360 (450 nm) 442 521 71
S2 296, 346, 445 24040 (445 nm) 447 558 113
S3 298, 357, 489 25480 (489 nm) 488 635 146
aStokes shift = λ
em(solution) − λabs(solution); babsorption and emission spectra were measured in DMF solution.
Figure 3. (a) Absorption and emission spectra of S1, S2 and S3 in DMF (10–5 mol L-1), λ
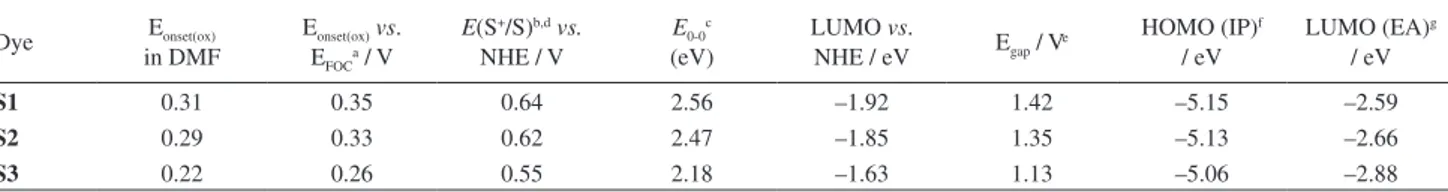
The ground-state oxidation potentials (Eox) of the three dyes
were measured and the results summarized in Table 3. The ferrocenium/ferrocene (Fc/Fc+) redox couple was used as
internal reference. The Eonset(ox) of S3 is less positive than
those of S1 and S2, indicating that the phenothiazine units are much more effective in lowering the ionization potential than are iminodibenzyl and carbazole units.
The ground-state oxidation potentials E(S+/S) of S1, S2
and S3, corresponding to the highest occupied molecular orbital (HOMO) level of sensitizers, were estimated to be 0.64, 0.62 and 0.55 V, respectively, vs. the normal hydrogen electrode (NHE). The HOMO levels of S1 and S2 (0.64 and 0.62 V vs. NHE, respectively) are more positive than that of S3 (0.55 V vs. NHE), indicating more eficient dye regeneration for S1 and S2.
The excited-state oxidation potentials E(S+/S*), which
relect the lowest occupied molecular orbital (LUMO) level of the sensitizers, play an important role in the electron injection process. The excited-state oxidation potential E(S+/S*) was calculated using:34
E(S+/S*) = E(S+/S) – E
0−0 (1)
where E0−0 is the zeroth-zeroth transition value obtained
from the intersection of the normalized lowest energy absorption peak and highest energy luorescence peak. The LUMO levels of S1 and S2 (–1.92 and –1.85 V vs. NHE, respectively) are more negative than that of S3 (–1.63 vs. NHE), indicating that S1 and S2 dyes have more eficient electron injection.
Figure 4 shows a schematic energy diagram of a DSSC based on dyes attached to a nanocrystalline TiO2
ilm deposited on conducting luorine-doped tin oxide (FTO) glass. The oxidation potentials (approximately the HOMO levels) of the dyes range from 0.55 to 0.64 V vs. NHE. These values are more positive than the I3
−/I− redox
potential (0.42 V vs. NHE),35 indicating that the oxidized
dye formed after electron injection into the conduction band of TiO2 thermodynamically accepted electrons from
I− ions in the electrolyte. The LUMO levels of these dyes
were estimated from the difference between Eox and E0-0;
they are in the range of –1.63 to –1.92 V vs. NHE, which are more negative than the conduction band edge of TiO2
(−0.5 V vs. NHE).35 Provided that an energy gap (between
dye LUMO and TiO2 conduction band (CB)) of 0.2 eV is
necessary for eficient electron injection,36 the driving force
is suficient for eficient charge injection. Thus, the electron injection process from the excited dye molecule to the TiO2
conduction band and the subsequent dye regeneration are energetically permitted. Such electronic structures thus ensure a favorable exothermic low of charges throughout the photo-electric conversion. However, in an actual device, molecules have interfaces or other molecules as neighbors, which a consequent modiication of electronic structure and molecular conformation implying in differences in the energy levels.
Since energy levels in several cases, such as values obtained using XPS (X-ray photoelectron spectroscopy) or UPS (ultraviolet photoelectron spectroscopy), referring these values to vacuum, we evaluate the ionization potential (IP) and electroafinity (EA) to realize and control the electrical and optical properties.37-39 IP gives a good
indication of whether a given p-type dopant is capable of ionizing a compound, whereas EA is important for comprehending the n-type doping process. The positions of the HOMO (IP) levels of S1, S2 and S3 relative to a vacuum were estimated to be –5.15, –5.13 and –5.06 eV, respectively. Similarly, the LUMO (EA) levels of S1, S2
and S3 relative to a vacuum were estimated to be –2.59, –2.66 and –2.88 eV, respectively.
Molecular orbital calculations
To investigate the molecular structure and electron distribution of the organic dyes, the geometries of the organic dyes were optimized using density functional theory (DFT) calculations at a B3LYP/6-31+g (d) level. The isodensity surface plots of frontier orbitals involved in these
Table 3. Electrochemical properties and band gaps of S1, S2 and S3 dyes
Dye Eonset(ox) in DMF
Eonset(ox)vs. EFOCa / V
E(S+/S)b,dvs. NHE / V
E0-0c (eV)
LUMO vs.
NHE / eV Egap / Ve
HOMO (IP)f / eV
LUMO (EA)g / eV
S1 0.31 0.35 0.64 2.56 –1.92 1.42 –5.15 –2.59
S2 0.29 0.33 0.62 2.47 –1.85 1.35 –5.13 –2.66
S3 0.22 0.26 0.55 2.18 –1.63 1.13 –5.06 –2.88
aE
FOC = –0.04 V vs. Ag/Ag+; bthe ground-state oxidation potentials E(S+/S) were measured in DMF containing 0.1 mol L-1 tetrabutylammonium perchlorate as supporting electrolyte using a glassy carbon working electrode, a Pt counter electrode and a Ag/Ag+ reference electrode; cthe E
0-0 value was estimated from the cross-section of absorption and emission spectra; dthe excited-state oxidation potential E(S+/S*) was calculated from E(S+/S) – E
0−0; eEgap is the energy gap between E(S+/S*) of the dye and the conduction band level of TiO
2 (−0.5 V vs. NHE); fionization potential: IP = – 4.8 – (Eonset(ox) – EFOC); gelectron afinity: EA − E
Figure 4. Schematic energy level diagram for a DSSC based on dyes attached to a nanocrystalline TiO2 ilm deposited on conducting FTO glass.
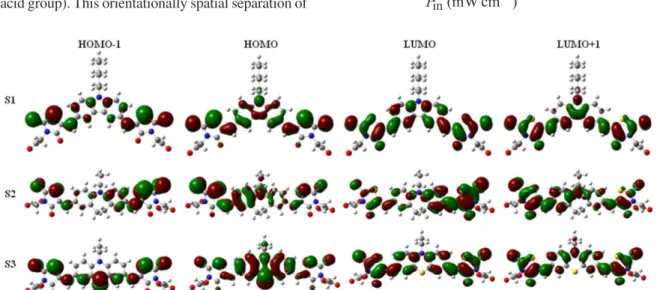
Figure 5. Computed isodensity surfaces of HOMO and LUMO orbitals of S1, S2 and S3. transitions are shown in Figure 5. The frontier molecular
orbitals of S1-S3 reveal that the HOMO levels of the dye molecules are dominated by a π orbital contribution from the carbazole, iminodibenzyl and phenothiazine units, with a small contribution from the rhodanine-3-acetic acid moiety and that the HOMO−1 levels are a π orbital mainly over the dimethylene bridge and partial rhodanine ring, with a small contribution from the carbazole, iminodibenzyl and phenothiazine units. However, the LUMO levels are largely π*, with major contributions from the phenyl groups of donors, the dimethylene bridge and the rhodanine ring. The LUMO+1 levels are also π* mainly across the dimethylene bridge and rhodanine ring. At the excited state (LUMO) with light illumination for S1-S3 dyes, intramolecular charge transfer occurs, resulting in electron density movement from the donor group to the acceptor groups (rhodanine-3-acetic acid group). This orientationally spatial separation of
HOMO and LUMO is ideal for dye sensitized solar cells, as it facilitates rapid interfacial electron injection from the excited dyes to the TiO2 conduction band and slows down
the recombination of injected electrons in TiO2 with oxidized
sensitizers due to their remoteness.
Photovoltaic performance
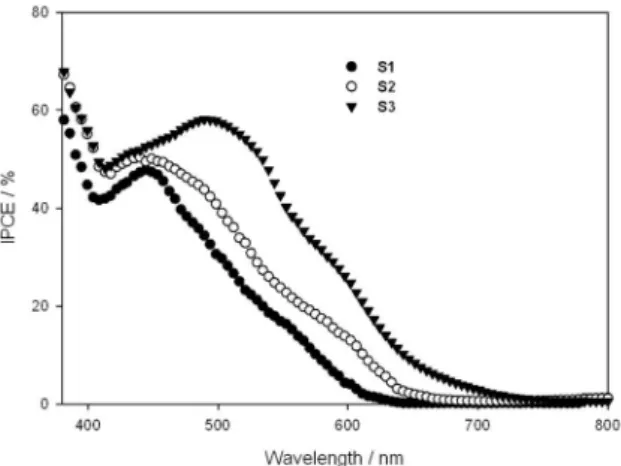
The sensitizers were used for fabricating DSSCs to explore current–voltage characteristics. Figure 6 shows the spectra of incident photon-to-current eficiency (IPCE) for
S1-S3-based solar cells. The IPCE values were measured according to the following equation:40
where λ is the wavelength, short-circuit current (Jsc) and φ is
the power of the incident radiation per unit area. The IPCE values of dyes as a function of excitation wavelength plots show that the IPCEs of S1, S2 and S3 are 48-58% in the spectral range of 450 to 520 nm. The IPCE spectrum covers the whole visible region in the range of 400-750 nm, allowing the DSSC to eficiently convert solar light into electricity.
A typical photocurrent–photovoltage (I–V) curve for cells based on S1-S3 is shown in Figure 7. The detailed photovoltaic parameters are summarized in Table 4. The solar-energy-to-electricity conversion eficiency (η) of the DSSCs is calculated from short-circuit current (Jsc),
the open-circuit photovoltage (Voc), the ill factor (FF) and
the intensity of the incident light (Pin) according to the
As demonstrated in Table 4, S1 gives a light-to-electricity conversion eficiency of 2.81% with a short-circuit photocurrent density (Jsc) of 7.61 mA cm
-2, a V oc
of 0.589 V and a FF of 0.63 under the standard global AM 1.5 solar condition. Under similar conditions, the photovoltaic parameters (Jsc, Voc and η) of cells
with the S2 sensitizer are 9.95 mA cm-2, 0.597 V and
3.59%, respectively, and those of the S3 sensitizer are 10.60 mA cm-2, 0.658 V and 4.91%, respectively. The
eficiency improvement exhibited by the S3 sensitizer
is probably due to the stronger electron-donating ability of the phenothiazine unit when electrons transfer from the phenothiazine unit to the rhodanine-3-acetic acid group, and a possible vectorized photon-induced charge transfer of the phenothiazine unit with respect to electrodes. This character could not only depress the interaction between molecules resulting in the energy quenching of the excited states, but also suppress the I3− ions in the electrolyte to the TiO2 surface that is in
favor of higher Voc.
Pathways of photon-to-current conversion in dye-sensitized solar cells
Figure 8 shows a schematic representation of a DSSC based on the S2 photosensitizer. A thin ilm of electrolyte solution (I−/I
3− dissolved in an organic solvent) is
sandwiched between the TiO2 electrode and a transparent
conducting electrode (counter electrode).
The general design principle for metal-free organic dyes or sensitizers consists of a donor-acceptor-substituted π-conjugated bridge and an anchoring group to the TiO2 which is attached to the side of the acceptor
(Figure 9). Light-harvesting dyes absorb solar radiation incident on them, which results in their excitation. The excited molecules pass their energy by transferring electrons onto a nanocrystalline TiO2 substrate onto
which they are adsorbed. The injected electrons in
Figure 6. Action spectra of IPCE for DSSCs based on S1, S2 and S3 dyes under the same conditions.
Figure 7. Current density-voltage characteristics for S1, S2 and S3 DSSCs under illumination of simulated solar light (AM 1.5, 100 mW cm-2).
Table 4. Photovoltaic performances of DSSCs based on S1, S2 and S3 dyes Dye Voc / V Jsc / mA cm-2 Fill factor (FF) η / %
S1 0.589 7.61 0.63 2.81
S2 0.597 9.95 0.61 3.59
S3 0.658 10.60 0.7 4.91
aMeasured under irradiation of AM 1.5 G simulated solar light (100 mW cm-2) at room temperature, 0.25 cm2 working area; bthe concentration of dye is 5 × 10⁻⁴ mol L-1 in tetrahydrofuran (THF), and 0.6 mol L-1 tetrabutylammonium iodide (TBAI), 0.1 mol L-1 LiI, 0.05 mol L-1 I
2, 0.6 mol L-1 DMPII, and 0.5 mol L-1 4-tert-butylpyridine (TBP) in dry acetonitrile (ACN) as electrolyte.
Figure 9. Design principle of organic dyes for TiO2 photoanodes in DSSCs.
Figure 8. Schematic representation for a DSSC based on the S2
photosensitizer, I−/I
the conduction band of TiO2 are transported toward
the counter electrode through the external load. At the counter electrode, a redox couple is utilized (usually iodide-triiodide) to regenerate the dye so the process can be repeated.
Conclusion
We synthesized three di-anchoring organic dyes containing carbazole, iminodibenzyl and phenothiazine units, respectively, as donors to compare and study their optical, electrochemical and photovoltaic properties. The electron-donating groups of organic sensitizers show different interactions on a TiO2 surface. The LUMO values
of S1 (–1.92 V), S2 (–1.85 V) and S3 (–1.63 V) are more than 0.2 eV negative than the conduction band edge of TiO2 (−0.5 V vs. NHE), implying that the driving force
is suficient for eficient charge injection. The HOMO values of S1 (0.64 V), S2 (0.62 V) and S3 (0.55 V) are suficiently more positive than the I3
−/I− redox potential
(0.42 V vs. NHE). DSSCs based on the S3 dye showed the best photovoltaic performance: a maximum IPCE of 58%, a short-circuit photocurrent density (Jsc) of 10.60 mA cm-2,
a Voc of 0.658 V and a FF of 0.7, corresponding to an overall conversion eficiency of 4.91% under 100 mW cm-2
irradiation. The proposed di-anchoring organic dyes are promising candidates for DSSCs.
Supplementary Information
Supplementary data are available free of charge as PDF ile at http://jbcs.sbq.org.br.
Acknowledgement
The authors would like to thank the National Science Council of the Republic of China for inancially supporting this project.
References
1. Shirota, Y.; J. Mater. Chem. 2005, 15, 75.
2. Aquino, J. M.; Rocha-Filho, R. C.; Bocchi, N.; Biaggio, S. R.;
J. Braz. Chem. Soc.2010, 21, 324.
3. Ensai, A. A.; Hajian, R.; Ebrahimi, S.; J. Braz. Chem. Soc.
2009, 20, 266.
4. Wu, T. Y.; Wang, H. C.; Su, S. G.; Gung, S. T.; Lin, M. W.; Lin, C. B.; J. Chin. Chem. Soc.2010, 57, 44.
5. Peralta-Zamora, P.; J. Braz. Chem. Soc.2010, 21, 1621. 6. Paprocki, A.; dos Santos, H. S.; Hammerschitt, M. E.; Pires,
M.; Azevedo, C. M. N.; J. Braz. Chem. Soc. 2010, 21, 452.
7. Ferreira, J.; Girotto, E. M.; J. Braz. Chem. Soc.2010, 21, 312. 8. Kulkarni, A. P.; Tonzola, C. J.; Babel, A.; Jenekhe, S. A.; Chem.
Mater. 2004, 16, 4556.
9. Wu, T.-Y.; Lee, N.-C.; Chen, Y.; Synth. Met.2003, 139, 263. 10. Wu, T.-Y.; Tsao, M. H.; Chen, F. L.; Su, S. G.; Chang, C. W.;
Wang, H. P.; Lin, Y. C.; Ou-Yang, W.-C.; Sun, I. W.; Int. J. Mol. Sci.2010, 11, 329.
11. Chen, Z.; Li, F.; Huang, C.; Curr. Org. Chem.2007, 11, 1241. 12. Yahagida, S.; Senadeera, G. K. R.; Nakamura, K.; Kitamura,
T.; Wada, Y.; J. Photoch. Photobio. A2004, 166, 75.
13. Hara, K.; Tachibana, Y.; Ohga, Y.; Shinpo, A.; Suga, S.; Sayama, K.; Sugihara, H.; Arakawa, H.; Sol. Energ. Mat. Sol. C.2003,
77, 89.
14. Horiuchi, T.; Miura, H.; Uchida, S.; Chem. Commun.2003, 3036.
15. Sayama, K.; Tsukagoshi, S.; Hara, K.; Ohga, Y.; Shinpou, A.; Abe, Y.; Suga, S.; Arakawa, H.; J. Phys. Chem. B2002, 106, 1363.
16. Yao, Q.-H.; Shan, L.; Li, F.-Y.; Yin, D.-D.; Huang, C.-H.;
New J. Chem.2003, 27, 1277.
17. Jung, I.; Lee, J. K.; Song, K. H.; Song, K.; Kang, S. O.; Ko, J.;
J. Org. Chem.2007, 72, 3652.
18. Alam, M. M.; Jeneke, S. A.; Chem. Mater.2002, 14, 4775. 19. Babel, A.; Jenekhe, S. A.; J. Phys. Chem. B2003, 107, 1749. 20. Fungo, F.; Jenekhe, S. A.; Bard, A. J.; Chem. Mater.2003, 15,
1264.
21. Sapp, S. A.; Sotzing, G. A.; Reynolds, J. R.; Chem. Mater.1998,
10, 2101; Fungo, F.; Jenekhe, S. A.; Bard, A.; J. Chem. Mater.
2004, 15, 1264.
22. Wu, T.-Y.; Chen, Y.; J. Polym. Sci. Pol. Chem.2002, 40, 4452. 23. Wu, T.-Y.; Tsao, M. H.; Chen, F. L.; Su, S. G.; Chang, C. W.;
Wang, H. P.; Lin, Y. C.; Sun, I. W.; J. Iran. Chem. Soc.2010,
7, 707.
24. Jang, S. Y.; Seshadri, V.; Khil, M. S.; Kumar, A.; Marquez, M.; Mather, P. T.; Sotzing, G. A.; Adv. Mater. 2005, 17, 2177. 25. Wang, P.; Zakeeruddin, S. M.; Comte, P.; Charvet, R.;
Humphry-Baker, R.; Grätzel, M.; J. Phys. Chem. B2003, 107, 14336. 26. Matsui, M.; Hashimoto, Y.; Funabiki, K.; Jin, J.; Yoshida, T.;
Minoura, H.; Synth. Met.2005, 148, 147.
Farkas, O.; Malick, D. K.; Rabuck, A. D.; Raghavachari, K.; Foresman, J. B.; Ortiz, J. V.; Cui, Q.; Baboul, A. G.; Clifford, S.; Cioslowski, J.; Stefanov, B. B.; Liu, G.; Liashenko, A.; Piskorz, P.; Komaromi, I.; Martin, R. L.; Fox, D. J.; Keith, T.; Al-Laham, M. A.; Peng, C. Y.; Nanayakkara, A.; Challacombe, M.; Gill, P. M. W.; Johnson, B.; Chen, W.; Wong, M. W.; Gonzalez, C.; Pople, J. A.; Gaussian 03, Revision C.01, Gaussian, Inc.: Wallingford, CT 2004.
28. Chen, Y.; Wu, T.-Y.; Polymer2001, 42, 9895.
29. Oelschlager, H.; Peters, H. J.; Arch. Pharm.1987, 320, 379. 30. McDowell, J. J. H.; Acta Crystallogr. 1976, B32, 5.
31. Liang, M.; Xu, W.; Cai, F.; Chen, P.; Peng, B.; Chen, J.; Li, Z.;
J. Phys. Chem. C2007, 111, 4465.
32. Nazeeruddin, M. K.; Kay, A.; Rodicio, I.; Humpbry-Baker, R.; Miiller, E.;Liska, P.;Vlachopoulos, N.; Grätzel, M.; J. Am. Chem. Soc.1993, 115, 6382.
33. Lai, R. Y.; Fabrizio, E. F.; Lu, L.; Jenekhe, S. A.; Bard, A. J.;
J. Am. Chem. Soc.2001, 123, 9112.
34. Chen, K. F.; Hsu, Y. C.; Wu, Q. Y.; Yeh, M. C. P.; Sun, S. S.;
Org. Lett.2009, 11, 377.
35. Hagfeldt, A.; Grätzel, M.; Chem. Rev. 1995, 95, 49.
36. Ito, S.; Zakeeruddin, S. M.; Humphry-Baker, R.; Liska, P.; Charvet, R.; Comte, P.; Nazeeruddin, M. K.; Péchy, P.; Takata, M.; Miura, H.; Uchida, S.; Grätzel, M.; Adv. Mater.2006, 18, 1202.
37. Micaroni, L.; Nart, F. C.; Hümmelgen, I. A.; J. Solid State Electrochem.2002, 7, 55.
38. Wu, T.-Y.; Chen, Y.; J. Polym. Sci. Pol. Chem.2002, 40, 3847. 39. Wu, T.-Y.; Chen, Y.; J. Polym. Sci. Pol. Chem.2002, 40, 4570. 40. Boschloo, G.; Hagfeldt, A.; J. Phys. Chem. B2005, 109, 12093.
Supplementary Information
S
I
J. Braz. Chem. Soc., Vol. 22, No. 4, S1-S10, 2011. Printed in Brazil - ©2011 Sociedade Brasileira de Química 0103 - 5053 $6.00+0.00
*e-mail: [email protected]
Synthesis, Characterization and Photovoltaic Properties of
Di-Anchoring Organic Dyes
Tzi-Yi Wu,a,b Ming-Hsiu Tsao,aShyh-Gang Su,a H. Paul Wang,c,dYuan-Chung Lin,e
Fu-Lin Chen,a Cheng-Wen Changa and I-Wen Sun*,a,c
aDepartment of Chemistry, cSustainable Environment Research Center and dDepartment of
Environmental Engineering, National Cheng Kung University, Tainan 701, Taiwan
bDepartment of Polymer Materials, Kun Shan University, Tainan 71003, Taiwan
eInstitute of Environmental Engineering, National Sun Yat-Sen University, Kaohsiung 804, Taiwan
Synthetic procedure of carbazole, iminodibenzy and
phenothiazine-containing dyes
(
S1
-
S3
)
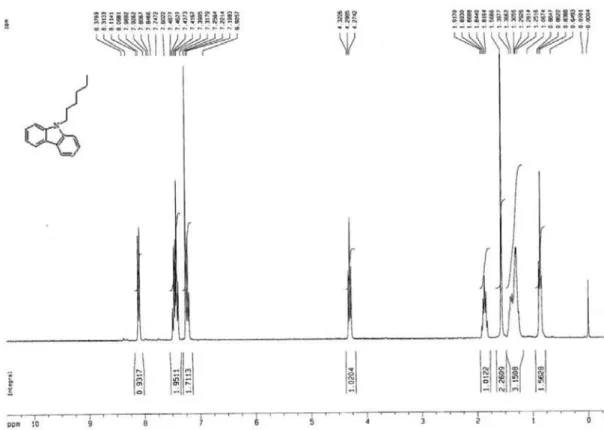
N-hexylcarbazole (2a)
To a 250 mL two necked lask was added with carbazole (16.72 g, 100 mmol), 100 mL DMF and potassium
tert-butoxide (12.4 g, 110 mmol). After stirring for 30 min, the mixture was added with N-bromohexane (17.34 g, 105 mmol) and allowed to relux overnight. Pouring it into a large amount of water precipitated 9-hexylcarbazole, which were collected by iltration and then recrystallized twice in methanol. The yield was 71% (mp 53 oC). 1H NMR (CDCl
3),
d (ppm): 8.13-8.10 (d, 2H), 7.50-7.40 (m, 4H), 7.26-7.21 (m, 2H), 4.31 (t, J 7.0 Hz, 2H), 1.88 (quintet, J 5.4 Hz, 2H), 1.39 (m, 2H), 1.31 (m, 4H), 0.88 (t, J 3.3 Hz, 3H). Elemental analysis calculated (%) for C18H21N: C, 86.01%; H, 8.42%;
N, 5.57%. Found: C, 85.96%; H, 8.40%; N, 5.55%.
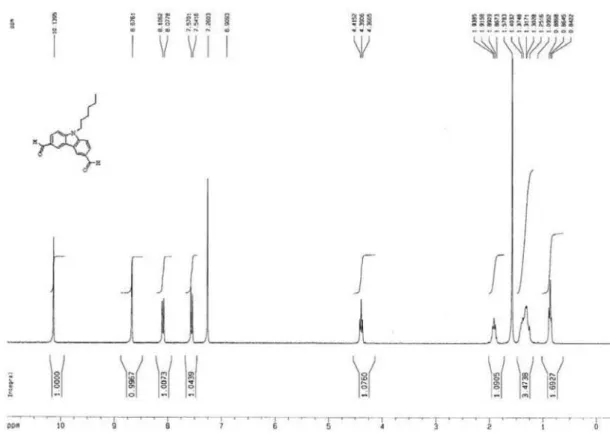
9-Hexylcarbazole-3,6-dicarbaldehyde (4a)
To a 50 mL glass reactor were added with imidazole (0.718 g, 10.5 mmol) and 10 mL acetonitrile. The mixture were added under stirring with triluoroacetic anhydride (5.775 g, 27.5 mmol) within 5 min, treated dropwise with 9-hexylcarbazole (2a: 1.257 g, 5 mmol) and then reluxed for 4 h. After adjusting pH > 7 with saturated aqueous solution of Na2CO3, the appearing precipitates were isolated by iltration
and washed with water to give a precipitate. The precipitate was dissolved in CH2Cl2, washed with saturated aqueous
NaHCO3, dried over anhydrous MgSO4 and the solvent was removed under reduced pressure to afford 3,6-bis(1,3-bistriluoracetyl-4,5-dihydroimidazole-2-yl)-9-hexylcarbazole
(3a: 3.55 g , 92%), which was used for the next step without further puriication. To a 250 mL glass reactor were added with 3a (6.2 g, 8 mmol), 148 mL acetonitrile and 77 mL 1.9 mol L-1 HCl. The mixture was reluxed for 3 h and was
extracted with ethyl ether after cooling and neutralization. The crude product obtained by removing ethyl ether were puriied by column chromatography (silica gel, 60-200 mm, neutrality; n-hexane/ethyl acetate = 4/1) to give 4a (1.75 g,
71%, mp 143 oC). 1H NMR (CDCl
3, ppm): d 10.04 (s, 2H),
8.83 (s, 2H), 8.01 (d, 2H), 7.80 (d, 2H), 4.46 (t, 2H), 1.69 (m, 2H), 1.16 (m, 6H), 0.73 (t, 3H). Elemental analysis calculated (%) for C20H21NO2: C, 78.15; H, 6.89; N, 4.56.
Found: C, 77.98; H, 6.81; N, 4.65.
5,5’-(9-Hexyl-carbazole-3,6-diyl)bis(methan-1-yl-1-ylidene) bis(4-oxo-2-thioxothiazolidin-3-yl-5-ylidene)diacetic acid (S1)
To a stirred 4a (0.615 g, 2 mmol) in CH3COOH (30 mL)
were added rhodanine-3-acetic acid (0.794 g, 4.15 mmol) and ammonium acetate (0.125 g, 1.625 mmol). The mixture was heated to 120 oC and the reaction was continued for 2 h
at the temperature. Then the reaction mixture was allowed to cool to room temperature. The solid was collected by iltration and washed with water thoroughly. After drying in air, the crude product was puriied by column chromatography on silica gel with CH2Cl2/methanol
(10:1, v/v) as eluant to give S1 in 93% yield, mp > 200 oC.
1H NMR (DMSO-d
6), d (ppm): 8.55 (s, 2H, -CH=), 8.03
(s, 2H, aromatic hydrogen), 7.84 (d, 2H, aromatic hydrogen), 7.76 (d, 2H, aromatic hydrogen), 4.76 (s, 4H, O=C-CH2-N),
4.47 (t, 2H, N-CH2-), 1.79 (m, 2H, N-CH2-CH2-), 1.26 (m, 6H, N-CH2-CH2-CH2-CH2-CH2-CH3), 0.80 (t, 3H,
calculated (%) for C30H27N3O6S4: C, 55.11%; H, 4.16%;
N, 6.43%. Found: C, 54.92%; H, 4.12%; N, 6.31%.
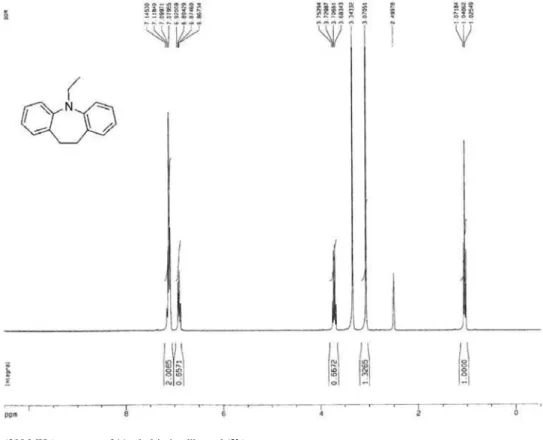
11-Ethyl-iminodibenzyl (2b)
Iminodibenzyl (1b: 6.834 g, 35 mmol), iodoethane (5.93 g, 38 mmol) and 80 mL of DMF were added to a 50 mL two-necked glass reactor. The solution was warmed to 75 °C, treated portionwise with potassium tert-butoxide (4.264 g, 38 mmol) and then reluxed for 24 h. After 150 mL of water was added, the mixture was extracted with chloroform (75 mL). Crude oils obtained by removing the solvent were puriied by column chromatography (silica gels,
n-hexane/ethyl acetate: 20/1 as eluent) to give 2b as a white solid (4.76 g, 61%, mp 54 oC). 1H NMR (CDCl
3), d (ppm):
1.16 (t, 3H, CH3), 3.17 (m, 4H, CH2), 3.80 (m, 2H, CH2), 6.92
(m, 2H, ar), 7.12 (m, 6H, ar). Elemental analysis calculated (%) for C16H17N: C, 86.05%; H, 7.67%; N, 6.27%. Found:
C, 85.96%; H, 7.73%; N, 6.20%.
11-Ethyl-3,8-diformyliminodibenzyl (4b)
To a 50 mL glass reactor were added with imidazole (0.718 g, 10.5 mmol) and 10 mL acetonitrile. The mixture were added under stirring with triluoroacetic anhydride (5.775 g, 27.5 mmol) within 5 min, treated dropwise with 11-ethyl-iminodibenzyl (2b: 1.117 g, 5 mmol) and then reluxed for 4 h. After adjusting pH > 7 with saturated aqueous solution of Na2CO3, the appearing precipitates were isolated
by iltration and washed with water to give a precipitate. The precipitate was dissolved in CH2Cl2, washed with saturated
aqueous NaHCO3, dried over anhydrous MgSO4 and the
solvent was removed under reduced pressure to afford 3,8-bis(1,3-bis-trifluoracetyl-4,5-dihydroimidazole-2-yl)-11-ethyliminodibenzyl (3b: 3.35 g, 90%), which was used for the next step without further puriication. To a 250 mL glass reactor were added with 3b (5.95 g, 8 mmol), 148 mL acetonitrile and 77 mL 1.9 mol L-1 HCl. The mixture was
reluxed for 3 h and was extracted with ethyl ether after cooling and neutralization. The crude products obtained by removing ethyl ether were puriied by column chromatography (silica gel; n-hexane/ethyl acetate = 4/1) to give 4b (1.77 g, 79%, mp 96 oC). 1H NMR (acetone-d
6, ppm): d9.72 (s, 2H, -CHO),
7.54 (d, J 7.4 Hz, 2H), 7.48 (s, 2H), 7.09 (d, J 7.3 Hz, 2H), 3.73 (t, 2H), 3.05 (s, 4H), 1.07 (t, J 3.3 Hz, 3H). Elemental analysis calculated (%) for C18H17NO2: C, 77.40; H, 6.13;
N, 5.01. Found: C, 77.41; H, 6.16; N, 4.96.
5,5’-(11-Ethyl-iminodibenzyl-3,8-diyl)bis(methan-1-yl-1-ylidene)bis(4-oxo-2-thioxothiazolidin-3-yl-5-ylidene)diacetic acid (S2)
To a stirred 4b (0.558 g, 2 mmol) in CH3COOH (30 mL)
were added rhodanine-3-acetic acid (0.794 g, 4.15 mmol)
and ammonium acetate (0.125 g, 1.625 mmol). The mixture was heated to 120 oC and the reaction was continued for 2 h
at the temperature. Then the reaction mixture was allowed to cool to room temperature. The solid was collected by iltration and washed with water thoroughly. After drying in air, the crude product was puriied by column chromatography on silica gel with CH2Cl2/methanol
(10:1, v/v) as eluent to give S2 in 83% yield, mp > 200 oC.
1H NMR (DMSO-d
6), d (ppm):7.79 (s, 2H, -CH= and
aromatic hydrogen), 7.50 (m, 4H, aromatic hydrogen), 7.36 (d, 2H, aromatic hydrogen), 4.73 (s, 4H, O=C-CH2-N),
3.94 (q, 2H, N-CH2-), 3.18 (t, 4H, -CH2-CH2-), 1.19
(t, 3H, N-CH2-CH3). Elemental analysis calculated (%) for
C28H23N3O6S4: C, 53.74%; H, 3.70%; N, 6.72%. Found:
C, 53.51%; H, 3.62%; N, 6.58%.
10-Ethyl-phenothiazine (2c)
Phenothiazine (1c: 11.94 g, 60 mmol), iodoethane (10.92 g, 70 mmol) and 80 mL of DMF were added to a 50 mL two-necked glass reactor. The solution was warmed to 75 °C, treated portionwise with potassium tert-butoxide (7.86 g, 70 mmol) and then reluxed for 24 h. After 150 mL of water was added, the mixture was extracted with chloroform (75 mL). Crude product obtained by removing the solvent were puriied by column chromatography (silica gels, n-hexane/ethyl acetate: 20/1 as eluent) to give 2c as a white solid (11.32 g, yield: 83%, mp 103-104 oC). 1H NMR
(CDCl3), d(ppm): 1.42 (t, 3H, CH3), 3.92 (m, 2H, CH2),
6.85-6.88 (m, 4H, ar), 7.11-7.16 (m, 4H, ar). Elemental analysis calculated (%) for C14H13NS: C, 73.97%;
H, 5.76%; N, 6.16%; S, 14.11%. Found: C, 73.83%; H, 5.73%; N, 6.13%, S, 14.10%.
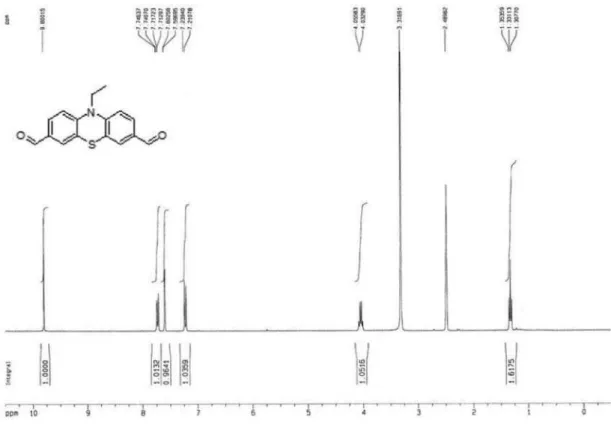
10-Ethyl-3,7-diformylphenothiazine (4c)
To a 50 mL glass reactor were added with imidazole (0.718 g, 10.5 mmol) and 10 mL acetonitrile. The mixture were added under stirring with triluoroacetic anhydride (5.775 g, 27.5 mmol) within 5 min, treated dropwise with 10-ethyl-phenothiazine (2c: 1.137 g, 5 mmol) and then reluxed for 4 h. After adjusting pH > 7 with saturated aqueous solution of Na2CO3, the appearing precipitates
were isolated by iltration and washed with water to give a precipitate. The precipitate was dissolved in CH2Cl2,
washed with saturated aqueous NaHCO3, dried over
anhydrous MgSO4 and the solvent was removed under
extracted with ethyl ether after cooling and neutralization. The crude product obtained by removing ethyl ether were purified by column chromatography (silica gel;
n-hexane/ethyl acetate = 4/1) to give 4c (1.74 g, 77%, mp 167 oC). 1H NMR (CDCl
3, ppm): d9.84 (s, 2H, -CHO),
7.68 (dd, 2H, aromatic hydrogen), 7.59 (s, 2H, aromatic hydrogen), 6.98 (d, 2H, aromatic hydrogen), 4.05 (q, 2H, N-CH2-), 1.50 (t, 3H, N-CH2-CH3). Elemental analysis
calculated (%) for C16H13NO2S: C, 67.82; H, 4.62; N, 4.94.
Found: C, 67.84; H, 4.60; N, 4.91.
5,5’-(10-Ethyl-phenothiazine-3,7-diyl)bis(methan-1-yl-1-ylidene)bis(4-oxo-2-thioxothiazolidin-3-yl-5-ylidene) diacetic acid (S3)
To a stirred 4c (0.34 g, 1.2 mmol) in CH3COOH
(30 mL) were added rhodanine-3-acetic acid (0.476 g,
2.49 mmol) and ammonium acetate (0.075 g, 0.975 mmol).
The mixture was heated to 120 oC and the reaction was
continued for 2 h at the temperature. Then the reaction mixture was allowed to cool to room temperature. The solid was collected by iltration and washed with water thoroughly. After drying in air, the crude product was puriied by column chromatography on silica gel with CH2Cl2/methanol (10:1, v/v) as eluant to give S3 in 86%
yield, mp > 200 oC. 1H NMR (DMSO-d
6), d(ppm): 7.75
(s, 2H, -CH=), 7.47 (d, 2H, aromatic hydrogen), 7.40 (s, 2H, aromatic hydrogen), 7.19 (d, 2H, aromatic hydrogen), 4.71 (s, 4H, O=C-CH2-N), 4.00 (q, 2H, N-CH2-), 1.33 (t,
3H, N-CH2-CH3). Elemental analysis calculated (%) for
C26H19N3O6S5: C, 49.59%; H, 3.04%; N, 6.67%. Found:
C, 49.43%; H, 3.01%; N, 6.53%.
Figure S2. 1H NMR (300 MHz) spectrum of 11-ethyl-iminodibenzyl (2b).
Figure S4. 1H NMR (300 MHz) spectrum of 9-hexylcarbazole-3,6-dicarbaldehyde (4a).
Figure S6. 1H NMR (300 MHz) spectrum of 10-ethyl-3,7-diformylphenothiazine (4c).
Figure S8. 1H NMR (300 MHz) spectrum of S2.
Figure S10. 13C NMR (400 MHz) spectrum of N-hexylcarbazole (2a).
Figure S12. 13C NMR (400 MHz) spectrum of 10-ethyl-phenothiazine (2c).
Figure S14. 13C NMR (400 MHz) spectrum of 11-ethyl-3,8-diformyliminodibenzyl(4b).