Article
Printed in Brazil - ©2017 Sociedade Brasileira de Química0103 - 5053 $6.00+0.00
*e-mail: [email protected]
Low Potential and Non-Enzymatic Hydrogen Peroxide Sensor Based on Copper
Oxide Nanoparticle on Activated Pencil Graphite Electrode
Mohammad Ali Kamyabi* and Nasim Hajari
Department of Chemistry, Colleges of Science, University of Zanjan, 4537138791 Zanjan, Iran
An electrochemical sensor for H2O2 determination was prepared by electrodepositing copper
oxide nanoparticles on the activated pencil graphite electrodes. At first, a study has been made of the optimum conditions for chemical activation of the pencil graphite electrodes (APGE) and then the activated pencil graphite electrode was modified with copper oxide nanoparticles (CuO/APGE) and used as a non-enzymatic hydrogen peroxide sensor. The morphology of the modified electrode surface was investigated by scanning electron microscopy (SEM). Upon the addition of H2O2, the modified electrode (CuO/APGE) exhibits significant oxidation of H2O2 with starting
potential around +0.05 V (vs. Ag/AgCl) which dramatically decreases the overpotential of H2O2
oxidation. Under the optimal experiment conditions, the electrocatalytic response current of this sensor was proportional to the H2O2 concentration in the range of 5.0 × 10⁻⁶ to 1.6 × 10⁻³ mol L-1
with a detection limit down to 0.21 µmol L-1 (signal/noise = 3). The sensitivity was calculated to
be 4.75 µAL mmol-1. The electrochemical active surface area and the catalytic rate constant of
hydrogen peroxide electro-oxidation were calculated. The H2O2 sensor exhibited a low detection
limit, a good signal reproducibility (relative standard deviation (RSD), n = 4) 2.36% and the accurate measurements in milk as the real sample.
Keywords: pencil graphite electrode, non-enzymatic hydrogen peroxide sensor, electocatalysis, CuO nanoparticle
Introduction
Hydrogen peroxide is an important chemical because it has attractive features like anti-bacterial property, decolorizing and oxidizing agent.1 Widespread application
in biology, as a product of oxidase-catalyzed reactions, industry and food make H2O2 as an attractive chemical to
develop reliable and rapid detection methods for accurately monitoring of its concentration. Moreover, outstanding application in fuel cells as a carbon-free energy carrier and a strong oxidant in direct peroxide-peroxide fuel cell was recently developed.2
Various detection methods for hydrogen peroxide determination have been developed.3-5 Among them, the
electrochemical method is preferable for its simplicity, high sensitivity and low detection limit. Considering the high catalytic activity and selectivity of enzymes for certain reactions, various enzymatic electrochemical biosensors have been constructed for the detection of hydrogen peroxide with excellent sensitivity, high selectivity and
rapid response,6 but the sensitivity of these sensors can be
easily affected by temperature, pH value, humidity and toxic chemicals. Fabricated enzymatic sensors suffered greatly from the chief drawback of poor instability due to the intrinsic nature of enzymes. To solve this problem, the non-enzymatic sensors based on the direct oxidation of hydrogen peroxide have been explored for practical applications.7 Due to good reproducibility, low cost,
fast response, high sensitivity, low detection limit, and high stability in aggressive environment, non-enzymatic amperometric sensors for direct determination of hydrogen peroxide have attracted considerable attention.8 At the
opposite, one of the key problems in determination of non-enzymatic hydrogen peroxide is its high overpotential on the ordinary electrodes. Thus, the exploitation of new electrocatalyst with low overpotential has been intensively investigated during the past several decades.
Electrochemically active nanomaterials consisting of platinum,9 gold10 and carbon nanotubes11-13 have been
the promising candidates for the active electrode material due to their distinctive properties such as high stability and good electrical properties. Different synthetic methods have been studied for the preparation of CuO nanoparticles with various morphologies, including nanowire, nanosheet, nanorod, and nanoflower.14,15 Although most of metallic
Cu0 nanomaterials are not stable enough to be used
for electroanalysis because they are easily oxidized in air or aqueous solution, chemically more stable CuO nanomaterials have been studied for various applications including electrochemical H2O2 sensors.11 The interesting
occurrence of the growth of CuO nanowires during the in situ oxidation of copper in air has been reported intensively.16 Although this method can be categorized
as a low cost method, it requires high temperature, high pressure, complex additives and long reaction time.17
The development of low-cost and sensitive electrodes for various electroanalytical applications is interested. The pencil graphite is easily accessible and useful material to prepare the modified electrode. The attractive property of a pencil graphite electrode (PGE) is its higher level of porosity compared to the glassy carbon electrode. Indeed, better intrinsic characteristics of the pencil graphite are attributed to its composite, consisting of graphite, polymeric binder and other additives (like clays).18 Indeed,
the electron transfer properties of carbon electrodes can be improved by some types of pretreatment, which can be called the electrode “activation”. The term “activation” has been used frequently to describe procedures for increasing the reactivity of carbon electrodes, often for the purpose of detecting a specific analyte. “Activation” can be involved in more than one mechanism in terms of its effects on the electrode surface.19 Many “activation” procedures are in fact
cleaning steps and used to remove surface layers resulting from handling or impure materials used for polishing. Frequently, electrochemical oxidation or reduction in various media has long been used to “activate” carbon electrodes. Şentürk and co-authors20 applied a potential
of +1.4 V vs. Ag/AgCl for 60 s on the PGE surface in the selected supporting electrolyte without stirring to obtain a more sensitive and stable analytical signal. In another work, Özcan21 used synergic effect of chemical and
electrochemical activation to activate the PGE.
Here, a new chemical activation method for the pencil graphite electrode was presented. Indeed, the PGE was chemically activated by stirring in an ethanolic HCl, which has been selected through an optimization method. Then, porous surface of the PGE was decorated with CuO nanocubes to promote electron transfer rate. This means that at the first step, the surface of the PGE was activated by the soltion of ethanolic HCl 0.1 mol L-1 to reach the activated PGE (APGE)
and then CuO nanoparticles were electrodeposited on the surface of APGE to fabricate CuO/APGE. The effect of the surface modification on the hydrogen peroxide oxidation was assessed by cyclic voltammetry (CV) and differential pulse voltammetry (DPV). The proposed modified electrode exhibited excellent catalytic activity, dramatic decrease in overpotential and high stability for hydrogen peroxide determination. Indeed, the fast chemical reaction between H2O2 and CuO converts CuII to CuI and H2O2 to O2. As soon
as CuI is produced, it is electro-oxidized back to CuII at the
electrode surface and CuO continues the catalytic cycles (Scheme 1). The sensor was successfully used for the determination of hydrogen peroxide in milk samples using differential pulse voltammetric method.
Experimental
Reagents and apparatus
Hydrogen peroxide, ethanol, hydrochloric acid, copper sulfate, sodium sulfate, sodium hydroxide and phosphoric acid were purchased from Merck (Darmstadt, Germany). Double distilled water was used for the preparation of all solutions.
The pencil graphites were purchased as pencil lead from Rotring Co. Ltd. (Germany, R 505210N of type H). The diameter of all the pencil leads were 2.0 mm. All electrochemical experiments were performed using a micro Autolab potentiostat/galvanostat 101. The utilized three-electrode system was composed of modified APGE as the working electrode, Pt wire as a counter electrode and the potentials were measured versus Ag/AgCl (KCl 3 mol L-1)
reference electrode. Scanning electron micrograph (SEM) of the PGE, APGE and the modified electrode were performed by using TESCAN/Vega3. Electrochemical impedance spectroscopy (EIS) measurements were
Scheme 1. The schematic of the catalytic mechanism for the H2O2
performed by a Zahner Ennium potentiostat/galvanostat equipped with Thales USB software.
Preparation of the working electrode
The body of the pencil lead was tightly coated with a teflon band and the surface of the pencil lead was polished on a sandy paper and weighing paper to a smoothed finish before each use then rinsed with distilled water. Electrical contact with the lead was achieved by bonding a metallic contact to the working electrode. The pencil lead was fixed vertically and immersed in the solution in which the contact was only achieved via the cross section of the lead.
Chemical pretreatment of the PGE
At the first step, the chemical pretreatment of the surface of polished PGEs was carried out by 15 minutes stirring in ethanolic hydrochloric acid 0.1 mol L-1 to fabricate APGE.
Ethanolic hydrochloric acid was selected as supporting electrolyte for the chemical activation and comparison with other electrolytes or the anodizing method. Then Cu/APGE was achieved by Cu electrochemical deposition method on the APGE surface by maintaining the potential at −0.60 V vs. Ag/AgCl for 240 s in 0.1 mol L-1 Na
2SO4
solution containing 0.02 mol L-1 CuSO
4. After washing
with water, the Cu/APGE was immersed in 0.1 mol L-1
NaOH and repeatedly scanned under the potential range from −0.40 to +0.90 V at scan rate of 0.1 V s−1 for 25 cycles.
Deposition potential, deposition time, number of scans in NaOH were optimized by the final response to hydrogen peroxide in 0.1 mol L-1 NaOH as supporting electrolyte.
During repetitive cyclic potential scanning in the alkaline solution of 0.1 mol L-1 NaOH, CuO nanocubes were formed
on the APGE. The repetitive cyclic voltammograms for the electrochemical deposition of CuO nanocubes on the APGE in 0.1 mol L-1 NaOH are shown in the Supplementary
Information (Figure S1). The anodic peak can be attributed to the oxidation of Cu2O and CuOH to CuO, while the
cathodic peak can be attributed to the reduction of CuO into Cu2O. During the cyclic potential scanning, all redox
peak currents decreased, suggesting that CuO were formed during the CVs. The mechanism of oxidation in NaOH media is shown below:22,23
Cu + OH−
→ CuOH + e− (1)
2CuOH → Cu2O + H2O (2)
Cu2O + 2OH−→ 2CuO + H2O + 2e− (3)
Finally, the electrode was rinsed with water. The prepared modified electrode was named as CuO/APGE.
Results and Discussion
Selection of supporting electrolyte for activation of the PGE
To select the best electrolyte for activation of the PGE, K3Fe(CN)6 was used as a known electrochemical probe.
The peak currents and the separation of reduction and oxidation peaks potential were investigated as a monitoring factor.19,24,25 The oxidation peak current of the voltammetric
responses of the APGE in different solution divided on the oxidation peak current of the unmodified PGE was given as an enhancement factor (equation 4). Also, the peak to peak separation was studied to investigate the reversibility of the modified electrodes. Figure 1 shows that a binary mixture of ethanol HCl 0.1 mol L-1 is a genuine nice enhancement
factor. In consistence with enhancement factor, peak to peak separation has the least value in a binary mixture of ethanol HCl 0.1 mol L-1 (Figure 1). Although using an
anodizing step can improve the response slightly, this step was ignored because stirring in ethanolic HCl achieves a higher efficiency. The HCl concentration in ethanol was also optimized (data not shown). The concentration of 0.1 mol L-1 was chosen as the optimum value for HCl in
the subsequent experiments.
(4)
The actual mechanism of carbon electrode “activation” is still open to question; obviously, activation of pencil graphite surface is possible but the influence of the inert material, the pasting liquid in carbon paste electrodes,
Figure 1. Comparison study of enhancement factor between different methods for activating PGE. The enhancement factor and peak to peak separation of 3.0 mmol L-1 ferocyanide in KCl 0.1 mol L-1 on
for example, must be taken into account.26,27 We believe,
however, that it is possible to stress the influence of the inert material too much and to de-emphasize the role of the carbon surface when interpreting the observed changes caused by the activation.25 In PGE, removal of the pasting
liquid probably does make more “active” sites available.
The surface characterization of the CuO/APGE
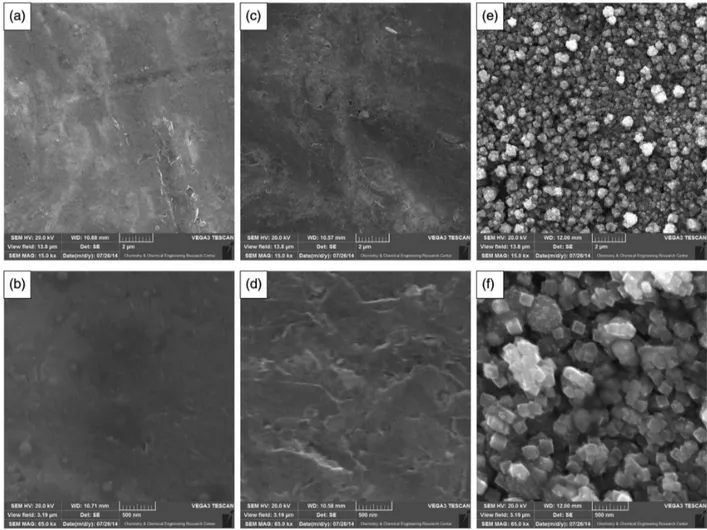
The morphology of PGE, APGE and CuO/APGE was studied by scanning electron microscopy characterization. As can be seen, the untreated PGE showed smooth surface morphology (Figures 2a and 2b), whereas APGE demonstrated the porous structure (Figures 2c and 2d), indicating that the chemical treatment process increased the surface roughness. This may arise from the breaking of the graphite layers into smaller parts during the chemical treatment process and it can be concluded that the chemical treatment increased the surface roughness. The cubic copper oxide particles are clearly visible on the porous PGE surface (Figures 2e and 2f). The average diameter of the electrodeposited particles was about 100 nm.
Electrochemical impedance spectroscopy was used to investigate the charge transfer property of the Fe(CN)63−/4−
redox couple at the bare and the modified APGE. The Nyquist plot of the EIS includes a semicircular part at high frequencies which refers to the electron-transfer limited process and a linear part at low frequencies which refers to the diffusion limited process. The diameter of semicircular portion is equal to the charge transfer resistance (Rct),
which shows the kinetic of electron transfer of the redox probe at the electrode interface. Figure 3 demonstrates that the Rct value dramatically decreased after ethanolic HCl
treatment. As expected, carbon electrodes, often for the purpose of detecting a specific analyte, need some types of pretreatments. The Rct value was changed significantly
by deposition of CuO nanocubes on the APGE.
In consistence with EIS results, cyclic voltammogram of Fe(CN)63-/4- before and after deposition of CuO was
illustrated in Supplementary Information (Figure S2). As can be seen in Figure S2, Fe(CN)63-/4- has a reversible
behavior with the peak to peak separation of about 70 mV and ia/ic is equal to 1, on the surface of the CuO/APGE
electrode.
Figure 4a shows the cyclic voltammogram of CuO/APGE in 0.1 mol L-1 NaOH with scan rate of 0.1 V s−1. It includes
two peaks during the anodic sweep which can be assigned to Cu0/CuI and CuI/CuII for the peaks I
a and IIa, respectively.28,29
During the cathodic sweep, two peaks also appeared, which can be assigned to the CuII/CuI and CuI/Cu0, respectively,
while the redox peaks of CuII/CuIII are not so clear.26
To investigate the electrochemical behavior of the modified electrode, cyclic voltammograms of the CuO/APGE were recorded in the pH range of 3.0 to 13.0 (Figure 4b). The results show that increasing the solution pH the anodic and cathodic peak potentials of the electrode move to more negative potentials. The mean peaks potential (Eº´) at various pHs was calculated as the average value of the anodic and cathodic peaks potential of the voltammograms. As shown in Figure 4c (inset), increasing the pH solutions in the pH range of 3.0-8.0, Eº´ of CuO shift to negative values with the slope of about 29 mV pH-1,
which indicates that the redox process is pH dependent.
Electrocatalytic oxidation of H2O2
In this work, cyclic voltammetry was used to evaluate the electrocatalytic activity of the CuO/APGE towards H2O2
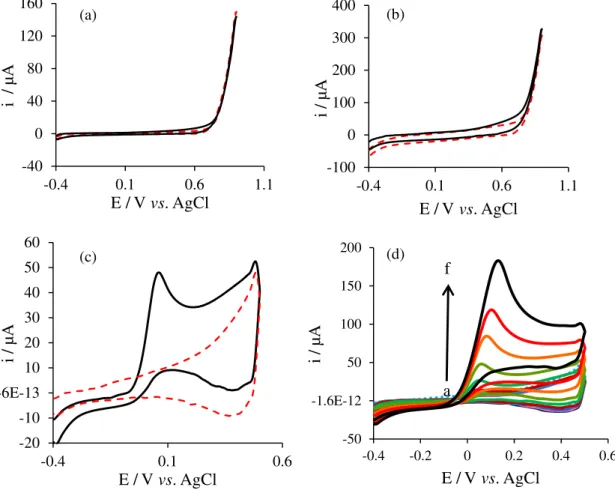
oxidation. As shown in Figures 5a and 5b, there were no electrochemical response to H2O2 on the surfaces of the bare
PGE and also APGE in the applied potential window, while the CuO/APGE exhibits the oxidation response toward H2O2 oxidation (Figure 5c).
As illustrated in Figure 5d, by increasing the concentration of H2O2 at the CuO/APGE, the anodic peak
current increased, which indicates good electrocatalytic activity of CuO/APGE towards H2O2 oxidation. Here, in the
anodic pathway, CuI is oxidized electrochemically to CuII
(i.e., Cu2O + 2OH−→ 2CuO + H2O + 2e−). In the presence
of H2O2, according to standard redox potential of H2O2 to
O2 and CuO to Cu2O in the alkaline media (Supplementary
Information, Table S1), CuII chemically converts to CuI
(i.e., 2CuO + H2O2→ Cu2O + H2O + O2). As soon as CuII
is reduced to CuI by H
2O2, it is electro-oxidized back to CuII
at the electrode surface.30 Therefore, in the anodic scan,
the local concentration of CuI at the electrode surface is
increased in the presence of H2O2, thus the anodic current
is increased. Increasing the anodic peak current depends on the H2O2 concentration. Since the above chemical reaction
between H2O2 and CuO is fast, nano-copper oxide particles
were suitable as mediators to shuttle electrons between H2O2 and working electrode.23
For comparison, CuO was formed on the bare PGE and stabilized with cycling in NaOH. The CuO nanoparticles on the untreated PGE were not stable and a dramatic decrease was observed via cycling in the NaOH media. This result revealed the basic role of activated treatment on the PGE. This is due to the fact that APGE has a wide surface area and the copper nanoparticles could stand on these sites. H2O2 electrocatalytic oxidation mechanism at the
CuO/APGE is indicated in Scheme 1. The CuO nanoparticles can oxide the H2O2 to O2 via the generation of CuI by the
following reaction:20
2CuO + H2O2→ Cu2O + H2O + O2 chemical reaction (5)
Cu2O + 2OH−→ 2CuO + H2O + 2e− on the electrode
surface (6)
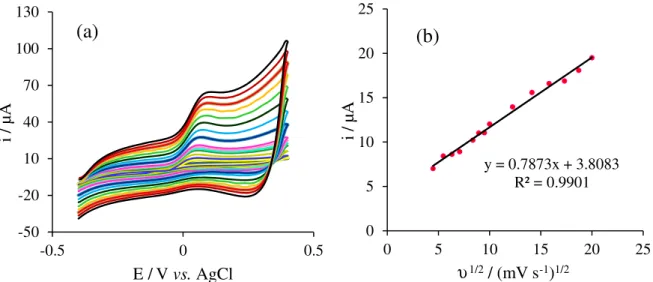
Figure 6a shows the cyclic voltammograms of 1.0 mmol L-1 H
2O2 in NaOH 0.1 mol L-1 on the CuO/APGE
at different scan rates ranging from 10 to 500 mV s-1. The
peak currents are linearly proportional to the square root of scan rate in the range of 10-400 mV s-1, indicating a
diffusion controlled electron process occurred for H2O2
Figure 3. Nyquist plots of (a) PGE; (b) APGE (diamond) and CuO/APGE (circle) in a 0.1 mol L-1 KCl containing 5.0 mmol L-1
Fe(CN)63-/4- at +0.2 V vs. Ag/AgCl, the frequency was scanned from 0.1 Hz
Figure 4. (a) Cyclic voltammogram of CuO/APGE in the 0.1 mol L-1 NaOH with scan rate of 100 mV s−1; (b) effect of pH on the CuO/APGE, scan rate:
determination, which is the perfect manner for quantitative determinations (Figure 6b). Moreover, the oxidation potential was almost the same at scan rates below 50 mV s-1,
suggesting facile charge transfer kinetics over this range of sweep rates. On the other hand, it was found that at scan rates above 50 mV s-1, the oxidation peak potential were
increased with scan rate increasing. The values of oxidation potential are proportionate to the logarithm of the current (data not shown). Based on the Tafel theory, the transfer coefficient (α) can be estimated by measuring the variation
of peak potential with current.31 The transfer coefficient at
scan rate 10 mV s-1 in the presence of 1.0 mmol L-1 H 2O2
was obtained as 0.53.
The chronoamperometry as well as other electrochemical methods was employed for investigation of electrode processes at the modified electrodes. Figure 7a illustrates the chronoamperometric measurements of the system at the CuO/APGE. This figure represents the current-time curves obtained by setting the working electrode potential at 200 mV vs. Ag/AgCl in the absence and presence of hydrogen peroxide. Figure 7b shows the experimental plot of i vs. t-1/2. The slope of the resulting straight line was then
plotted against hydrogen peroxide concentration. From the slope and using the Cottrell equation,32 the value of
diffusion coefficient was found to be 9.55 × 10⁻⁶ cm2 s-1.
I = nFAD1/2C0
π-1/2t-1/2 (7)
where I, n, F, A, D, C0, and t refer to the current, number of electrons, Faraday constant, area of the working electrode, diffusion coefficient, initial mole concentration of Cu, and time, respectively.
A c c o r d i n g t o t h e m e t h o d d e s c r i b e d i n , chronoamperometric data can also be employed to evaluate the catalytic rate constant of the chemical reaction between the hydrogen peroxide and the active site of the CuO/APGE according to the following equation:33
ic/il = γ1/2[π1/2 erf(γ1/2) + exp(−γ)/ γ1/2] (8)
where ic is the catalytic current of the CuO/APGE in the
presence of hydrogen peroxide, il is the limiting current in
the absence of hydrogen peroxide and γ = kC0t, where C0 is
the bulk concentration of hydrogen peroxide (mol L-1), k is
Figure 5. Cyclic voltammogram of (a) PGE; (b) APGE and (c) APGE/CuO in 0.1 mol L-1 NaOH, in presence (black solid line) and absence (red dashed
line) of 6.0 mmol L-1 H
2O2, scan rate 0.1 V s-1; (d) cyclic voltammograms of CuO/APGE with addition of H2O2 from 0.11 to 29.9 mmol L-1 in 0.1 mol L-1
the catalytic rate constant (cm3 mol-1 s-1) and t is the time
elapsed (s), and erf(γ1/2) is the argument of error function. In
treatments, it is assumed that hydrogen peroxide is present in large excess rather than Cu nanocubes, in addition where
γ exceeds 2, the error function is almost equal to 1 and the
above equation can be considered as follows:
ic/il = γ1/2π1/2 = π1/2(kC0t)1/2 (9)
Based on the slope of the ic/ilvs. t1/2 plot (Figure 7c), the
mean value of k was found to be 33.47 cm3 mol-1 s-1 in the
3.84 mmol L-1 H
2O2 solution. This value for the electron
transfer rate constant is comparable with 41.9 cm3 mol-1 s-1
for Hb/PLE, the apparent heterogeneous electron transfer rate constant reported previously.33
Differential pulse voltammetric determination of H2O2 at
the CuO/APGE
Due to the more quantitative features of differential pulse voltammetry to cyclic voltammetry method, this eletrochemical technique was employed to obtain the
Figure 6. (a) Cyclic voltammograms of CuO/APGE NaOH 0.1 mol L-1 solution containing 1.0 mmol L-1 H
2O2 at the scan rates from 10 to 500 mV s−1;
(b) plot of variations of peak currents (ip) versusυ1/2.
Figure 7. (a) Chronoamperograms of CuO/APGE in 0.1 mol L-1 NaOH solution in absence (black solid line) and presence of 3.84 mmol L-1 H 2O2 (red
dashed line), potential step was 0.2 V; (b) dependency of transient current on t1/2 for following concentration of hydrogen peroxide; (c) dependence of (i c/il)
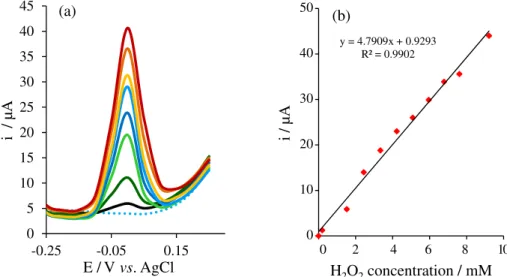
analytical figures. In order to obtain the calibration curve, the measurements were performed in 0.1 mol L-1
NaOH solution with the hydrogen peroxide addition in the concentration range of 5.0 × 10⁻⁶ to 2.6 × 10⁻³ mol L-1
(Figure 8).
The analytical curve is linear in the hydrogen peroxide concentration range from 5.0 µmol L-1 to 2.6 mmol L-1
with a limit of detection (LOD) of 0.21 µmol L-1. LOD
was calculated using the relationship 3s/b, where s is the average of standard deviation of 4 measurements for the blank solution and b is the sensitivity calculated from the calibration curve slope (4.75 µAL mmol-1).
For comparison, the performances of the CuO/APGE and the other hydrogen peroxide sensors reported in literature were listed in Table 1. As can be seen in Table 1, an outstanding feature of the developed sensor is the significant decrease in overpotential for hydrogen
Figure 8. (a)DP voltammograms for hydrogen peroxide determination. The DPV parameters are α = 50 mV, τ = 50 ms, v = 0.1 V s−1, and NaOH solution
(0.1 mol L−1); (b) calibration curve of concentration versus peak current of H 2O2.
Table 1. Analytical performances of different modified electrodes for H2O2 determination
Sensor LDR / (mol L-1) DL /
(µmol L-1)
Sensitivity / (µAL mmol-1)
Oxidation potential /
V vs. Ag /AgCl Reference
Nano-TiO2 and Pt/Ti foil 4 × 10⁻⁶ to 1.25 × 10⁻³ 4 0.85 0.3 34
Pt-implanted/boron-doped diamond electrode
1.0 × 10⁻⁷ to 1.0 × 10⁻⁵ 0.03 21.9 0.55 35
Copper on porous silicon (Cu/PSi)-CPE 5.0 × 10⁻⁴ to 3.78 × 10⁻³ 0.27 13.09 0.2 23
Carbon nanofiber/GC 1.80 × 10⁻⁴ to 2.62 × 10⁻³ 4 3.20 0.65 36
Carbon nanotube paste electrode not reported 20 0.8 0.95 37
AuNPs/MWCNT/PANI 3.0 × 10⁻⁶ to 6.0 × 10⁻⁴ 0.3 3.3 0.8 38
Cu/GC 2.0 × 10⁻⁹ to 2.7 × 10⁻⁷ 0.0002 1.24 × 10⁻⁴ 0.2 23
MnO2/OMC/GC 5 × 10⁻⁷ to 6 × 10⁻⁴ 0.07 806.8 µAL mmol-1 cm-2 0.45 39
CuO/APGE 5.0 × 10⁻⁶ to 1.6 × 10⁻³ 0.21 4.75 0.05 this work
PANI: polyaniline; MWCNTs: multiwalled carbon nanotubes; AuNPs: gold nanoparticles; CPE: carbon paste electrode; GC: glassy carbon; OMC: ordered mesoporous carbon; APGE: activated pencil graphite electrode.
peroxide oxidation. Moreover, the presented sensor exhibits comparable analytical figures while it has low cost and easily preparation merits. Although some sensors have a wider linear range, their outstanding low determination potential is an attractive feature in the presented sensor.
Reproducibility and stability of the H2O2 sensor
Reproducibility and stability are attractive features for sensors. To establish the reproducibility, four modified electrodes were fabricated and their DP voltammetric responses towards 1.0 mmol L-1 H
2O2 were examined.
The relative standard deviation (RSD, n = 4) was found to be 2.36%. The storage stability was investigated by recording DP voltammetric response of 1.0 mmol L-1
H2O2 in 0.1 mol L-1 NaOH, during 10 days. CuO/APGE
peroxide over a 10 day period. These results indicate that this electrochemical sensor has a good stability and reproducibility, as required for the determination of H2O2.
Interference study and real sample analysis
The selectivity studies are challenging problems for enzyme-free H2O2 sensors in the presence of common
interfering species, though the naturally coexisting interfering species are highly active at enzyme-free electrode systems.40 The DP voltammetric response of
the CuO/APGE to the consecutive addition of H2O2
(0.4 mmol L-1) and potentially interfering species such
as ascorbic acid, uric acid and glucose (0.4 mmol L-1) in
0.1 mol L-1 NaOH, were recorded. In practical conditions,
glucose and uric acid did not disturb in the detection of hydrogen peroxide and ascorbic acid interference response is less than 3%. Indeed, the good selectivity can be attributed to dramatic decrease in electrocatalytic oxidation potential of hydrogen peroxide.
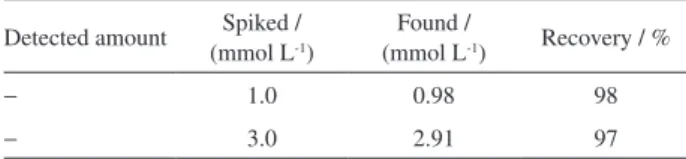
To demonstrate electrode suitability and potential application for sample analysis, the CuO/APGE was used for the determination of H2O2 in ultra-high-temperature
(UHT) processed milk. Hydrogen peroxide in milk samples presents as a result of enzymatic activity and works as an anti-bacterial agent.41 While the amount of hydrogen
peroxide in milk is lower than detection limit, the sample was spiked with various amounts of H2O2 and a recovery
test was performed (Table 2). The recovery was about 97.5% by four replications suggesting that there was no interference from the complex matrix of milk.
Conclusions
In summary, a low potential electrochemical sensor was presented for hydrogen peroxide determination. A porous electrode with high surface area could be achieved by electrodeposition of CuO nanocubes on the APGE. The presented sensor is prepared in less than one hour with the lowest cost. The CuO-modified electrode displayed high electrocatalytic activity and fast response to hydrogen peroxide oxidation. This CuO/APGE electrochemical sensor has comparable analytical figures with other
Table 2. Results of determination of hydrogen peroxide in the milk samples
Detected amount Spiked / (mmol L-1)
Found /
(mmol L-1) Recovery / %
− 1.0 0.98 98
− 3.0 2.91 97
electrochemical sensors. The relative standard deviation (RSD, n = 4) was 2.36%. These results indicate that this electrochemical sensor has a good reproducibility, as required for the determination of H2O2.
Supplementary Information
Supplementary information is available free of charge at http://jbcs.org.br as PDF file.
Acknowledgment
The authors express their gratitude to the University of Zanjan Research Council for support of this work.
References
1. Lin, K.-C.; Yin, C.-Y.; Chen, S.-M.; Sens. Actuators, B2011,
157, 202.
2. Yang, F.; Cheng, K.; Xue, X.; Yin, J.; Wang, G.; Cao, D.;
Electrochim. Acta 2013, 107, 194.
3. Klassen, N. V.; Marchington, D.; McGowan, H. C.; Anal. Chem.
1994, 66, 2921.
4. Sellers, R. M.; Analyst 1980, 105, 950.
5. Paital, B.; BioMed Res. Int. 2014, 2014, ID 342958.
6. Gao, Z.; Liu, J.; Chang, J.; Wu, D.; He, J.; Wang, K.; Xu, F.; Jiang, K.; CrystEngComm 2012, 14, 6639.
7. Wu, H.-X.; Cao, W.-M.; Li, Y.; Liu, G.; Wen, Y.; Yang, H.-F.; Yang, S.-P.; Electrochim. Acta 2010, 55, 3734.
8. Li, K.; Fan, G.; Yang, L.; Li, F.; Sens. Actuators, B 2014, 199, 175.
9. Guo, S.; Wen, D.; Zhai, Y.; Dong, S.; Wang, E.; ACS Nano 2010,
4, 3959.
10. Maduraiveeran, G.; Ramaraj, R.; J. Electroanal. Chem. 2007,
608, 52.
11. Yang, N.; Chen, X.; Ren, T.; Zhang, P.; Yang, D.; Sens. Actuators, B 2015, 207, 690.
12. Kamyabi, M. A.; Hajari, N.; Turner, A. P.; Tiwari, A.; Talanta
2013, 116, 801.
13. Kamyabi, M. A.; Rahmanian, N.; Anal. Methods 2015, 7, 1339. 14. Song, M.-J.; Hwang, S. W.; Whang, D.; Talanta 2010, 80,
1648.
15. Prathap, M. A.; Kaur, B.; Srivastava, R.; J. Colloid Interface
Sci. 2012, 370, 144.
16. Li, A.; Song, H.; Wan, W.; Zhou, J.; Chen, X.; Electrochim.
Acta 2014, 132, 42.
17. Lu, L.; Huang, X.; Microchim. Acta 2011, 175, 151.
18. McCreery, R. L.; Advanced Carbon Electrode Materials for Molecular Electrochemistry,vol. 17; Bard, A. J., ed.; Marcel Dekker: New York, 1990, p. 221.
20. Yardım, Y.; Keskin, E.; Levent, A.; Özsöz, M.; Şentürk, Z.;
Talanta 2010, 80, 1347.
21. Özcan, A.; Electroanalysis 2014, 26, 1631.
22. Yang, J.; Jiang, L.-C.; Zhang, W.-D.; Gunasekaran, S.; Talanta
2010, 82, 25.
23. Le, W.-Z.; Liu, Y.-Q.; Sens. Actuators, B 2009, 141, 147. 24. Lord Jr., S.; Rogers, L.; Anal. Chem. 1954, 26, 284.
25. Tavares, P. H. C. P.; Barbeira, P. J. S.; J. Appl. Electrochem.
2008, 38, 827.
26. Rice, M. E.; Galus, Z.; Adams, R. N.; J. Electroanal. Chem. Interfacial Electrochem. 1983, 143, 89.
27. Urbaniczky, C.; Lundström, K.; J. Electroanal. Chem. Interfacial Electrochem. 1984, 176, 169.
28. Zhang, Y.; Su, L.; Manuzzi, D.; de los Monteros, H. V. E.; Jia, W.; Huo, D.; Hou, C.; Lei, Y.; Biosens. Bioelectron. 2012, 31, 426.
29. Ensafi, A. A.; Abarghoui, M. M.; Rezaei, B.; Sens. Actuators, B
2014, 196, 398.
30. Yang, Y. J.; Zi, J.; Li, W.; Electrochim. Acta 2014, 115, 126. 31. Bard, A. J.; Faulkner, R. W. In Electrochemical Methods,
Fundamentals and Applications; Wiley: New York, 2004, p. 23.
32. Jafarian, M.; Haghighatbin, M.; Gobal, F.; Mahjani, M.; Rayati, S.; J. Electroanal. Chem. 2011, 663, 14.
33. Majidi, M. R.; Pournaghi-Azar, M. H.; Saadatirad, A.; Alipour, E.; Food Anal. Methods 2015, 8, 1067.
34. Cui, X.; Li, Z.; Yang, Y.; Zhang, W.; Wang, Q.; Electroanalysis
2008, 20, 970.
35. Ivandini, T. A.; Sato, R.; Makide, Y.; Fujishima, A.; Einaga, Y.;
Diamond Relat. Mater. 2005, 14, 2133.
36. Li, Z.; Cui, X.; Zheng, J.; Wang, Q.; Lin, Y.; Anal. Chim. Acta
2007, 597, 238.
37. Valentini, F.; Amine, A.; Orlanducci, S.; Terranova, M. L.; Palleschi, G.; Anal. Chem. 2003, 75, 5413.
38. Narang, J.; Chauhan, N.; Pundir, C.; Analyst 2011, 136, 4460. 39. Luo, L.; Li, F.; Zhu, L.; Zhang, Z.; Ding, Y.; Deng, D.;
Electrochim. Acta 2012, 77, 179.
40. Karuppiah, C.; Palanisamy, S.; Chen, S.-M.; Electrocatalysis
2014, 5, 177.
41. Harrison, R.; Int. Dairy J.2006, 16, 546.
Submitted: February 23, 2016