Article
Printed in Brazil - ©2015 Sociedade Brasileira de Química0103 - 5053 $6.00+0.00A
*e-mail: [email protected]
Catalytic Ozonation Using Fe
2+in the Treatment of Dairy Effluent in a Semi-Batch
Process with Recycle
Raquel A. Messias, Hélcio J. I. Filho, Guilherme A. Ferreira, Otávio A. Silva, Adriano F. Siqueira and Marco A. K. Alcântara*
Escola de Engenharia de Lorena, Universidade de São Paulo, Estrada Municipal do Campinho, s/n, Bairro do Campinho, 12602-810 Lorena-SP, Brazil
This work describes the treatment of dairy industry efluent using catalytic ozonation with Fe2+
as its catalyst in a semi-batch process with recycle. A fractional factorial design 24–1 was used with
a reduction percentage of total organic carbon (TOCred) as response. Optimal conditions were obtained by the reaction time of 30 min, ozonator power of 35 W, O2 low rate of 0.125 L min-1,
Fe2+ concentration of 1.0 g L-1 and pH 4.0 for a 2 L raw efluent. TOCred of 64.03% represents
a decrease in concentration from 473.0 to 170.1 mg L-1, with an estimate cost of US$ 0.03 L-1
efluent. The treatment performed was not suficient to discharge it directly on surface water; however, signiicant reduction of TOCred, among physical and chemical characteristics makes a better product to be proceeded into a biological treatment.
Keywords: dairy industry, catalytic ozonation, advanced oxidation processes
Introduction
Due to high consumption of water and large volume of efluent produced, dairy industry is considered the most pollutant in comparison to other food industries.1
Treatment is, therefore, required since it is composed of high molecular weight and aromatic compounds that are not easily degraded, considered as pollutants.
Dairy efluents are composed of milk and processed products derived from milk as well as disinfectants, detergents, spices and essences (butter and cheese production) that are diluted in the washing process of equipment, pipes, loor and other facilities of such industry.2
Industries have currently used treatment alternatives based on physical and biological processes that although show restricted eficiency, have several limitations. These limitations generally include primary treatment for the removal of suspended solids and fat material, and a secondary biological treatment. Problems related to the secondary biological treatment are related to high foam production, low biodegradability of sludge, low resistance to load shock, dificulties in removing nutrients (nitrogen and phosphorus) and problems in the degradation of fat and other speciic types of pollutants as dyes, apart from unpleasant odor.3,4
Thus, eficient and economically viable technologies are required to treat these types of efluents.5 In this sense,
advanced oxidation processes (AOPs) are technologies extremely eficient based on the oxidizing power of several radicals formed that are used in the destruction of organic compounds of dificult degradation (partial or total).6,7
Catalytic ozonation may be considered as a homogeneous process based on ozone activation by metal ions present in aqueous solution. These reactions are characterized by single-phase development or as a heterogeneous process in the presence of metal oxides.8 Also, the transition metals
form low solubility products under certain pH conditions. As pH is related to concentration of hydroxyl ions (OH–), it directly inluences the decomposition of molecular
ozone. In situations where a small concentration of hydroxyl ion is present (pH < 4), the reaction takes place predominantly by electrophilic addition of molecular ozone (direct reaction).9 In an alkaline medium, hydroxyl
ions in high concentration may start the decomposition of molecular ozone leading to the formation of hydroxyl radical (indirect reaction).10
The reaction system becomes heterogeneous in an alkaline medium with Fe2+ ions in the catalytic ozonation
medium are not always satisfactory. Due to the complexity of environmental matrix, numerous compounds considered sequestrants of hydroxyl radical, such as HCO3–, CO32–,
CH3COO– and humic substances might be present resulting
in decrease of the eficiency of the process.9
The reaction between the hydroxide anion and ozone leads to the formation of superoxide radical anions (O2•–) and hydroperoxide radicals (HO
2•), as shown in
equation 1.12
O3 + OH–→ O2•– + HO2• k = 70 L mol-1 s-1 (1)
Hydroperoxide radical shows acid-base equilibrium (equation 2).12
HO2• O
2•– + H+ k = 5 × 10¹⁰ L mol-1 s-1 (2)
The radical anion ozonide (O3•–) formed in the
reaction between ozone and the superoxide radical anion (O2•–) quickly decomposes to form hydroxyl radicals. This
formation of hydroxyl radicals may occur both in acid and alkaline media (equations 3 to 7).13,14
O3 + O2•–→ O
3•– + O2 k = 1.6 × 10⁹ L mol-1 s-1 (3)
O3•– + H+→ HO3• pH < 8 k = 5.2 × 10¹⁰ L mol-1 s-1 (4)
O3•– O•– + O
2 pH > 8 (5)
O•–→ HO• + OH– (6)
HO3•→•OH + O
2 k = 1.1 × 10⁵ s (7)
Some studies15-17 show that Fe2+ catalyzes decomposition
of O3 to generate hydroxyl radicals following a distinct
mechanism. In this case, the catalytic system O3/Fe2+
involves direct reaction of Fe2+ with ozone. Equations 8 to
14 illustrate proposed reaction mechanisms of Fe2+ with
ozone.18 Béltran et al.19 proposed reaction mechanisms
between FeIII and ozone with subsequent formation of
hydroxyl radical, as shown in equation 15.
Fe2+ + O
3→ Fe3+ + O3•− (8)
O3•– + H+ HO
3
•
→•OH + O
2 (9)
Fe2+ + •OH → Fe3+ + OH– (10)
2Fe2+ + O
3 + 2H+→ 2Fe3+ + O2 + H2O (Balance 8 to 10) (11)
Fe2+ + O
3→ (FeO)2+ + O2 (12)
(FeO)2+ + Fe2+ + 2H+→ 2Fe3+ + O
2 + H2O (13)
2Fe2+ + O
3 + 2H+→ 2Fe3+ + O2 + H2O (Balance 12 to 13) (14)
Fe3+ + O
3→ (FeO)2+ + HO• + O2 + H+ (15)
As shown in equations 8 to 15, the reaction mechanism is the transfer of electrons from the reduced metal to ozone,
forming Fe3+ ion and radical ion O
3•− and so the hydroxyl
radical. In the presence of excess Fe2+, hydroxyl radical can
oxidize a second Fe2+ providing a stoichiometric ratio of
0.5 moles of ozone per mole of ferrous ion.18
Arslan20 studied coagulation, ozonation and Fe2+ ions
catalyzed ozonation (FeSO4·7H2O) in commercial textile dyes at different pH (3 to 13). The response variable was the percentage of color and chemical oxygen demand (COD) reductions. In the coagulation procedure, a range of Fe2+ concentrations (FeSO
4·7H2O) from 0.25 to 5 g L-1, at
different pH values (3 to 13) was used. Largest reductions were obtained at pH 11 using 2.5 g L-1 of FeSO
4·7H2O,
yielding 96.9% reduction in dye and 54% reduction of COD. At pH 3, color reduction was 72.9% and COD 6.5%, which is attributed to the fact that dyes tend to aggregate in alkaline medium, causing reduction in solubility and ionization. In the process of ozonation and catalytic ozonation, 3.5 g h-1 of ozone mass low was applied.
After 10 min of ozonation and at different pH (3, 5, 8 and 11), in contradiction with coagulation experiments, the highest color and COD reductions were obtained at pH 3, with 77% color and 11% COD reduction, respectively. It should be pointed out that in an alkaline media, there is the decomposition ozone, occurring the formation of
•OH radicals, waiting for an increase in the oxidation of
pollutants. However, organic dyes, having polyaromatic structures and double bonds in their chromophoric groups, can react both in molecular pathway (acidic medium) as a radical •OH (alkaline medium). Considering the presence
of acetic acid in the dye formulation, this will possibly compete with •OH alkaline solution, meaning that less •OH
is available for dye oxidation. In the same study, ozonation tests were also conducted in the presence of Fe2+ ions as
FeSO4·7H2O, applied in concentrations ranging from 0.025 to 1.0 g L-1 at different pH (3 to 11). The color and COD
removal eficiency was slightly higher in the presence than in the absence of Fe2+, showing the tendency to decrease
with increasing pH, too. Increasing the concentration of Fe2+ to 0.5 and 1.0 g L-1 at pH 3, showed an increase in the
percentage of color and COD reductions. For 0.5 g L-1 Fe2+
concentration, 76.2 and 25.2% color and COD reductions were observed, respectively. Increasing the concentration of Fe2+ to 1.0 g L -1, 94.6 and 47.8% in color and COD
reductions were achieved, respectively. However, it possibly works in alkaline medium using Fe2+ ions. COD
and total organic carbon (TOC) removal rates do not depend only on catalyst, but also on the matrix to be treated.
Freire et al.21 applied the ozonation process for treating
phenols and efluent color. Sevimli and Kinaci22 compared
the eficiency of Fenton process with ozonation and Fenton process concerning textile dying degradation. Balcioglu and Ötker23 compared pH and H
2O2 concentration effect
over the ozonation process, concerning COD eficiency removing of pharmaceutical efluents.
Some references found in literature compare the eficiency of the ozonation process in the degradation of different substrates via direct and indirect reaction. For this work, both acidic media (pH 4.0) and alkaline media (pH 10.0) were used.
This work aims an experimental design to evaluate the eficiency of a dairy efluent treatment system from a dairy industry, Cia. de Alimentos Glória, in the city of Guaratinguetá, state of São Paulo, Brazil. The technique used advanced oxidation processes with the use of catalytic ozonation, using Fe2+ as a catalyst in a recycling semi-batch
process, besides a new reactor coniguration due to the foam generated during the process.
This work aims a technological innovation since there is no scientiic reference to scientiic work about homogeneous catalytic ozonation in a semi-batch process with recycling for this type of efluent.
Experimental
Sampling and preservation
The efluent used was from the dairy industry Cia. de Alimentos Glória in the city of Guaratinguetá, São Paulo, Brazil. Samples were collected directly from the homogenizer tank of such industry in quantity enough to perform all of the experimental design planned; they were stored in plastic recipients and frozen down in order to minimize alteration in the physicochemical characteristics of the efluent. Analysis and experiments were conducted at Escola de Engenharia de Lorena (EEL-USP) in the Laboratories of Basic and Environmental Sciences Department (LOB) and Chemical Engineering Department (LOQ).
Methodology
A volume of 2 L of dairy efluent was used in each experiment, conditioned naturally to room temperature (23 ± 2 °C) before experiments. In order to minimize any intrinsic physicochemical alteration to this type of efluent, only the corresponding volume of efluent was thawed to be used in possible experiments of the day. After homogenizing the efluent, the volume was measured in a lask and transferred to a Becker. pH was adjusted
according to the experimental condition with commercial solutions of 98% m/m H2SO4 that were measured using a benchtop pHmeter. After the adjustment, the efluent was introduced to the reactor. After setting up all modules and adaptation of pumps and tubes, O2 low rate (99.50% of
purity) for cylinder was adjusted using a valve according to each experiment. During this phase, the whole system was veriied using only injection of O2. Afterwards and concomitantly, the ozonator was started up at the speciic power and the addition of FeSO4·7H2O began. This solution was previously solubilized with commercial 98% m/m H2SO4, being introduced to the reactor with a peristaltic pump during 20 min of the total reaction time according to design of experiment levels. Concomitantly, the aeration of the system was initiated for foam formation reduction.
In general, homogeneous catalytic ozonation application should be associated with some technique for the removal of metallic ions from the treated efluent. Toxic character of some metals may restrict the application of this type of process. Furthermore, the presence of ions like iron, although less dangerous from a toxicological point of view, may be associated with undesirable effects, such as the arising of blemishes in clothes, as well as an unpleasant taste and odor in water.11
Liquid foam was drained into a reservoir that could be recycled to the oxidative process through a pulse peristaltic pump (started up at the beginning of the process), without compromising the initial volume of the reactor. With a gradual reduction of foam formation during the rest of the reaction, the air pump was shut down at the last 10 min of the process. After 30 min of reaction, an aliquot (30 mL) was taken to perform TOC analysis. It is imperative to explain that prior to TOC analysis, considering the heterogeneous catalysis, the inal product (obtained after oxidation process) was iltered and pH was conditioned in an acidic media. Considering the homogeneous catalysis, the inal product was conditioned in alkaline solution for Fe precipitation, and then, pH was conditioned in an acidic media.
Organic carbon determinations were carried out using a total organic carbon Shimadzu analyzer, model TOC-VCPH, based on the catalytic oxidation at high temperatures.
In the determination of TOC, the analytical curve of non-purgeable organic carbon (NPOC) was prepared using a standard solution of potassium biphthalate, linear range 0-1000 mg L-1. To the TOC determinations, samples
Quantification of O3 mass flow
Iodometric titration was used to quantify the concentration of O3 that was bubbled in a KI solution in sulfuric medium that consists in an indirect titration process. The end point for titration was obtained using amido gum as an indicator.24 The formation of tri-iodine ion
(I3–), stable and soluble reactional product, which possesses
the same number of equivalents than ozone, was obtained as shown in equations 16 to 18.
I– + O
3→ IO3– (16)
IO3– + 8I– + 6H+→ 3I3– + 3H2O (17)
9I– + O
3 + 6H+→ 3I3– + 3H2O (18)
The concentration of tri-iodine was dosed by using a standard solution of sodium thiosulfate as shown in equation 19.
6Na2S2O3 + 3I3–→ 3Na
2S4O6 + 6NaI+ 3HI (19)
It is relevant to emphasize that the combination among ozonator power and O2 low rate did not show linearity, and
thus, the O3 mass low rate (mg min-1) was quantiied in all
experiments of the experimental matrix. It was quantiied the O3 that was injected in the reactor, before the contact with the efluent. So, the products of the efluent do not interfere with this quantiication.
Configuration of semi-batch reactor with recycle to the catalytic ozonation process of dairy effluent
The reactor used in this work was developed after some exploratory experiments. From an operational point of view, it is worth to emphasize that the coniguration developed in this work gives the possibility to use the reactor under different systems: batch, semi-continuous with recycle and continuous one.
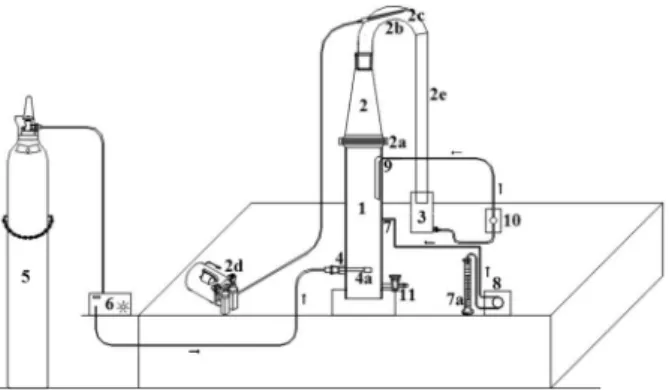
The reactor used in this work was idealized aiming efluent treatment that, besides promoting oxidation of organic matter, would concomitantly eliminate the foam formed during the treatment, without compromising the process or inluencing the kinetics of degradation. The reactor was projected in borosilicate glass that can be operated in a batch or a continuous process (Figure 1). It consists of three main modules: reactor, cone (foam separator) and reservoir.
The inferior part of the reactor is 0.42 m high and of 0.10 m internal diameter with volumetric capacity of 4.0 L supported by a wooden base.
The oxidation process of the organic matter is carried out in the reactor (1). It consists, in all its extension, of a
cylinder shape and that is where the input of O2 + O3 (4) from the ozonator (6), catalytic solution (7a), efluent feed (7) and sampling (11) occurs.
The O2 + O3 input is done at the base of the reactor (4) by
micro-bubbles, using an air-stone (4a) for better adsorption of O2 + O3 and homogenization of oxidative system. The
oxygen of the O2 cylinder (5) is converted into ozone by the method of electric discharge that occurs in the ozonator, taking into account that the input is done at the inferior part of the reactor allowing an ascending low.
The entry of the catalytic solution (7) is done at the opposite side of the O2 + O3 low. The catalytic solution (7a)
is previously prepared in sulfuric medium and introduced to the reactor by peristaltic pump (8) that is activated 10 s after the ozone input and remains active for 20 min of the whole reaction time of 30 min.
The efluent recycle entry, after the disruption of foam, is processed by the entry (9) through a pulse pump (10).
Sampling (11) was carried out manually with a kind of an open/close glass valve that allows fast sampling and closure of the system, without interference.
Module (2) is in the shape of a cone and it is attached to the reactor by a metal clip strap (2a). This is composed of a glass tube (2b) curved at 180°. This tube is comprised of an internal capillary tube with a narrower end (2c), projected in favor of the low, in which atmospheric air is introduced by a centrifuge pump with the function of disrupting supericial tension of the foam (2c). The curved end of the tube allows a perfect it to a hose (2e) for the transportation of efluent to the third module (3) (reservoir) that is connected to a pulse pump (10). This projects the liquid back to the reactional system through the entry (9) as recycling, completing the cycle of coniguration of the reactor.
Experimental design for the degradation of the dairy effluent
In order to optimize the parameters to be tested, a 24–1
fraction type of factorial statistical design was carried
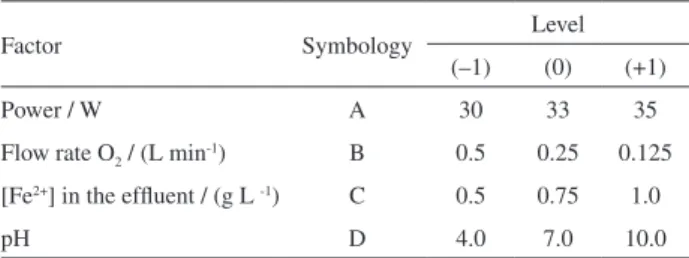
out, randomly, in duplicate with 3 central points, being the response variable the percentage of reduction of total organic carbon (TOCred) after 30 min of reaction. The independent variables (factors) proposed for this stage were ozonator power, O2 low rate of the cylinder, Fe2+
concentrations and pH. Table 1 shows the variables with respective evaluated levels.
Estimate values of ozonator power were determined by experimental measurement using a power and energy consumption measuring equipment (ICEL, model ME-2500, 220 V and 60 Hz, conformity certifying number 201111011512). Feeding the ozone generator was carried out by using oxygen gas of high nominal purity of 99.50% and a valve attached to the cylinder with an adjustment from 0 to 2 L min-1. Fe2+ concentrations were 0.5, 0.75
and 1.0 g L-1, corresponding to 5.03, 7.55 and 10.06 g of
FeSO4·7H2O with 99.0% of purity for 2 L of efluent. After evaluating better experimental conditions, the physically and chemically treated product was analyzed to verify if the quality was in accordance with discharge limits to hydric bodies or if it should undergo a biological treatment as activated sludge treatment.
Results and Discussion
Analytic characterization of effluent in natura
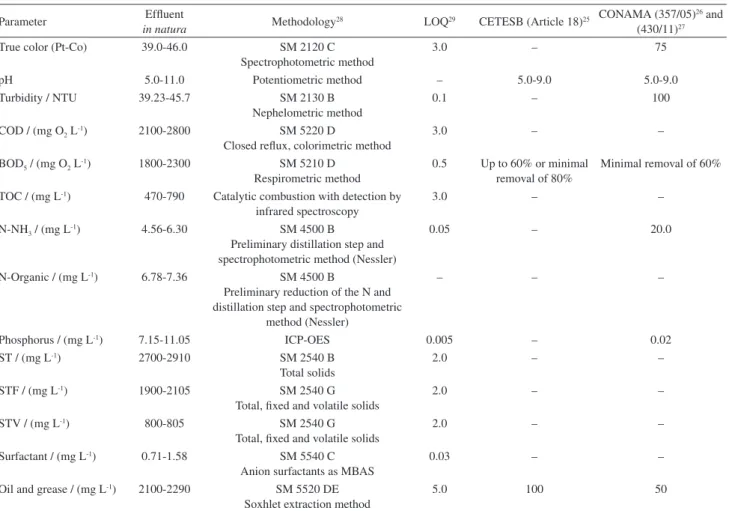
Table 2 shows the results from the physicochemical characterization of the efluent in natura of the studied industry, along with data from pertinent legislation of discharge in hydric bodies: Article 18 of Environmental
Control Agency of São Paulo State (CETESB),25 an
environmental agency in the State of São Paulo, Brazil, Resolution 357/05 of National Council of Environment
(CONAMA)26 and CONAMA Resolution 430/11 that
complements and changes 357/05.27
According to Table 2, there is a great variation in the analyzed parameters, which can be explained by different cleaning processes, physical and chemical characteristics of raw materials and processing type of products. The
variation is related to the collections made during the experimental period, not only in one day.
The dairy efluent is characterized as a white color type of efluent due to the physicochemical characteristics. The cleaning system “clean in place” (CIP), in which acidic and alkaline solutions are added, carries this cleaning water to the treatment plant resulting in a pH that can range from 2.0 to 12.0 in the homogenizer tank.30
Gases produced by the fermentation of anaerobic bacteria cause the odor; suspended solids and/or emulsiiers cause turbidity. Suspended solids are derived from milk coagulants. The loss of fat from milk that corresponds to 90% of total fat material of the efluent,31 also contributes
to the high concentration of solids.
The presence of nitrogen is related to high content of proteins but since milk is diluted in the cleaning process, this value is found under the limits of legislation concerning discharge in hydric bodies.
Although COD does not appear as one of the parameters of discharge in waters it is a factor of extreme importance for aiding in the determination of recalcitrance of a compound in relation to biochemical oxygen demand (BOD), indicating its biodegradability.32-34 High values
of COD are due to substances present in the milk; spills, leaks, deicient operations of equipment, overload of tanks and loss in the process also contribute to the increase of concentration of the organic matter of the efluent.35
Another important parameter to be analyzed is the relation between biochemical oxygen demand after ive
days incubation and chemical oxygen demand (BOD5/
COD) in which an estimate of biodegradability can be inferred.32-34 As in BOD, only the biodegradable fraction
can be measured, the higher this value is close to COD, the easier the efluent can be biodegrated.36,37
Raw liquid efluents of dairy industries show mean values of BOD5/COD in the range of 0.50 to 0.70.4 The ratio
BOD5/COD has been used by several researchers to express
biodegradability of efluents of environmental relevance, being used as a parameter in the selection of type of efluent treatment. According to results from raw efluents, the mean ratio of BOD5/COD was 0.85. After the treatment by
catalytic ozonation, this ratio reached the value of 1.27. The increase in BOD5/COD obtained suggests that the chemical
process may be used as a pre-treatment in order to improve biodegrability of the efluent. According to Balcioglu and Ötker23 the most biodegradable fraction of an efluent may
be increased by ozonation, since it leads to formation of low molecular weight by-products that are readily biodegraded. Thus, the use of biological processes for this type of efluent can be justiied, something that had already been taken into account by the company. Although activated
Table 1. Factors and levels for the treatment of 2 L of the efluent during 30 minutes
Factor Symbology Level
(–1) (0) (+1)
Power / W A 30 33 35
Flow rate O2 / (L min-1) B 0.5 0.25 0.125
[Fe2+] in the efluent / (g L -1) C 0.5 0.75 1.0
sludge process is widely used, it can be observed that in several visits to the company there was a strong and characteristic odor, high sludge production, consumption of nutrients and hydraulic retention time in the efluent treatment.
Besides all of the above mentioned, biological processes have some limitations, as a narrow range of optimal conditions (pH, temperature, nutrient concentration, residence time). Among several other restrictions, it can be cited the inability of biological processes to metabolize recalcitrant compounds.38
Several studies have been conducted in order to develop technologies that minimize industrial efluents volume and toxicity, aiming to allow not only the removal of contaminant substances, but also the complete mineralization. Toxicity associated with industrial efluents may be intimately associated with the presence of recalcitrant or refractory compounds.39
Recalcitrant or refractory compounds are not biodegraded by organisms that normally exist in treatment of biological systems, considering hydraulic retention times usually applied. However, they are frequently disposed on aquatic bodies.11
In this situation, chemical processes appear as a promising alternative for degradation of these pollutant chemical species.40
For the parameter oils and fat, it can be observed that its concentration is high due to the content of fat present in the raw efluent from processed raw material and the process adopted by industry.31
Evaluation of experimental matrix and TOCred in the design of semi-batch process with recycle
With the purpose of increasing efficiency in the ozonation reactions, especially in the removal of
Table 2. Physical and chemical characteristics of the efluent in natura
Parameter Efluent
in natura Methodology28 LOQ29 CETESB (Article 18)25
CONAMA (357/05)26 and (430/11)27
True color (Pt-Co) 39.0-46.0 SM 2120 C
Spectrophotometric method
3.0 – 75
pH 5.0-11.0 Potentiometric method – 5.0-9.0 5.0-9.0
Turbidity / NTU 39.23-45.7 SM 2130 B
Nephelometric method
0.1 – 100
COD / (mg O2 L-1) 2100-2800 SM 5220 D
Closed relux, colorimetric method
3.0 – –
BOD5 / (mg O2 L-1) 1800-2300 SM 5210 D
Respirometric method
0.5 Up to 60% or minimal
removal of 80%
Minimal removal of 60%
TOC / (mg L-1) 470-790 Catalytic combustion with detection by
infrared spectroscopy
3.0 – –
N-NH3 / (mg L-1) 4.56-6.30 SM 4500 B
Preliminary distillation step and spectrophotometric method (Nessler)
0.05 – 20.0
N-Organic / (mg L-1) 6.78-7.36 SM 4500 B
Preliminary reduction of the N and distillation step and spectrophotometric
method (Nessler)
– – –
Phosphorus / (mg L-1) 7.15-11.05 ICP-OES 0.005 – 0.02
ST / (mg L-1) 2700-2910 SM 2540 B
Total solids
2.0 – –
STF / (mg L-1) 1900-2105 SM 2540 G
Total, ixed and volatile solids
2.0 – –
STV / (mg L-1) 800-805 SM 2540 G
Total, ixed and volatile solids
2.0 – –
Surfactant / (mg L-1) 0.71-1.58 SM 5540 C
Anion surfactants as MBAS
0.03 – –
Oil and grease / (mg L-1) 2100-2290 SM 5520 DE
Soxhlet extraction method
5.0 100 50
organic matter with ozone consumption inferior to the direct ozonation, the catalytic process was used. Some considerations have to be taken into account, however, as for the employment of catalytic process: (i) solubility of catalyst in the reactional media; (ii) dificulty in reusing the catalyst used; (iii) need of using ion removal techniques due to its toxic characteristics and/or unwanted adverse effects.11
Ferrous ions were selected as catalysts for this work. Therefore, there is no deinition of the type of catalysis of the process because in acidic pH, ferrous ions are soluble (homogeneous), but in pH 7 and 10, there is a formation of a product less soluble with Fe2+ ion (heterogeneous). The
maximum concentration of Fe2+ in this work was 1.0 g L-1,
because in higher concentrations it was veriied a little reduction on the percentage of TOC reduction (TOCred).
The maximum power of the ozonator in this work was 35 W. There was a notorious and characteristic odor of ozone when pure oxygen from the cylinder was used. This could be determined qualitatively by O3 indicator paper that darkened quickly under power higher than 35 W. Maximum and minimum low rates were inverted during the treatment, being the low rate at the low level of 0.5 L min-1 and high level of 0.125 L min-1, which does not
compromise the statistical evaluation of the process. To this extent, atmospheric air was injected through a silicon hose attached to the tube containing a capillary tube, enabling the disruption of supericial tension of the foam. In all
experiments and at the irst 10 min of oxidation reaction, there was an intense formation of foam, possibly based on the fast degradation and respective mineralization of efluent to CO2. Some different causes may be considered to explain this foam formation. The wastewater may contain various substances used for cleaning equipment and factory items, such as alkaline phosphates, acids, surfactants and complexing compounds.41 The presence of large quantities
of O2 + O3 could also enhance the foam formation.
Furthermore, the foam formation could be favored by the fast degradation and respective mineralization of efluent to CO2. However, hypotheses investigation were not performed in this work.
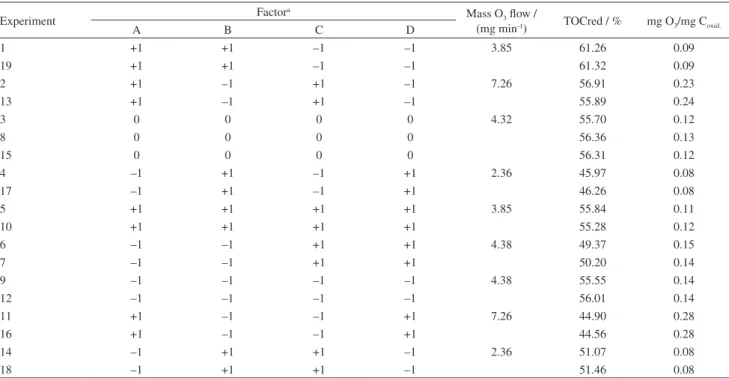
Table 3 presents the percentage of TOCred and mass ratio of O3 by oxidized carbon.
Overall, it was observed that replicates showed low deviation, which indicates good repeatability and good control of random errors.
An analysis based on results showed that the best average for TOCred (61.29%) was obtained with experiments in duplicate 1 and 19, suggesting that the ozonator power (A) must work at its highest level (35 W), O2 low rate (B) must be at 0.125 L min-1, Fe2+ concentration
(C) in 0.5 g L-1 of efluent and pH (D) 4.0.
Due to the ozonator power and O2 low rate, the average
ozone mass rate could be determined for the experimental design, being the O3 mass rate of duplicates 1 and 19
(3.85 mg min-1). The best result for the O
3 mass relation
Table 3. Percentage of TOCred and O3/oxidized carbon mass ratio
Experiment Factora Mass O3 low /
(mg min-1) TOCred / % mg O3/mg Coxid.
A B C D
1 +1 +1 –1 –1 3.85 61.26 0.09
19 +1 +1 –1 –1 61.32 0.09
2 +1 –1 +1 –1 7.26 56.91 0.23
13 +1 –1 +1 –1 55.89 0.24
3 0 0 0 0 4.32 55.70 0.12
8 0 0 0 0 56.36 0.13
15 0 0 0 0 56.31 0.12
4 –1 +1 –1 +1 2.36 45.97 0.08
17 –1 +1 –1 +1 46.26 0.08
5 +1 +1 +1 +1 3.85 55.84 0.11
10 +1 +1 +1 +1 55.28 0.12
6 –1 –1 +1 +1 4.38 49.37 0.15
7 –1 –1 +1 +1 50.20 0.14
9 –1 –1 –1 –1 4.38 55.55 0.14
12 –1 –1 –1 –1 56.01 0.14
11 +1 –1 –1 +1 7.26 44.90 0.28
16 +1 –1 –1 +1 44.56 0.28
14 –1 +1 +1 –1 2.36 51.07 0.08
18 –1 +1 +1 –1 51.46 0.08
aA: Power (W); B: O
by carbon degraded (TOC) was 0.09, which indicates that the ozonator power and O2 low rate selected were pertinent to the proposed process. Considering economical and safety aspects, it is important because O3 in excess can compromise the process.
It is not possible just through the analysis of the results of Table 3 to evaluate and optimize the best experimental conditions. However, all of the TOCred reduction responses were assessed for statistical analysis generated by Minitab 16.
First, the graphic of probabilities of percentage reduction of each output variable (TOCred) was generated, to verify the normality of experimental data of this planning. Figure 2 shows the graph of normal probability in terms of percentage of TOCred. The points in the igure correspond to the 19 experiments of the exploratory factorial matrix fractional 24–1, conducted in duplicate with
three central points.
It can be seen in Figure 2 that the graph does not follow a normal distribution with a p-value of 0.033. Even though data is aligned, 95% of data points are within the limit of experimental error for a 95% level, showing conidence to experiments. The various effects of variables may be seen
in Figure 3 and Table 4 (analysis of variance, ANOVA) and in Figure 4 (Pareto chart).
Figure 3 shows the main effects of parameters for percentage of TOCred. It can be seen that for the highest percentage of TOCred, the best condition is found with factors A, B and C adjusted in the central point (33 W; 0.25 L min-1 and 0.75 g Fe2+ L-1 respectively), while D
factor was at low level (pH 4.0).
Figure 2. Normal probability on percentage of TOCred, considering 95% conidence interval.
Figure 3. Main effects for percentage of TOCred variation measurements.
Table 4. Analysis of variance from the mean values of percentage reduction in TOCred array 24–1 for the treatment of dairy wastewater by catalytic ozonation
Term Effect Coef SE Coef T p-value
Constant – 52.616 0.09037 582.24 0.000
Power 3.759 1.879 0.09037 20.80 0.000
Flow O2 1.884 0.942 0.09037 10.42 0.000
[Fe] 1.274 0.637 0.09037 7.05 0.000
pH –7.136 –3.568 0.09037 –39.48 0.000
Power × Flow O2 5.976 2.988 0.09037 33.07 0.000
Power × [Fe] 1.696 0.848 0.09037 9.39 0.000
Power × pH –1.564 –0.782 0.09037 –8.65 0.000
%TOCred = (Constant) + (Coef × Power) + (Coef × Flow) + (Coef × [Fe]) + (Coef × pH) + (Coef × Power × Flow) + (Coef × Power × [Fe]) + (Coef × Power × pH).
Figure 4. Pareto chart of the standardized effects considering α = 0.05.
The analysis of variance consists in a group of statistical models such as least squares for the evaluation of total sample variance that can be attributed to different factors of experimental error. Figure 3 shows that the best and highest percentage of TOCred is working with the power low, and [Fe2+] at the central point, or 33W power, the O
2 low
rate 0.25 L min-1 and [Fe2+] 0.75 g L-1 efluent, obtaining
reductions getting TOCred above 56%.
Table 4 presents factors of analysis of variance (ANOVA) involved in the catalytic ozonation process.
Through ANOVA (Table 4), it can be observed that all studied variables were signiicant on the studied process with p-value, which is approximately zero (since we showed only three digits on the table, it appears as being “0.000”). A p-value ranges from 0 to 1. The p-value is calculated from the observed sample and represents the probability of incorrectly rejecting a null hypothesis that is true indeed (type I error). Minitab 16 automatically displays
p-values for most hypothesis tests. These results were also conirmed by a Pareto diagram with 95% conidence, presented in Figure 4.
To the variable response TOCred, the factor power (A) was more signiicant than the interaction power-iron (AC) which indicated that the direct ozonation is more reoccurring.
Based on the design of experiment used, a statistical model was proposed in order to predict the behavior of the catalytic ozonation process. Equation 20 represents the model obtained (considering ANOVA in Table 4), having the response factor percentage of TOCred.
% TOCred = 52.616 + 1.879 × [Power] + 0.942 × [Flow] + 0.637 × [Fe] + (–3.568) × [pH] + 2.988 × [Power × Flow] + 0.848 × [Power × Fe] + (–0.782) ×
[Power × pH] (20)
The mathematical model obtained does not demonstrate lack of adjustment and presents an R2 of 99.73% of
variations around the mean. Therefore, the optimization of variables can be found at power (35 W), O2 low rate (0.125 L min-1), Fe2+ concentration (1.0 g L-1) and pH (4.0),
with 64.26% of TOCred.
The best experiment with variables at the optimized level were carried out obtaining a mean value (triplicate) of 64.03% in the TOCred, which is close to the theoretical one, 64.26%.
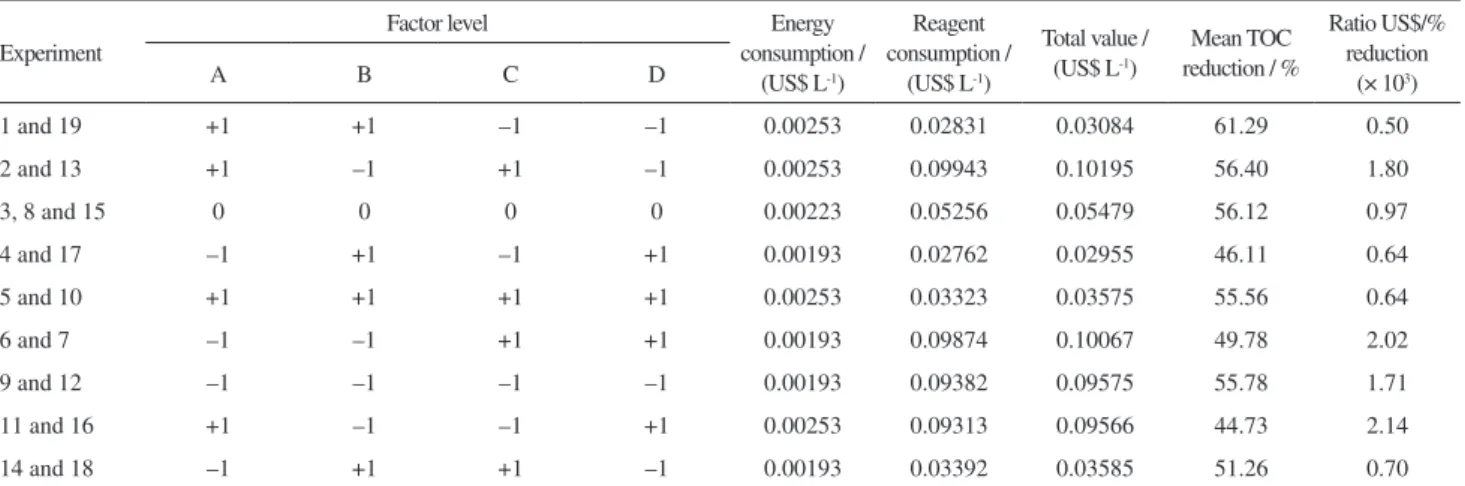
Economic evaluation of semi-batch process with recycle
Estimate values of energetic consumption of equipment were determined by experimental measurement considering the time of 30 min. Table 5 shows the estimated cost of experiments for the experimental planning used.
Overall, Table 5 shows that the best result of the process is also the one with lower cost/TOCred ratio. As it can be observed in experiments 1 and 19 of design 24–1,
in which the mean was 61.29% of degradation of TOCred concentration and its cost/TOCred ratio (0.50), the ratio is the lowest of all the other experiments.
According to the statistical modelling, the optimization of variables shows 64.03% of TOCred with a cost of US$ 0.03644 L-1 of efluent, in which the change happens
only with the Fe2+ concentration factor. Even with the
change in ferrous concentration, the estimate is relatively the same (US$ 0.03 L-1 of treated efluent), being the best
cost/TOCred ratio of the catalytic ozonation process the one in which optimized variable conditions were ozonator power (35 W), O2 low rate (0.125 L min-1), Fe2+
concentration (1.0 g L-1) and pH (4.0).
Loures et al.44 carried out a study of the application of
photo-Fenton process followed by a biological treatment in
Table 5. Values of energy consumption and reagents per liter of dairy efluent treated by catalytic ozonation process of duplicate and triplicate experiments
Experiment
Factor level Energy
consumption / (US$ L-1)
Reagent consumption /
(US$ L-1)
Total value / (US$ L-1)
Mean TOC reduction / %
Ratio US$/% reduction
(× 103)
A B C D
1 and 19 +1 +1 –1 –1 0.00253 0.02831 0.03084 61.29 0.50
2 and 13 +1 –1 +1 –1 0.00253 0.09943 0.10195 56.40 1.80
3, 8 and 15 0 0 0 0 0.00223 0.05256 0.05479 56.12 0.97
4 and 17 –1 +1 –1 +1 0.00193 0.02762 0.02955 46.11 0.64
5 and 10 +1 +1 +1 +1 0.00253 0.03323 0.03575 55.56 0.64
6 and 7 –1 –1 +1 +1 0.00193 0.09874 0.10067 49.78 2.02
9 and 12 –1 –1 –1 –1 0.00193 0.09382 0.09575 55.78 1.71
11 and 16 +1 –1 –1 +1 0.00253 0.09313 0.09566 44.73 2.14
14 and 18 –1 +1 +1 –1 0.00193 0.03392 0.03585 51.26 0.70
dairy efluents. Best experimental conditions had percentage of TOCred as response variable and they were: temperature at 30 ºC; pH 5.0; concentration of peroxide of 0.255 mol L-1;
Fe2+ concentration of 0.0108 mol L-1; UV irradiation of 15 W
and time of 60 min. Under these conditions, they obtained 54.96% of TOCred. Results showed high eficiency with
biological treatment after the AOP where COD, BOD5
and TOCred were 91, 74 and 91%, respectively. The total estimate cost of photo-Fenton treatment was US$ 0.0893 L-1
of efluent with a cost/TOCred ratio of 1.62.
Salazar and Izário Filho45 studied the heterogeneous
photocatalytic process to reduce the organic matter of dairy industry efluent. Titanium dioxide (TiO2) was used
as the semiconductor with solar radiation. Best conditions of the treatment step having percentage of reduction of COD were: time of reaction of 180 min, TiO2 anatase and pH 5.0 obtaining 54.77% of COD reduction.
In addition, Samanamud et al.46 studied the hetereogeneous
photocatalytic process on dairy efluent treatment. In this study, ZnO was employed as the semiconductor using solar radiation. Degradation was measured in terms of percentage of TOCred, the highest eficiency was found at pH 8.0 with a TOCred of 14.23% of degradation with a reaction time of 180 min. The photocatalytic treatment had an estimate cost of US$ 0.0055 L-1 of efluent, but with a cost/TOCred
ratio of 0.39.
It can be observed that in the heterogeneous catalysis with UV radiation, the reaction time to obtain a signiicant reduction of organic content is higher when compared to homogeneous catalytic processes.
Conclusions
The designed reactor showed eficiency in disrupting the supericial tension of foam, without compromising the volume, and, possibly, the kinetics of the reaction.
The optimization of the variables of the process via mathematical model showed a TOCred of 64.03%, ozonator power of 35 W, O2 low rate of 0.125 L min-1, Fe2+
concentration of 1.0 g L-1 and pH 4.0, with an estimate cost
of US$ 0.03 L-1 of efluent.
The treatment performed was insuficient to guarantee direct discharge to supericial water. However, signiicant reduction in TOCred concentration makes that the chemically treated product (catalytic ozonation with ferrous ion), with signiicant cost/TOCred ratio, shows better characteristics prior undergoing a biological treatment, reducing hydraulic retention time, risk of overloading and oscillations in the organic matter content. However, other characteristics, as pH and residual ozone should be considered, too.
Acknowledgements
The authors thank Cia. de Alimentos Glória, Guaratinguetá, São Paulo for the dairy efluent sample provided for this work, as well as the laboratories used for this study. Likewise, thanks to the Coordinating Agency for Advanced Training of Graduate Personnel (Coordenação de Aperfeiçoamento de Pessoal de Nível Superior, CAPES) for inancial support of this Master’s study. FAPESP Process 2009/17650-2.
References
1. Vourch, M.; Balannec, B.; Chaufer, B.; Dorange, G.;
Desalination2008, 219, 190.
2. Nirenberg, L. P.; Ferreira, O. M.; Tratamento de Águas Residuárias de Indústria de Laticínios: Eficiência e Análise de Modelos Matemáticos do Projeto da Nestlé; Goiania: Universidade Católica de Goiás, 2005, 18 p.
3. Cammarota, M. C.; Freire, D. M. G.; Bioresour. Technol. 2006,
97, 2195.
4. Machado, R. M. G.; Freire, V. H.; Silva, P. C.; Figuerêdo, D. V.; Ferreira, P. E.; Controle Ambiental nas Pequenas e Médias Indústrias de Laticínios, 1a ed.; Segrac: Belo Horizonte, 2002, p. 223.
5. Rey, A.; Faraldos, M.; Casas, J. A.; Zazo, J. A.; Bahamonde, A.;
Appl. Catal., B2009, 86, 69.
6. Ferreira, I. V. L.; Daniel, L. A.; Eng. Sanit. Ambiental2004, 9, 335.
7. Morais, J. L.; Sirtori, C.; Peralta-Zamora, P. G.; Quim. Nova
2006, 29, 20.
8. Bacioglu, I. A.; Arslan, I.; Water Sci. Technol. 2001, 43, 221. 9. Kasprzyk-Hordern, B.; Ziólek, M.; Nawrocki, J.; Appl. Catal., B
2003, 46, 639.
10. Von, G. U.; Water Res. 2003, 37, 1443.
11. Assalin, M. R.; Durán, N.; Analytica2007, 26, 76.
12. Beltrán, F. J.; Ozone Reaction Kinetics for Water and Wastewater Systems; Lewis Publishers: Boca Raton, 2004, p. 358. 13. Langlais, B.; Reckhow, D. A.; Brink, D. R.; Ozone in Water
Treatment: Application and Engineering; 1st ed.; Lewis Publishers: Chelsea, 1991, p. 569.
14. Hoigne, J.; Bader, H.; Water Res. 1976, 10, 377. 15. Sauleda, R.; Brillas, E.; Appl. Catal., B2001, 29, 135. 16. Piera, E.; Calpe, J. C.; Brillas, E.; Doménech, X.; Peral, J.; Appl.
Catal., B2000, 27, 169.
17. Arslan, I.; Balcioglu, I. A.; Tuhkanen, T.; Water Sci. Technol. 2000, 42, 13.
18. Legube, B.; Leitner, N. K. V.; Catal. Today1999, 53, 61. 19. Béltran, F. J.; Rivas, F. J.; Gimeno, O.; J. Chem. Technol.
Biotechnol. 2005, 80, 973.
21. Freire, R. S.; Kubota, L. T.; Durán, N.; Environ. Technol. 2001,
22, 897.
22. Sevimli, M. F.; Kinaci, C.; Water Sci. Technol. 2002, 45, 279. 23. Balcioglu, I. A.; Ötker, M.; Chemosphere2003, 50, 85. 24. Vogel, A. I.; Vogel’s Qualitative Inorganic Analysis, 7th ed.;
Prentice Hall, Englewood Cliffs, 1996, p. 300.
25. Environmental Control Agency of São Paulo State (CETESB);
Prevenção e o Controle da Poluição do Meio Ambiente, Decreto No. 8,468, de 8 de Setembro de 1976, Artigo 18, http://www. cetesb.sp.gov.br/Institucional/documentos/Dec8468.pdf accessed in April 2015.
26. Ministério do Meio Ambiente, Conselho Nacional do Meio
Ambiente (CONAMA); Dispõe sobre a Classificação
dos Corpos de Água e Diretrizes Ambientais para o seu Enquadramento, bem como Estabelece as Condições e Padrões de Lançamento de Efluentes, e dá outras Providências, Resolução No. 357 de 17 de Março de 2005, http://www.mma. gov.br/port/conama/res/res05/res35705.pdf accessed in April 2015.
27. Conselho Nacional do Meio Ambiente (CONAMA); Dispõe sobre Condições e Padrões de Lançamento de Efluentes, Complementa e Altera a Resolução No. 357, de 17 de março de 2005, do Conselho Nacional do Meio Ambiente - CONAMA, Resolução No. 430 de 13 de maio de 2011, http://www.mma. gov.br/port/conama/legiabre.cfm?codlegi=646 accessed in April 2015.
28. American Public Health Association (APHA), American Water Works Association (AWWA), Water Environment Federation (WEF); Standard Methods for the Examination of Water and Wastewater, 20th ed.; APHA: Washington, D.C., 1998. 29. Thompson, M.; Ellison, S. L. R.; Wood, R.; Pure Appl. Chem.
2002, 74, 835.
30. Tetra Pack; Dairy Processing Handbook; Tetra Pack Processing System AB: Lund, 1995, https://www.docenti.unina.it/ downloadPub.do?tipoFile=md&id=282957 accessed in April, 2015.
31. Hansen, A. P.; Saad, S.; Jones, V. A.; Carawan, R. E.; J. Dairy Sci. 1977, 59, 1222.
32. Malato, S.; Blanco, J.; Richter, C.; Fernández, P.; Maldonado, M. I.; Sol. Energy Mater. Sol. Cells2000, 64, 1.
33. Malato, S.; Blanco, J.; Fernandez-Alba, A. R.; Aguera, A.;
Chemosphere2000, 40, 403.
34. Reuschenbach, P.; Pagga, U.; Strotmann, U.; Water Res. 2003,
37, 1571.
35. Tommaso, G.; Ribeiro, R.; Oliveira, C.; Stamatelatou, K.; Antonopoulou, G.; Lyberatos, G.; Hodúr, C.; Csanadi, J. In
Novel Technologies in Food Science: Their Impact on Products, Consumer Trends and the Environment; Sobral, P. J. A.; McElhatton, A., eds.; Springer: New York, 2011, p. 381. 36. Hu, Z.; Grasso, D. In Encyclopedia of Analytical Science,
2nd ed.; Worsfold, P.; Poole, C., eds.; Elsevier: Oxford, 2005. 37. Aquino, S. F.; Silva, S. Q.; Chernicharo, C. A. L.; Eng. Sanit.
Ambiental2006, 11, 295.
38. Freire, R. S.; Pelegrini, R.; Kubota, L. T.; Durán, N.; Peralta-Zamora, P.; Quim. Nova2000, 23, 504.
39. Almeida, E.; Assalin, M. R.; Rosa, M. A.; Durán, N.; Quim. Nova2004, 27, 818.
40. Álvares, A. B. C.; Diaper, C.; Parsons, S. A.; Environ. Technol. 2001, 22, 409.
41. Chipasa, K. B.; Mechzyeka, K.; J. Ind. Microbiol. Biotechnol.
2006, 33, 635.
42. h t t p : / / e c o n o m i a . u o l . c o m . b r / c o t a c o e s / n o t i c i a s / redacao/2014/12/02/dolar-sobe-067-e-atinge-r-2576-apesar-de-atuacao-do-banco-central.htm accessed on December, 2014. 43. http://www.aneel.gov.br/493.htm accessed on December 8,
2014.
44. Loures, C. C. A.; Izário Filho, H. J.; Samanamud, G. R. L.; Souza, A. L.; Salazar, R. F. S.; Peixoto, A. L. C.; Guimarães, O. L. C.; Int. Rev. Chem. Eng. 2013, 5, 280.
45. Salazar, R. F. S.; Izário Filho, H. J.; Augm Domus2009, 1, 27. 46. Samanamud, G. L. R.; Loures, C. C. A.; Souza, A. L.; Salazar, R. F. S.; Oliveira, I. S.; Silva, M. B.; Izário Filho, H. J.; Int. Rev. Chem. Eng. 2012, 2012, 1.
Submitted: January 26, 2015 Published online: May 12, 2015