*Correspondence: V. B. Boralli. Laboratório de Análises de Toxicantes e Fármacos, Departamento de Análises Clínicas e Toxicológicas, Faculdade de Farmácia, Universidade Federal de Alfenas. Rua Gabriel Monteiro da Silva, 700, 37130-000 – Alfenas - MG, Brasil. E-mail: [email protected]
A
vol. 50, n. 3, jul./sep., 2014 http://dx.doi.org/10.1590/S1984-82502014000300013
Quick and simple LC-MS/MS method for the determination of
simvastatin in human plasma: application to pharmacokinetics and
bioequivalence studies
Suéllen Cristina Rennó Silva
1, Gustavo Rodrigues de Rezende
2, Vanessa Bergamin Boralli
1,*1Laboratório de Análises de Toxicantes e Fármacos, Departamento de Análises Clínicas e Toxicológicas,
Faculdade de Farmácia, Universidade Federal de Alfenas Alfenas, MG, Brazil, 2Centro de Pesquisa em Biotecnologia Ltda, Belo Horizonte, MG, Brazil
A simple, rapid, and sensitive method based on liquid chromatography-tandem mass spectrometry for the quantitative determination of simvastatin in human plasma was developed and validated. After a simple extraction with methyl tert-butyl ether, the analyte and internal standard (lovastatin) were analyzed using reverse-phase liquid chromatography, on a Kinetex C18 column (100 × 4.6 mm, 2.6 μm) using acetonitrile: ammonium acetate (2 mM + 0.025 % formic acid) (70: 30, v/v) as a mobile phase in a run time of 3.5 min. Detection was carried out using electrospray positive ionization mass spectrometry in the multiple-reaction monitoring mode. The method was linear over 0.04-40.0 ng/mL concentration range. The mean extraction recovery of simvastatin was 82% (RSD within 15%). Intraday and interday precisions (as relative standard deviation) were all ≤8,7% with accuracy (as relative error) of ±8%. This
rapid and reliable method was successfully applied for a bioequivalence study of 40 mg of simvastatin orally disintegrating tablets in 44 healthy volunteers, showing that this method is suitable for the
quantiication of simvastatin in human plasma samples for pharmacokinetics and bioequivalence studies.
Uniterms: Simvastatin/determination. Liquid chromatography/quantitative analysis. Tandem mass spectrometry/quantitative analysis. Human plasma/determination of simvastatin. Simvastatin/
bioequivalence. Simvastatin/pharmacokinetics.
Desenvolveu-e e validou-se um método simples, rápido e sensível baseado na cromatograia líquida
acoplada à espectrometria de massas em tandem para a quantiicação de sinvastatina em plasma humano.
Após um simples preparo de amostras utilizando extração com éter metil-terc-butílico, o analito e seu
padrão interno (lovastatina) foram analisados por cromatograia líquida de fase reversa, em uma coluna
Kinetex C18 (100 mm x 4,6 mm x 2,6 μm), utilizando uma fase móvel composta de acetonitrila:acetato de amônio (2 mM + 0,025% ácido fórmico) (70:30, v/v) em tempo total de corrida de 3,5 min. A
detecção foi realizada por espectrometria de massas utilizando a ionização por electrospray no modo
positivo e monitorando os íons pelo sistema de monitoramento de reação múltipla. O método apresentou linearidade na faixa de 0,4 – 40,0 ng/mL. A recuperação média obtida para sinvastatina foi de 82% (DPR menor que 15%). A precisão intradia e interdias (como desvio padrão relativo) foi ≤8,7% com exatidão (como erro relativo) de ± 8%. Este método rápido e coniável foi aplicado com sucesso em um estudo de bioequivalência de comprimidos de desintegração oral de sinvastatina 40 mg em voluntários sadios, mostrando que este método é adequado para a quantiicação de sinvastatina em plasma humano para
estudos farmacocinéticos e bioequivalência.
Unitermos: Sinvastatina/determinação. Cromatograia líquida/análise quantitativa. Espectrometria de massas em tandem/análise quantitativa. Plasma humano/determinação de sinvastatina. Sinvastatina/
INTRODUCTION
Simvastatin is a cholesterol-lowering agent (Hoffman
et al., 1986) and acts as a 3-hydroxy-3-methylglutaryl-coenzyme A (HMG-CoA) reductase inhibitor effective in the treatment of hypercholesterolemia. It is an inactive
hydrophobic lactone prodrug, which is metabolized in
vivo to several more polar, pharmacologically active,
compounds, most notably the corresponding hydroxy acid form, simvastatin acid (Mauro, 1993).
After an oral dose, the concentration of simvastatin in plasma is very low, probably because of high irst-pass hepatic extraction resulting in low oral bioavailability (5%) (Mauro, 1993; Vickers et al., 1990). Therefore, sensitive and selective methods for the determination of simvastatin in plasma have been required for therapeutic drug level monitoring.
Several methods for simvastatin determination in plasma have been reported, including gas chromatography-mass spectrometry (GC-MS) (Takano, Abe, Hata, 1990), liquid chromatography coupled to UV detector (LC-UV)
(Carlucci et al., 1992), and liquid chromatography coupled
to luorescence detector (LC-luorescence) (Ochiai et al., 1997). However, GC-MS and LC-luorescence methods include analyte derivatization with a generally complicated sample preparation procedure; LC-UV methods are not sensitive enough for measuring drug levels in plasma at therapeutic dose.
UPLC-MS/MS (ultra-performance liquid chromatography tandem mass-spectrometry) has numerous advantages, for example, very selective separations, comparatively short analysis times, and simple preliminary treatment of the sample.
The present paper reported an original UPLC-MS/ MS method for the quantiication of simvastatin in human plasma, requiring a simple sample treatment using one-step extraction with a run time of only 3.5 min for each sample. This method exhibited excellent performance in terms of recovery, precision, accuracy, matrix effect, and low detectability (LLOQ of 0.4 ng/mL). The suitability of this UPLC-MS/MS method for routine bioanalysis was proven by its application in sample quantiication of clinical bioequivalence trials of two branded simvastatin tablets.
MATERIAL AND METHODS
Chemicals and reagents
Simvastatin USP reference standard (lot no. I1H070) and the internal standard (lovastatin, lot no. H4K027) were
purchased from United States Pharmacopeia (Rockville, USA); the reference formulation was simvastatin tablet (each tablet containing 40 mg of simvastatin) provided by Merck Sharp & Dohme Ltd. (Northumberland, UK), and the test formulation was simvastatin tablet (40 mg) provided by a Brazilian company (protected name by contractual confidentiality). Ammonium acetate,
acetonitrile, and methyl tert-butyl ether (MTBE) were
HPLC grade purchased from J.T. Baker (Phillipsburg, NJ, USA). Formic acid was from Sigma-AldrichTM (St.
Louis, Missouri, USA), and ammonium hydroxide was
from VetecTM (Rio de Janeiro, RJ, Brazil). Deionized water
was prepared through the Milli-Q Plus Ultra-Pure water system (Millipore Corporation, Bedford, MA, USA). Heparinized blank (drug-free) human plasma was obtained from CEBIO clinic step, Belo Horizonte hospital (Belo Horizonte, MG, Brazil).
Instrumentation
The UPLC-MS/MS system consisted of a Waters Acquity UPLCTM H-Class system coupled to a triple
quadrupole TQDTM mass spectrometer (Waters, Milford,
MA, USA), which is equipped with electrospray ionization (ESI) source for ion production. Data acquisition and
integration were controlled by MassLynxTM software
(Version 4.1, Waters).
LC-MS/MS conditions
The chromatographic separation was performed
on a Kinetex C18 column (100 × 4.6 mm I.D., 2.6 μm,
Phenomenex, Torrance, CA, USA) maintained at 45 °C. The mobile phase consists of a mixture of acetonitrile: ammonium acetate (2 mM + 0.025% formic acid) (70:30, v/v) at a low rate of 1.0 mL/min. The column efluent was split so that approximately 0.2 mL/min entered the mass spectrometer, and the injection volume via autosampler (set as 5 °C) was 20 μL. The ESI source was operated on the positive ionization mode using multiple-reaction monitoring (MRM) of transitions of the protonated
molecular ions. These transitions (m/z) with associated
Preparation of standard and quality control (QC) samples
A stock solution (1 mg/mL) of simvastatin was diluted with acetonitrile: water (50: 50, v/v) to produce standard solutions with concentrations of 4, 10, 25, 50, 100, 150, 250, and 400 ng/mL. Quality control (QC) solutions were prepared independently at low, medium, and high concentrations (12, 120, and 300 ng/mL) in the
same way. A 50-μL aliquot of each standard solution was
mixed with 450 μL of pooled blank plasma (obtained
from healthy human volunteers) to produce calibration standards of simvastatin with concentrations of 0.4, 1, 2.5, 5, 10, 15, 25, and 40 ng/mL. QC samples (1.2, 12, and 30 ng/mL) were generated from QC solutions with the same procedure. A stock solution (1 mg/mL) of lovastatin (IS) was prepared with acetonitrile: water (50: 50, v/v) and diluted in acetonitrile to give a inal concentration of
0.15 μg/mL. The solutions were stored at 5 °C, and the
plasma samples were stored in a -20 °C freezer.
Sample preparation
Plasma samples (500 μL) were placed into 2.0 mL
Eppendorf tubes. After adding 50 μL of IS, the sample
extraction was followed by adding 50 μL of 50 mM
ammonium acetate buffer (pH 4.5) and extracted with 1000 µL of methyl tert-butyl ether (MTBE) for 5 min. After centrifugation at 5000 g/5 °C for 5 min, 850 µL of the organic phase was transferred to another tube and evaporated to dryness under a gentle stream of air at room temperature. The residues obtained were reconstituted in 200-µL aliquots of mobile phase and 20 µL injected into the UPLC-MS/MS system.
Method validation
Method validation was performed according to ANVISA Guide for analytical and bioanalytical method validation (ANVISA, 2003) and according to FDA Guidance for Industry, Bioanalytical Method Validation (US Food and Drug Administration, 2001). Selectivity was assessed by comparing chromatograms of spiked plasma samples in the lower limit of quantification (LLOQ) concentration with plasmas from six different individuals. Linearity, in the range of 0.4-40 ng/mL, was evaluated using the assay of three independent analytical curves on
3 different days by weighted linear regression (1/x2) of
analyte/IS peak area ratios. Lower limit of quantiication (LLOQ) was deined as the lowest concentration of analyte that could be quantitatively determined with precision of
≤ 20% and accuracy of 80-120% (ANVISA, 2003; Food and Drug Administration, 2001). Accuracy (as relative error - RE) and precision (as relative standard deviation - RSD) were determined by assay of seven replicates of low, medium, and high QC samples on 3 different days. The intraday and interday precisions were required to be lower than 15% and the accuracy to be within ± 15%, except at LLOQ, where it should not exceed 20% (ANVISA, 2003; Food and Drug Administration, 2001). Recovery was determined by comparing the mean peak areas for five replicate analysis of low, medium, and high QC samples with those of blank plasma extracts reconstituted with the corresponding QC solutions. Recovery of the analyte need not be 100%, but the extent of recovery of an analyte and the internal standard should be consistent, precise, and reproducible (ANVISA, 2003; Food and Drug Administration, 2001). Matrix effects can be described as the difference between the mass spectrometric response for an analyte in standard solution and the response for the same analyte in a biological matrix, such as plasma (Kebarle, Tang, 1993). Matrix effects were carried out by monitoring the instrument response of a constantly infused analytes after injecting an extract from an extracted blank sample into the UPLC-MS/MS system. This approach identifies chromatographic regions where an analyte would be most susceptible to suppression or enhancement. The stability of analytes was evaluated under all the storage conditions at two QC concentrations (low and high). The tested samples were compared with freshly prepared samples in ive replicates. The long-term stability was assessed after storage of QC samples at –20 °C for 90 days. For the short-term stability, QC samples were kept at room temperature for 19 h. The freeze/thaw stability test was performed after three complete freeze/ thaw cycles (- 20 °C to room temperature). Stability of processed samples was assessed by injection of extracted QC samples after conservation for 73 h at 5 °C. The stock solutions of simvastatin and lovastatin stored at 5 °C were compared with freshly prepared solutions after 60 days, and the same procedure was done to the solutions stored at room temperature for 18 h.
Pharmacokinetic study
period of one week. In each study period, volunteers were required to fast for approximately 8 h before the dosing. The formulations were administered with 200 mL water. Water and food were not allowed until 4 h after administration. Standardized meals were provided after 4, 7, and 11 h of blood sampling. A total of forty-four male and female volunteers (age 18 – 40 years; body mass index 18.5-27.0 kg/m2) were considered to be in good health
based on their medical history, physical examination, and routine laboratory tests. All volunteers read the protocol and gave written informed consent before entering the study. They were instructed to abstain from using any medications for at least one week before and during the study and from smoking and taking alcohol, caffeine, and xanthenes at least 48 h before administering the study drugs and throughout the study. Blood samples were collected into heparinized tubes before administration and at 0.33, 0.66, 1, 1.33, 1.66, 2, 2.33, 2.66, 3, 3.33, 3.66, 4, 6, 8, 10, 12, and 24 h post-dose (40 mg simvastatin tablet). Plasma was separated immediately by centrifugation at 1800 g for 15 min and stored at –20 °C before analysis. The analytical batch consisted of blank, blank with internal standard (zero), eight calibration standards, and volunteer plasma samples involved in the study with QC samples interspersed (low, medium, and high concentrations).
RESULTS AND DISCUSSION
LC-MS/MS conditions
The ion mass spectra of each analyte are shown in Figure 1. The spectra were similar to those shown in previous reports for simvastatin and lovastatin
(Apostolou et al., 2008; Nováková et al., 2009). The
most abundant product ion of each analyte was selected for MRM monitoring. In both analytes, protonated
molecule [M+H]+ was monitored in electrospray positive
ionization mode. Therefore, the ion transitions m/z
419.3>199.0 and 405.0>199.0 were selected for MRM of the simvastatin and the IS, respectively. Argon was used as collision gas, and collision energy was optimized for each analyte.
UPLC was used as separation method for the analysis of simvastatin and lovastatin. The chromatographic conditions were investigated on several different reversed
phase columns (BEH C18, Symmetry C18, Kinetex C18)
to obtain a suitable retention time and symmetrical peak shape. To get the shortest analysis time and avoid the matrix effects, different percentages of acetonitrile were tested. In early experiments, acetonitrile: ammonium acetate (2 mM + 25% formic acid) (85: 15, v/v) was
applied as mobile phase, but when it was changed for acetonitrile: ammonium acetate (2 mM + 0,025% formic acid) (70: 30, v/v), the signal achieved the maximum response and had better peak shapes. On the other hand, these changes greatly increased the running time. This mobile phase was deemed unacceptable for practical routine use. Therefore, to reduce the running time, the mobile phase low was increased to 1.0 mL/min with a split ratio of 1: 4 (MS/MS:waste). This last condition allowed a running time of 3.5 min with enough simvastatin area response at LLOQ concentration.
The best combinations of peak shape and retention
time were achieved using Kinetex C18 column (100 mm
x 4.6 mm, 2.6 μm) using acetonitrile: ammonium acetate
(2 mM + 0,025% formic acid) (70: 30, v/v) as a mobile phase, which was operated isocratically in 1.0 mL/min at a column temperature of 45 °C.
Sample preparation
Different methods of sample preparation including solid-phase extraction (SPE), protein precipitation, and liquid-liquid extraction (LLE) with various organic solvents (such as ethyl acetate, hexane, dichloromethane,
FIGURE 1 - Ion mass spectra [M+H]+: (A) simvastatin precursor
chloroform, and methyl tert-butyl ether) were evaluated. SPE required lengthy extraction procedure when compared with a simple LLE. Protein precipitation introduces serious matrix effects. Besides, a dirty extract may damage the equipment during bioanalytical routine. LLE using MTBE had numerous advantages, for example, very simple sample preparation, clean extracts, high extraction efficiency, and fast organic solvent evaporation. The addition of ammonium acetate buffer (pH 4.5) to plasma before extraction enhanced the recovery of simvastatin and IS. It could also help in displacing drug from protein and to prevent interconversion between simvastatin and simvastatin acid, at the same time maintaining the acidic analytes in a nonionic lipophilic form. Consistent and reproducible recoveries were obtained using MTBE as an extraction solvent in comparison with the other tested ones.
Assay validation
Selectivity
There was no significant interference from endogenous substances in human plasma at the analytes retention time window. Figure 2 shows typical MRM chromatograms of blank human plasma and a plasma sample spiked at the LLOQ (0.4 ng/mL) concentration
in both ion transitions determined (m/z 419.3>199.0 and
405.0>199.0). The chromatograms show excellent peak shape for both the analyte and IS, and the retention times were short enough to allow a run time of 3.5 min, which is suitable for routine analysis. The areas observed at the retention time windows of simvastatin and lovastatin were less than 20% of their LLOQ area (m/z 419.3>199.0), and it was less than 5% IS area, as observed in the LLOQ
sample (m/z 405.0>199.0).
FIGURE 2 - Blank human plasma chromatograms m/z 419.3>199.0 (A); 405.0>199.0 (B) and a plasma sample spiked at the LLOQ
(0.4 ng/mL) concentration m/z 419.3>199.0 (C); 405.0>199.0 (D).
Linearity and sensitivity
The eight-point calibration curve obtained using
weighted linear regression (1/x2) showed good linearity
over the whole concentration range (0.4–40 ng/mL), which covered the concentrations found in human plasma after administration of simvastatin in this pharmacokinetic study. The correlation coeficient was better than 0.99, and
a typical equation of calibration curve was y = 0.121288x
- 0.0000502624. The least-squares linear regression was used to mathematically deine the calibration line.
A weighting factor (1/x2) was used to avoid bias at the
calibration line in favor of the high standards. This was especially important because a wide calibration range was selected. The LLOQ (deined as the lowest concentration that could be analyzed with acceptable accuracy and precision (20%) was 0.4 ng/mL with a mean accuracy of 103.3% and a mean precision of 12.3% (n = 7).
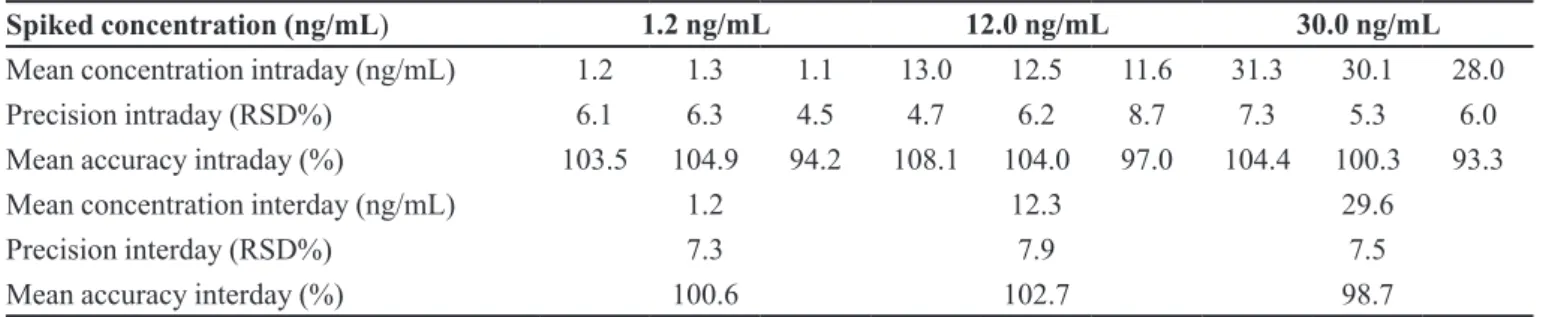
Accuracy and precision
The assay procedure proved to be precise and accurate. The intraday (n = 7) and the interday precision (n = 3 days, seven replicates per day) showed results lower than 15% RSD, for the three QC concentrations. The intraday and the interday accuracy, expressed as a percentage of nominal values, showed values within ±15%, for all three QC concentrations (Table I).
Recovery and matrix effects
lactone and acid form. The optimum pH for the extraction buffer was between 4 and 5. Any pH>5 would produce lower extraction eficiency. A pH of 4.5 was chosen after evaluation of three pH values between 4 and 5.
The samples were puriied using a simple process of liquid - liquid extraction (LLE) using MTBE as extractor solvent, which allowed good recovery for simvastatin and lovastatin compared with other tested solvents. As shown in Table II, the mean extraction recoveries measured from the LLE extraction procedure were approximately 80% for both drugs.
The postcolumn infusion method was enough in matrix effects determination. As shown in Figure 3, there was no ion suppression or ion enhancement at the chromatographic retention times of both analytes. This
technique allows one to intelligently modify the elution time of an analyte so that it does not fall into suppression/ enhancement zones.
The evaluation of possible matrix effects is an essential part of method development/validation for any LC-MS-MS method. If relevant matrix effects are found, they should be reduced or eliminated by the optimization of chromatographic conditions, improving the sample clean-up and/or by changing the type of ionization employed. Typically, suppression or enhancement of analyte response is accompanied by diminished precision and accuracy of subsequent measurements. Thus, matrix effects can limit the utility of LC-MS/MS for quantitative analysis.
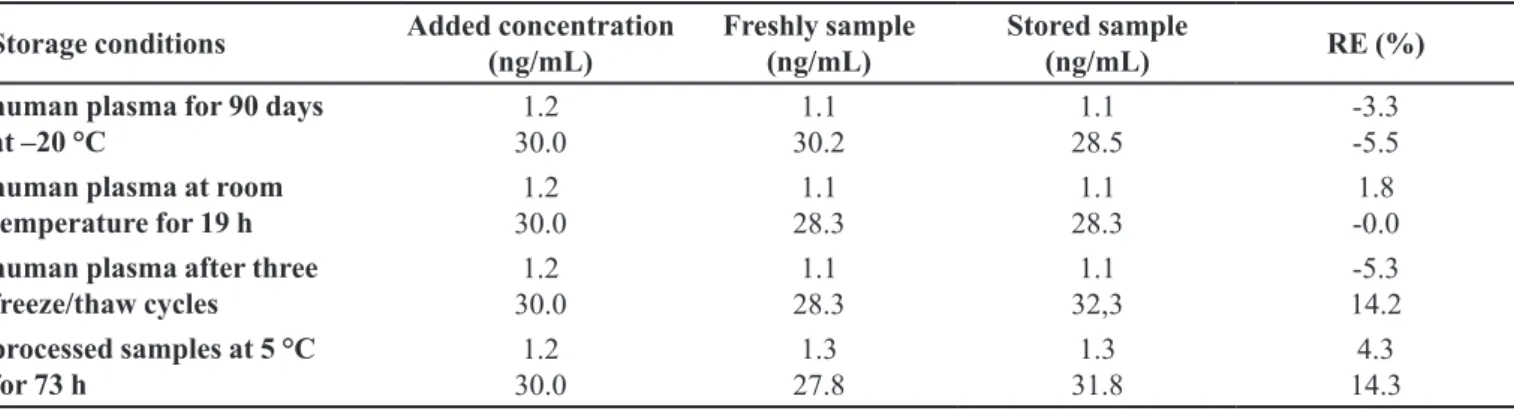
Stability
Stability results in Table III demonstrate that simvastatin is stable with deviation <15% under the indicated conditions for the pharmacokinetic study.
The stock solutions of simvastatin and lovastatin stored at 5 °C per 60 days and at room temperature/18 h were compared with fresh solutions and were considered stable at those conditions.
The stability of the analytes in human plasma, at storage conditions, were evaluated over a period equal to the typical sample preparations, sample handlings, and analytical run times.
Pharmacokinetic study
The validated UPLC-MS/MS method was
success-FIGURE 3 - Instrument response from constantly infused
analytes after injecting an extracted blank sample into the UPLC-MS/MS system (A); UPLC-MS/MS injection of both analytes in mobile phase solution, not concomitant, just for comparison (B).
TABLE I - Precision and accuracy for simvastatin in human plasma
Spiked concentration (ng/mL) 1.2 ng/mL 12.0 ng/mL 30.0 ng/mL
Mean concentration intraday (ng/mL) 1.2 1.3 1.1 13.0 12.5 11.6 31.3 30.1 28.0
Precision intraday (RSD%) 6.1 6.3 4.5 4.7 6.2 8.7 7.3 5.3 6.0
Mean accuracy intraday (%) 103.5 104.9 94.2 108.1 104.0 97.0 104.4 100.3 93.3
Mean concentration interday (ng/mL) 1.2 12.3 29.6
Precision interday (RSD%) 7.3 7.9 7.5
Mean accuracy interday (%) 100.6 102.7 98.7
RSD: relative standard deviation; Intraday assays: n = 7; Interday assays: n = 3
TABLE II - Extraction recovery of simvastatin and lovastatin
Spiked concentration Simvastatin 1.2 ng/mL
Simvastatin 12.0 ng/mL
Simvastatin 30.0 ng/mL
Lovastatin 0.15 µg/mL
RSD (%) 12.7 12.4 1.4 10.6
Recovery (%) 93.0 79.1 76.4 82.1
TABLE III - Stability of simvastatin in human plasma under various conditions (n = 5)
Storage conditions Added concentration (ng/mL)
Freshly sample (ng/mL)
Stored sample
(ng/mL) RE (%)
human plasma for 90 days at –20 °C
1.2 30.0
1.1 30.2
1.1 28.5
-3.3 -5.5 human plasma at room
temperature for 19 h
1.2 30.0
1.1 28.3
1.1 28.3
1.8 -0.0 human plasma after three
freeze/thaw cycles
1.2 30.0
1.1 28.3
1.1 32,3
-5.3 14.2 processed samples at 5 °C
for 73 h
1.2 30.0
1.3 27.8
1.3 31.8
4.3 14.3 RE: relative error (n = 5)
TABLE IV - Pharmacokinetic parameters for test and reference drugs in healthy subjects in bioequivalence study
Parameters Reference formulation (mean ± S.D.)
Test formulation (mean ± S.D.)
90% Conidence
interval (%)
Cmax (ng/mL) 9.0 ± 5.1 5.8 ± 3.7 55,9 – 72,7
AUC0-t (h.ng/mL) 35.5 ± 18.7 36.1 ± 19.5 88,8 – 112,6
AUC0-∞ (h.ng/mL) 50.4 ± 41.3 68.8 ± 79.3 106,4 – 150,2
tmax (h) 1.4 ± 1.2 2.3 ± 2.7
-t1/2 (h) 10.5 ± 12.6 18.0 ± 21.4
-Kel 0.1 ± 0.1 0.1 ± 0.1
-Cmax: peak concentration; AUC0-t: area under the plasma concentration time curve from zero to the last nonzero concentration time;
AUC0-∞: area under the curve from zero to ininity; tmax: time to peak concentration; t1/2: half-life; Kel: elimination rate constant;
S.D.: standard deviation
.0 1 0.
0.0 2.0 4.0 6.0 8.0 10.0 12.0 14.0 16.0 18.0 20.0 22.0 24.0 2 0.
3 0. 4 0. 5 0. 6 0. 7 0.
c
on
ce
n
tration
(ng/mL)
time (h)
TEST
REFERENCE
FIGURE 4 - Mean plasma concentration-time proile of healthy
volunteers, after single oral dose administration of reference and test products of simvastatin tablets.
fully applied to a bioequivalence study in healthy human volunteers who received 40-mg tablet of simvastatin reference and test formulations under fasting conditions.
The samples were processed based on the proposed quick and simple extraction procedure for the quantiication of simvastatin in human plasma. The method was sensitive enough to monitor the simvastatin plasma level concentration up to 24 h after oral dose.
The basic pharmacokinetics parameters (Cmax,
AUC0-t, AUC0-∞, tmax, and t1/2) obtained for test and
reference drugs in healthy subjects in this bioequivalence study were summarized in Table IV. The mean plasma concentration-time proile of healthy human volunteers, after single oral dose administration of reference and test products of 40 mg simvastatin tablets is shown in Figure 4.
After natural logarithmic transformation using general linear model procedure to evaluate the effects of sequence, period, and formulation, at signiicance level (α) of 0.05, no statistically signiicant effect of sequence was found, showing that the washout period was enough to not cause carryover effects. However, the period effect and formulation effect were statistically signiicant with
results of 0.0091 for Cmax (period effect); <0.0001 for Cmax,
and 0.0276 for AUC0-∞ (formulation effect). These results
can suggest that there was some variability between test and reference formulations.
between 40 mg test sample and the reference product in terms of rate and extent of absorption.
CONCLUSIONS
A quick, simple, selective, precise, and accurate UPLC-MS/MS method was developed and validated for the quantiication of simvastatin in human plasma. The main advantages of this method were as follows: simple and fast sample preparation (one-step extraction), excellent recovery, minor matrix effects, low chromatographic run time (only 3.5 min for each sample), and low detectability (LLOQ of 0.4 ng/mL). The method was shown to be adequate and reliable for application to pharmacokinetics and bioequivalence studies of simvastatin.
ACKNOWLEDGMENTS
The authors would like to acknowledge CEBIO (Centro de Pesquisa em Biotecnologia, Belo Horizonte, Brazil) for inancial support and CAPES (Coordenação de Aperfeiçoamento de Pessoal de Nível Superior, Brasília, Brazil) for granting research fellowships.
REFERENCES
AGÊNCIA Nacional de Vigilância Sanitária. Guia para validação de métodos analíticos e bioanalíticos. RE 899. ANVISA, 2003.
APOSTOLOU, C.; KOUSOULOS, C.; DOTSIKAS, Y.; SOUMELAS, G-S.; KOLOCOURI, F.; ZIAKA, A.; LOUKAS, Y.L. An improved and fully validated LC-MS/MS method for the simultaneous quantification of simvastatin and simvastatin acid in human plasma. J. Pharm. Biomed. Anal., v.46, n.4, p.771-779, 2008.
CARLUCCI, G.; MAZZEO, P.; BIORDI, L.; BOLOGNA, M. Simultaneous determination of simvastatin and its hydroxy acid form in human plasma by high-performance liquid chromatography with UV detection. J. Pharm. Biomed. Anal., v.10, n.9, p.693-697, 1992.
HOFFMAN, W.F.; ALBERTS, A.W.; ANDERSON, P.S.; CHEN, J.S.; SMITH, R.L.; WILLARD, A.K. 3-Hydroxy-3-methylglutaryl-coenzyme A reductase inhibitors. 4. Side-chain ester derivatives of mevinolin. J. Med. Chem., v.29, n.5, p.849-852, 1986.
KEBARLE, P.; TANG, L. From ions in solution to ions in the gas phase - the mechanism of electrospray mass spectrometry. Anal. Chem., v.65, n.22, p.972A-986A, 1993.
MAURO, V.F. Clinical pharmacokinetics and practical applications of simvastatin. Clin. Pharmacokinet., v.24, n.3, p.195-202, 1993.
NOVÁKOVÁ, L.; VLCKOVÁ, H.; SATÍNSKY, D.; SADÍLEK, P.; SOLICHOVÁ, D.; BLÁHA, M.; BLÁHA, V.; SOLICH, P. Ultra high performance liquid chromatography tandem mass spectrometric detection in clinical analysis of simvastatin and atorvastatin. J. Chromatogr. B Analyt. Technol. Biomed. Life Sci., v.877, n.22, p.2093-2103, 2009.
OCHIAI, H.; UCHIYAMA, N.; IMAGAKI, K.; HATA, S.; KAMEI, T. Determination of simvastatin and its active metabolite in human plasma by column-switching high-performance liquid chromatography with fluorescence detection after derivatization with 1-bromoacetylpyrene. J. Chromatogr. B Biomed. Sci. Appl., v.694, n.1, p.211-217, 1997.
TAKANO, T.; ABE, S.; HATA, S. A selected ion monitoring method for quantifying simvastatin and its acid form in human plasma, using the ferroceneboronate derivative. Biomed. Environ. Mass Spectrom., v.19, n.9, p.577-581, 1990.
FOOD and Drug Administration. Guidance for industry, bioanalytical method validation. Centre for drug evaluation and research (CDER). Rockville: FDA, 2001. 22 p.
VICKERS, S.; DUNCAN, C.A.; CHEN, I.W.; ROSEGAY, A.; DUGGAN, D.E. Metabolic disposition studies on simvastatin, a cholesterol-lowering prodrug. Drug Metab. Dispos., v.18, n.2, p.138-145, 1990.
Received for publication on 03rd July 2013