Rev Saúde Pública 2004;38(4) www.fsp.usp.br/rsp
Excess mortality by diarrhea simultaneous to
a cholera epidemic in Northeastern Brazil
M oacir Gerolomoa e M aria Lúcia Fernandes Pennab
aFundação Nacional de Saúde. Ministério da Saúde. Curitiba, PR, Brasil. bInstituto de Medicina
Social. Universidade do Estado do Rio de Janeiro. Rio de Janeiro, RJ, Brasil
Correspondence to:
Moacir Gerolomo Travessa João Turín, 72/208 80240-100 Curitiba, PR, Brasil E-mail: [email protected]
Keywords
Diarrhea, mortality. Cholera, mortality. Disease outbreaks, underregistration. Diseases registries.
Based on a doctoral thesis presented at the Instituto de Medicina Social, Universidade do Estado do Rio de Janeiro, 2002. Received on 19/5/2003. Reviewed on 17/12/2003. Approved on 5/2/2004.
Abstract
Objective
To evaluate excess mortality due to infectious diarrhea without etiological diagnosis, occurring simultaneously to Vibrio cholerae circulation.
Methods
Statistical modeling was applied to a time series of deaths ascribed to “poorly defined intestinal infections” (International Classification of Diseases – ICD-9) and “presumably infectious diarrhea and gastroenteritis” (ICD-10), between 1980 and 1998 in the Northeast Region of Brazil. The prediction of expected values was obtained after a discontinuity point. Excess mortality was calculated as the difference between observed figures and those estimated by the model.
Results
Between 1992 and 1994, only 19.3% of deaths by cholera were actually notified. In 1993, the year in which the epidemic reached its peak in the area, our modeling estimated underregistration at 82.2%.
Conclusions
Results indicate substantial underregistration of cholera mortality during the epidemic in Northeastern Brazil.
INTRODUCTION
Current evaluations of the health and living condi-tions of the Brazilian population suggest an extremely concerning scenario, related to the superposition of distinct patterns of morbidity and mortality, in which the advance of the so called ‘modern’ patterns – chronic degenerative diseases and violence, among others – is combined with the persistence of patterns associated with underdevelopment, such as infectious and para-sitic diseases.9
In a short period, there has been a significant reduc-tion in the participareduc-tion of infectious and parasitic eases in Brazilian mortality statistics. This type of dis-ease fell from second place in the ranking of the most important causes of death in 1977 to fifth place in
1984, and mortality levels decreased from 9.3% of all deaths in 1980 to 7.6% in 1984.11 In 1996, 1997, and 1998, infectious and parasitic diseases were the sixth most important cause of death in Brazil, accounting for 5.8%, 5.3%, and 5.2% of all deaths countrywide, respectively. One of the factors contributing to such a reduction was the increasing accessibility of certain essential goods and services, which, however, were still unequally distributed, being concentrated in more de-veloped regions.
Rev Saúde Pública 2004;38(4) www.fsp.usp.br/rsp
continuity its structure. To this end, we employed a local stationary autoregressive model and the Akaike information criteria (AIC) minimum value. Once the discontinuity point was estimated, data from the pre-vious time series were modeled through decomposi-tion into three components: local polynomial trend, global stationary autoregression, and random error. The AIC minimum value was used for selecting the best model.7 Model parameters were estimated using Kyplot software. The adjusted model was used for predicting expected values after the point of discontinuity. Ex-cess mortality was calculated as the difference between the observed figures and those estimated by the model.
RESU LTS
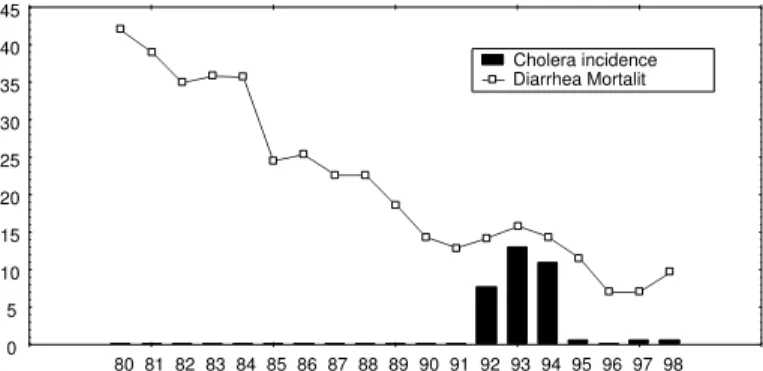
The time series of deaths by infectious diarrhea with-out etiological diagnosis in the Northeast Region of Brazil between 1980 and 1993 (Figure 1), shows that the number of deaths declined continuously until 1992 – the first year of the cholera epidemic in the region – when this trend was reversed. From then on the varia-tion in the number of such deaths follows the inci-dence of cholera.
The point of discontinuity in the behavior of the time series identified by the model was 1991, as shown in Table 1. The work of Kitagawa & Gersch7 may be referred to for a better understanding of the modeling techniques employed.
The model selected for adjusting the data from the 1980-1990 period is presented in Table 2. These re-sults are presented again in Figure 2, which also in-cludes expected and observed mortality for the period starting in 1992.
A Table 3 shows observed and estimated mortality, the upper and lower limits of the confidence interval, and estimated, observed in the 1992-1995 period and in 1998, minimal, and maximal excess mortality, the
Figure 1 - Mortality rate by intestinal infectious diseases, per 100,000 population and cholera incidence per 10,000 population. N ortheast Region, Brazil, 1980-1998.
0 5 10 15 20 25 30 35 40 45
80 81 82 83 84 85 86 87 88 89 90 91 92 93 94 95 96 97 98 Cholera incidence Diarrhea Mortalit
higher, since in this region there is still a high propor-tion of deaths attributed to poorly defined causes – 22% of all deaths in 1998. This may be masking the actual percentage of deaths by infectious and parasitic diseases, since poorly defined causes are found pre-dominantly among individuals from poorer social groups, to whom medical care is not always available during the entire process of illness and death.13 Ac-cording to Werneck & Reichenheim,16 diseases with greater impact on infant mortality are usually underes-timated when only the proportion of deaths is analyzed. This is demonstrated by studies on the loss of poten-tial years of life.
Clinically, cholera is an acute diarrheic disease, which can lead to the loss of several liters of water and electrolytes in a period of a few hours, which may cul-minate in a clinical scenario of hypovolemic shock and death, in case these losses are not readily restored.5 In Brazil, 1,918 cases of cholera were reported to the Ministry of Health’s National Sanitary Surveillance System (SNVE) between 1991 and 1998. In the same period, the Mortality Information System (SIM), run by the Department of Informatics of the Brazilian Uni-fied Healthcare System (DATASUS), registered 1,295 deaths (66,8%), which leads us to the assumption that there has been substantial underreporting of cholera deaths in the country.
An evaluation of the impact of V. cholerae circulation on mortality may be carried out indirectly through sta-tistical modeling. This can be done by estimating the number of excess deaths during the epidemic period, calculated as the difference between the number of deaths observed and the number of deaths expected in a non-epidemic scenario. This approach has been successful in studying the impact of the Influenza virus and the deleterious effects of atmospheric pollution.6,12
The present study is aimed at evaluating excess mortality due to infectious diarrhea without etiological diagnosis in the Northeast Region of Brazil,
during the period of circulation of V. cholerae in this region.
METHODS
dis-!
Rev Saúde Pública 2004;38(4) www.fsp.usp.br/rsp
latter two of which were based on the limits of the confidence interval and on the number of cholera deaths registered by SIM.
DISCUSSION
The choice of statistical method was due to the greater appropriateness of this model for use in time series with important trends, in comparison with the Arima method proposed by Box & Jenkins,2 which is more appropri-ate for stationary series. Another advantage of the present method is the semi-automatic char-acter of the choice between the different pos-sible models based on the minimum AIC. This
is strengthened by the model’s good prediction of the last years of the time series, despite it being a seven-year prediction based on an eleven-seven-year period. The appropriateness of this model, even when dealing with short series, is one of its advantages.7
Our results indicate substantial underregistration of cholera mortality during the epidemic in the North-east Region. Assuming that the excess mortality
be-tween 1992 and 1994 was indeed caused by cholera, this would mean that only 19.3% of cholera cases in the period were actually reported. For 1993, the year in which the epidemic reached its peak in the Northeast, the present modeling estimated underregistration at 82.2% (69.4-86.8%).
Mortality attributable to influenza, heat, and atmos-pheric pollution is traditionally calculated by statisti-cal models based on the estimation of excess mortal-ity.14,15 As in the present case, there is no definitive proof in these studies that such deaths were indeed due to influenza, or to the other events mentioned. Nevertheless, the biological logic which supports these studies, along with the disappearance of excess mor-tality upon termination of the event at hand, support the hypotheses proposed.
The number and percentage of deaths ascribed to poorly defined causes decreased throughout the en-tire study period, form 48.6% in 1980 and 42.1% in 1990 to 34.4% in 1995 and finally to 28.8% in 1998.
It is estimated that roughly 20% of all deaths in Brazil are not registered, and that this proportion exceeds 50% in certain areas of the Northeast Region. This region also shows the highest levels of deaths attributed to poorly defined causes.10 Considering that the present study was based on registered deaths with well defined
Figure 2 - ARMA model (2,2,0) for deaths by diarrhea. Estimated based on data from 1980 to 1991. Prediction for 1992 to 1998.
0 4000 8000 12000 16000 20000
80 81 82 83 84 85 86 87 88 89 90 91 92 93 94 95 96 97 98 99 Expected Lower limit Upper limit Observed
Table 2 - Model selected for data adjustment from 1980 to 1990.
Number of interactions 26
Log (L) 6.595886
AIC 2.808227
O bserved noise 2.20E-07
Trend component
O rder 2
O bserved noise 4.12E-08
Autoregressive component
O rder 2
Observed noise 0.015941
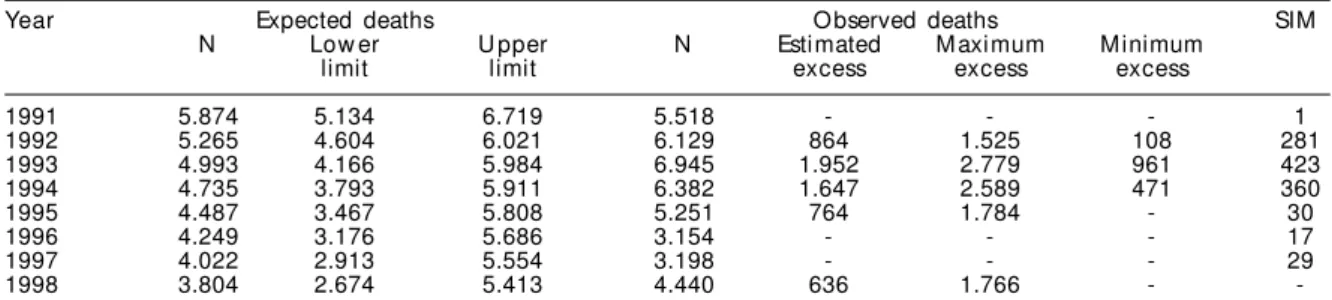
Table 3 - Deaths by diarrhea, without specification, observed and expected, with upper and lower confidence interval limits (95%), and deaths by cholera registered in the Mortality Information System. Northeast Region, Brazil, 1991-1998.
SIM: Mortality Information System, Ministry of Health
Year Expected deaths O bserved deaths SIM
N Low er U pper N Estimated M aximum M inimum
limit limit excess excess excess
1991 5.874 5.134 6.719 5.518 - - - 1
1992 5.265 4.604 6.021 6.129 864 1.525 108 281
1993 4.993 4.166 5.984 6.945 1.952 2.779 961 423
1994 4.735 3.793 5.911 6.382 1.647 2.589 471 360
1995 4.487 3.467 5.808 5.251 764 1.784 - 30
1996 4.249 3.176 5.686 3.154 - - - 17
1997 4.022 2.913 5.554 3.198 - - - 29
1998 3.804 2.674 5.413 4.440 636 1.766 -
-Table 1 - Estimation of the point of discontinuity of the statistical structure of the series.
Year AIC
1989 248.4012
1990 247.9795
1991 244.7536
1992 244.8000
1993 246.2553
1994 246.3117
" Rev Saúde Pública 2004;38(4) www.fsp.usp.br/rsp
underlying causes, the numbers here presented, although quite high, probably still do not reflect the actual ex-cess mortality brought about by cholera in this region.
Until 1991, the Ministry of Health lacked a structure responsible for developing activities related to the epi-demiological surveillance of diarrhea. As states and municipalities tend to reproduce the model developed at the Federal level, there were, apart from rare excep-tions, no activities in Brazil aimed at studying and un-derstanding diarrheas, despite the awareness of the im-pact of these diseases on the population. With the emer-gence of cholera, such a structure was implemented as an emergency measure; however, due to operational is-sues, this structure still works precariously and with ex-treme difficulty in detecting and reporting cases of chol-era, especially those from remote regions. With respect to assistance, despite the large investments made in the management of diarrheas and dehydration, a study con-ducted in nine Brazilian capitals showed that a large proportion of the care provided is inadequate.3
According to World Health Organization (WHO) rec-ommendations, all suspect cases reported were con-firmed based on laboratory (positive stool test for V. cholerae) or clinical-epidemiological criteria (with or without negative stool tests, but with clinical aspects and epidemiological antecedents compatible with the disease). These criteria are described in detail else-where.8 Due to a political decision, in 1991 and early 1992, the National Committee for the Prevention and Control of Cholera (CNPC) – responsible, at the time, for all activities related to controlling the epidemic in the country – only counted cases which had been con-firmed by laboratory exams (namely, positive stool culture for V. cholerae), even in areas in which the cir-culation of this agent had already been established. In
the subsequent period, in spite of changes in orienta-tion promoted by the Ministry of Health, still very few cases were confirmed based on the clinical-epidemio-logical criterion, in all Brazilian states. The states in the Northeast Region, with the exception of Pernambuco and Bahia, confirmed more than 50% of their cholera cases by laboratory testing. This propor-tion was as high as 85%, or even higher, in the states of Maranhão, Paraíba, Piauí, and Sergipe.4
The inconvenience of chemoprophylaxis for con-tacts of cholera patients is widely described in the in-ternational literature. In addition to its failure to re-strict the dissemination of the disease in the popula-tion, chemoprophylaxis may easily lead to the emer-gence of strains resistant to the antibiotics used, ren-dering inefficient a weapon designed to be used in severe cases, mainly for reducing disease lethality. Its widespread use in Brazil has also led to the failure to diagnose a large number of cases, since the use of anti-biotics before the collection of rectal swab samples leads to negative test results.
Mortality statistics are an important element in di-agnosis and healthcare policy making, and the death certificate is the main source of data for these statis-tics.1 Using SIM data for planning measures in the field of epidemiological surveillance is a limited approach, mainly because of the two to three-year lag between death notification and the availability of data at fed-eral level. This does not prevent the use of this infor-mation at municipal level, in real time, as an important monitoring instrument for the early identification of alterations in the health conditions of the population. In the specific case of cholera, an increase in the number of deaths due to diarrhea is an important alert for the early detection of outbreaks of the disease.
REFERÊN CIAS
1. Andrade AEO, Barreto ML, Souza MCM. Fatores que contribuem para o sub-registro de óbitos em Itaparica, Bahia, Brasil. IESUS 1993;2:40-56.
2. Box GEP, Jenkins GM. Time series analyses,
Forecasting and control. San Francisco: Holden-Day; 1970.
3. Costa Rivero H, Drasbek CJ. Tratamiento de la diarrea en prescolares: encuesta en nueve capitales de estados del nordeste del Brazil. Bol Oficina Sanit Panam 1996;120:291-303.
4. Gerolomo M, Penna MLF. Os primeiros cinco anos da sétima pandemia de cólera no Brasil. IESUS
1999;8:49-58.
5. Glass RI, Claeson M, Blake PA, Waldman R, Pierce NF. Cholera in Africa: lessons on transmission and control for Latin America” . Lancet 1991;338:791-5.
6. Kelsall JE, Samet JM, Zeger SL, Xu J. Air polluition and mortality in Philadelphia, 1974-1998. Am J Epidemiol 1997;146:750-62.
7. Kitagawa G, Gersch W. A smoothness priors-state space modeling of time series with trend and seasonality. J Am Stat Assoc 1984;79:378-89.
#
Rev Saúde Pública 2004;38(4) www.fsp.usp.br/rsp
9 Monteiro CA, Iunes RF, Torres AM. A evolução do país e de suas doenças. IESUS 1996;5:7-14.
10. Organização Pan-Americana da Saúde. A Saúde no Brasil. Brasília (DF); 1998.
11. Possas CA. Padrões epidemiológicos e política de saúde no Brasil [tese de doutorado]. Rio de Janeiro: Escola Nacional de Saúde Pública; 1988.
12. Simonsen L, Clarke MJ, Williamson GD, Stroup DF, Arden NH, Schonberger LB. The impact of influenza epidemics on mortality: introducing a severity index. Am J Public Health 1997;87:1944-50.
13. Simões CCS. Perfis de saúde e de mortalidade no Brasil: uma análise de seus condicionantes em grupos populacionais específicos. Brasília (DF): Organização Pan-Americana de Saúde; 2002.
14. Takahashi M, Tango T. A proposol for a new definition of excess mortality associated with influenza-epidemics and its estimation. Nippon Koshu Eisei Zasshi 2001;48:402-8.
15. Takahashi M, Tango T. Estimation of excess mortality associated with influenza-epidemics by age and cause specific death in Japan, 1975-1999. Nippon Eiseigaku Zasshi 2002;57:571-84.