www.jped.com.br
ORIGINAL
ARTICLE
Temporal
and
spatial
evolution
of
maternal
and
neonatal
mortality
rates
in
Brazil,
1997---2012
夽
Nádia
Cristina
Pinheiro
Rodrigues
a,b,∗,
Denise
Leite
Maia
Monteiro
b,
Andréa
Sobral
de
Almeida
a,
Mônica
Barros
de
Lima
Barros
a,
André
Pereira
Neto
a,
Gisele
O’Dwyer
a,
Mônica
Kramer
de
Noronha
Andrade
a,c,
Matthew
Brian
Flynn
d,
Valéria
Teresa
Saraiva
Lino
aaFundac¸ãoOswaldoCruz(Fiocruz),EscolaNacionaldeSaúdePúblicaSergioArouca(ENSP),RiodeJaneiro,RJ,Brazil bUniversidadedoEstadodoRiodeJaneiro(UERJ),FaculdadedeCiênciasMédicas,RiodeJaneiro,RJ,Brazil
cInstitutoVitalBrazil,CentrodeEstudoePesquisadoEnvelhecimento,Niterói,RJ,Brazil dGeorgiaSouthernUniversity,DepartmentofSociology&Anthropology,Statesboro,UnitedStates
Received30July2015;accepted23March2016 Availableonline25May2016
KEYWORDS Maternalmortality; Infantmortality; Trends;
Maternalhealth; Ecologicalstudies; Mortality
Abstract
Objective: Maternalandneonatalmortalityareimportantpublichealthissuesinlow-income
countries.Thisstudyevaluatedspatialandtemporalmaternalandneonatalmortalitytrends inBrazilbetween1997and2012.
Methods: Thisstudyemployedspatialanalysistechniquesusingdeathrecordsfromthe
mor-talityinformationsystem.Maternalmortalityratesper100,000andneonatalmortalityrates (earlyandlate)per1000livebirthswerecalculatedbystate,region,andperiod(1997---2000, 2001---2004,2005---2008,and2009---2012).Multivariatenegativebinomialmodelswereusedto explaintheriskofdeath.
Results: The mean Brazilian maternal mortality rate was 55.63/100,000 for the entire
1997---2012 period. The rate fell 10% from 1997---2000 (58.92/100,000) to 2001---2004 (52.77/100,000),but later increased11%during 2009---2012(58.69/100,000).Early andlate neonatalmortalityratesfell33%(to7.36/1000)and21%(to2.29/1000),respectively,during the 1997---2012period. EveryBrazilian regionwitnessed adrop inneonatalmortalityrates. However,maternalmortalityincreasedintheNortheast,North,andSoutheastregions.
Conclusion: Brazil’sneonatalmortalityratehasimprovedinrecenttimes,butmaternal
mor-talityrateshavestagnated,failingtomeettheMillenniumDevelopmentGoals.Publicpolicies andintersectoraleffortsmaycontributetoimprovementsinthesehealthindicators.
©2016SociedadeBrasileiradePediatria.PublishedbyElsevierEditoraLtda.Thisisanopen accessarticleundertheCCBY-NC-NDlicense(http://creativecommons.org/licenses/by-nc-nd/ 4.0/).
夽 Pleasecitethisarticleas:RodriguesNC,MonteiroDL,AlmeidaAS,BarrosMB,PereiraNetoA,O’DwyerG,etal.Temporalandspatial
evolutionofmaternalandneonatalmortalityratesinBrazil,1997---2012.JPediatr(RioJ).2016;92:567---73.
∗Correspondingauthor.
E-mail:[email protected](N.C.P.Rodrigues). http://dx.doi.org/10.1016/j.jped.2016.03.004
PALAVRAS-CHAVE Mortalidadematerna; Mortalidadeinfantil; Tendências;
Saúdematernal; Estudosecológicos; Mortalidade
Evoluc¸ãotemporaleespacialdastaxasdemortalidadematernaeneonatalnoBrasil, 1997---2012
Resumo
Objetivo: Amortalidadematernaeneonataléumimportanteproblemadesaúdepúblicaem
paísesdebaixarenda.Esteestudoavaliouastendênciasdemortalidadematernaeneonatal espacialetemporalnoBrasilentre1997e2012.
Métodos: Esteestudoutilizoutécnicasdeanáliseespacialutilizandoregistrosdeóbitodo
Sis-temadeInformac¸õessobreMortalidade.Astaxasdemortalidadematernaacada100.000e astaxasdemortalidadeneonatal(precoceetardia)acada1.000nascidosvivosforam calcu-ladasporestado,regiãoeperíodo(1997-2000,2001-2004,2005-2008e2009-2012).Osmodelos binomiaisnegativosmultivariadosforamutilizadosparaexplicaroriscodemorte.
Resultados: A taxa demortalidade maternanoBrasil foi 55,63/100.000em todoo período
entre1997e2012.Ataxacaiu10%de1997-2000(58,92/100.000)a2001-2004(52,77/100.000), porém,mais tarde,aumentou 11%até2009-2012(58,69/100.000).Astaxasde mortalidade neonatal precoce e tardia caíram 33% (para 7,36/1.000) e 21% (para 2.29/1.000), respec-tivamente,duranteoperíodo de1997-2012.Toda regiãobrasileira testemunhouumaqueda nastaxas demortalidade neonatal.Contudo, amortalidade maternaaumentounasregiões Nordeste,NorteeSudeste.
Conclusão: AtaxademortalidadeneonataldoBrasilmelhorounosúltimosanos,porémastaxas
demortalidadematernaestagnaram,deixandodeatingirosObjetivosdeDesenvolvimentodo Milênio.Aspolíticaspúblicaseosesforc¸osintersetoriaispoderãocontribuirparaasmelhorias nessesindicadoresdesaúde.
©2016SociedadeBrasileiradePediatria.PublicadoporElsevierEditoraLtda.Este ´eumartigo OpenAccesssobumalicenc¸aCCBY-NC-ND(http://creativecommons.org/licenses/by-nc-nd/4. 0/).
Introduction
Maternalandneonatalmortalityareimportanthealthissues in low-income countries: 99% of the worldwide maternal deaths occur in developing countries,1 and 44% of global
neonataldeathsoccurin onlyfivecountries oftheworld:
India(27.8%),Nigeria(7.2%),Pakistan(6.9%),China(6.4%),
and the Democratic Republic of Congo (4.6%).2 Factors
like poor access to education, low income, poor
obstet-ricsassistance,andhighpregnancyratescontributetothe
persistenceofthesehighindicatorsofmortality.3
Whilethematernalmortalityrateindevelopedcountries
wasabout16/100,000in2010,indevelopingcountriesitwas
about240/100,000(fifteentimeshigher)forthesameyear.
InBrazil,previousstudiesshowedthatthematernal
mortal-ityratein2000was54.3/100,000livebirths(73.2/100,000
intheNorthregionand42/100,000intheSouthregion),4,5
butin2009itroseto65.1/100,000.6
The worldwidepercentage of neonatal deaths in 2009
(regardingallunder-fivechilddeaths)was41%,which
cor-respondsto3.3million ofdeathsinchildrenyoungerthan
28days.Between 1990and 2009,global neonatal
mortal-ity rates fell 28%, or from 33.2/1000 to 23.9/1000 over
the period. In Brazil, the neonatal mortality rate was
11.1/1000in2011---2012,and38.3%and30.5%ofthethese
deaths occurred in the Northeast and Southeast regions,
respectively.7
Brazil is the largest country of SouthAmerica andhas
several regional socioeconomic differences. The Human
Development Index in the Southeast, South,and Midwest
regionsofthecountryvariesaround0.75---0.76,whileinthe
NorthandNortheast,itrangesfrom0.66to0.67.8These
con-trastsmakemortalityindicatorsquiteheterogeneousacross
thecountry.
Worldleadershave set goals toreduce mortalityrates
both for children and for pregnant women (Millennium
Development Goal 4and MillenniumDevelopment Goal 5,
respectively). Forchild mortality, the goal wastoreduce
1990benchmarkratestoone-thirdoftheirvaluesby2015.2
As the neonatal periodis the most vulnerablephase of a
child’slifeandtheneonatalcomponentofinfantmortalityis
themostdifficulttoreduce,decreasedneonataldeathshave
playedanimportantpartinreachingthisgoal.3,9However,
eventhoughthe overallrates showareasonable situation
regardingthisindicator,itisnecessarytoconsiderthe
het-erogeneity ofthe ratesacross thecountry.The Northand
Northeast regions witness rates almost 100% higher than
thoseintheSouthandSoutheast.7
For maternal mortality, the goal was to reduce rates
by 75% between 1990 and 2015.3,9 The Brazilian Ministry
of Health estimated that the maternal mortality rate in
1990was141/100,000.10 Thus,Brazil’sgoalwastoreduce
maternal deathsto 36 per 100,000 by 2015. In 2001, the
maternal rate haddecreased 44%, reaching80/100,00010;
however, after that, the rate of decline slowed,11
reach-ing only 70/100,000 in 2011.10 In light of this situation,
the reduction of maternal mortality in Brazil remains an
importantpublichealthissueandacontinuingchallengefor
obstetriccare.
Maternalandneonatalindicatorsreflectboththesocial
contrastsandthepoorcapacityofBrazilianhealthsystemto
Brazil’sdifficultiesinmeeting itsMillenniumDevelopment
Goals,6,12 despite some improvement in these indicators,
thisstudyevaluatedspatialandtemporaltrendsin
mater-nal andneonatal mortalityfrom1997 to2012 in orderto
helphealth managers implementactionsand resourcesto
improvethissituation.
Methods
Thisisanecologicalstudyusingspatialanalysistechniques. Thespatialanalysisunitusedtopreparethematicmapswas thestate.
Data about maternal and neonatal deaths were col-lected fromtheMortality Information System (Sistemade Informac¸õessobreMortalidade[SIM]).Thisstudyconsidered maternal deaths as those classified in the tenth revision of the International Classification of Disease (ICD-10): (1) pregnancy, childbirth, and puerperium (codes O00-O99) excluding deaths outside of puerperium’s period of 42 days (codes O96 and O97); (2) human immunodeficiency virus (HIV) disease (B20-B24), hydatidiform mole, inva-siveormalignant(D39.2),orhypopituitarism(E23.0),since it occurs in pregnant women or during the puerperium period(from 1997 to 1999, it wasonly considered in the deaths of pregnant women); (3) puerperal osteomalacia (M83.0),obstetricaltetanus(A34),ormentalandbehavioral disorders associated with the puerperium, not elsewhere classified(F53),fordeathsoccurringupto42daysafterbirth orindeathswithoutinformationofthetimebetweenbirth anddeath.12
Earlyneonataldeathswereconsideredasthoseoccurring
inlivebirthsaged0---6daysandlateneonataldeathswere
classifiedasthoseinlivebirthsaged7---27days.
Maternal mortality rates per 100,000 live births were
calculated, as well as early and late neonatal mortality
rates per 1000 live birthsby area(state and region) and
by four-year period (1997---2000, 2001---2004, 2005---2008,
and2009---2012).In thenumeratorof therates,thisstudy
usedmaternal,earlyneonatal,andlateneonataldeathsto
constructmaternal,early-neonatal,andlate-neonatal
mor-talityindexes, respectively.The numberof livebirthswas
usedinthedenominatorforallrates.13
Statisticalmethods
Spatial analysis techniques were applied to prepare the-maticmapsandthegeoreferencedmeshofBrazilianstates was used(shapefile file), available at the website of the BrazilianInstituteofGeographyandStatistics.
AlthoughPoissonregressionisthemostcommonstrategy for modelingcountdata,this techniquedoes notproduce reliableestimatesformodelspresentingoverdispersion.14In
thisstudy,thePoissonmodelshowedsignificantdispersion,
soit wasnot usedin theanalysis.To avoid this problem,
multivariatebinomialnegativemodelswereusedtoexplain
the riskof maternal deaths andneonatal (earlyand late)
deaths. Response variables of the threemodels were the
countsofmaternaldeaths,earlyneonataldeaths,andlate
neonataldeaths.Theindependentvariablesincludedinboth
modelswere:period(four-year),prenatalcare(averageof
thenumberofprenatalvisits),placeofbirth(homebirthor
hospitalbirth),andthe residencearea(North,Northeast,
South,Southeast,andMidwest).Thenumberoflivebirths
wasincludedinthemodelsasanoffsetvariable.
Specificationsofthemodels:
Y∼BN(,)
log(deaths)=˛+ˇ1∗area+ˇ2∗period+ˇ3∗prenatal
+ˇ3∗homebirth+log(livebirths)
where is the average number of expected deaths, ˛
is the model intercept, and ˇ corresponds to regression
coefficients. Period and area were included as dummy
variables;thefollowing were usedasreferencecategory:
1997---2000periodandMidwestarea.Inbothmodels,a
loga-rithmiclinkfunction(logarithmofthelivebirths)wasadded
asanoffsetvariable.
Tables,graphicalmodels,andmapswereusedtopresent
the results. All analyses were performed with TerraView
(TerraView4.1.0.SãoJosédosCampos,SP:INPE,2010)and
R-Projectsoftwareversion3.1.3(RCoreTeam.R:Alanguage
andenvironmentforstatisticalcomputing.RFoundationfor
StatisticalComputing,Vienna,Austria,2014).12
ThisstudyfollowstheethicalprinciplesofBrazilian
leg-islation(EthicsCommitteedocumentNo.02/2016 ---Ethics
Committee of Escola Nacional de Saúde Pública Sérgio
Arouca).
Results
The average Brazilian maternal mortality rate during the 1997---2012periodwas55.63/100,000,reachingaminimum of52.77andamaximumof58.92/100,000.Therateshowed apreliminarydecreaseof10%inthe2001---2004period com-pared to 1997---2000. After that, the rate increased 11%, reaching58.69/100,000in2009---2012.Theresultsbyregion show increasing mortality rates in the period 2009---2012 comparedto1997---2000,exceptfortheSoutheastandSouth regions(Table1).
Early neonatalmortality rates declined 33% from1997
to2012,fallingfrom10.89/1000(1997---2000)to7.36/1000
(2008---2012).Overall,earlyneonatalmortalityratesfellin
everyBrazilianregion.IntheSoutheast,thelargestdecrease
wasdetected(42%),andintheNortheast,thesmallest(23%;
Table1).
Late neonatal mortality rates decreased 21%, from
2.92/1000to2.29/1000between 1997and2012,withthe
Southeastshowingthehighestdecreaseof26%(Table1).
InFig.1,itcanbeseenthatin someNorthand
North-eaststates,likeAmazonasandBahia,therewasasignificant
increaseinmaternal mortalityrates duringthisperiod.In
contrast,inthe Southeast,therewasadecreaseinstates
likeMinasGeraisandSãoPaulo.
Regardingearlyneonatalmortalityrates,thestateswith
thehighest ratesinthefirststudyperiodexperienced
sig-nificantdeclinesduringtheperiodunderstudy(e.g.Minas
Gerais,in the Southeast;Mato Grosso doSul, in the
Mid-west; and Amazonas, Acre, and Rondônia, in the North).
The state of Bahia, in the Northeast,showed the highest
earlyneonatalmortalityrateattheendofthestudyperiod
Table1 MaternalandneonatalmortalitytrendsbyBrazilianregion,1997---2012. Maternalmortality
ratio/100,000livebirths
Neonatalmortalityrate (0---6days)/1000livebirths
Neonatalmortalityrate (7---28days)/1000livebirths
1997---2000
2001---2004
2005---2008
2009---2012
1997---2000
2001---2004
2005---2008
2009---2012
1997---2000
2001---2004
2005---2008
2009---2012
North 58.86 53.24 59.95 63.88 12.66 11.06 9.69 8.87 3.17 2.94 2.57 2.48 Northeast 56.27 61.36 65.93 69.63 11.50 11.51 10.14 8.85 2.98 2.87 2.53 2.27 Southeast 59.59 44.24 45.5 52.22 11.09 8.53 7.16 6.38 3.06 2.80 2.54 2.28 South 65.79 55.17 54.78 49.86 8.69 7.80 6.73 5.85 2.32 2.52 2.29 2.12 Midwest 51.06 57.46 55.45 57.83 9.79 8.95 7.66 7.14 2.78 2.93 2.59 2.44 Total 58.92 52.77 55.19 58.69 10.89 9.62 8.32 7.36 2.92 2.81 2.51 2.29
Regardinglateneonatalmortalityrates,RiodeJaneiro (Southeast),CearáandPernambuco(Northeast),Amazonas (North),and Mato Grosso do Sul (Midwest) were some of states that showed the highest rates in the first periods. Amapá,intheNorth,hadthehighestratesinallthestudy periods(over12/1000)(Fig.1).
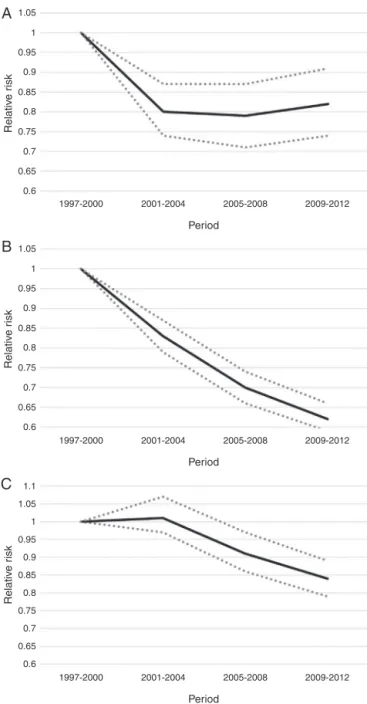
The findings in Table 2 and Fig. 2 reveal a significant
reduction of 20% in maternal mortality from 1997---2000
to2001---2004(adjustedbyregion,homebirthandprenatal
care). Afterthis time,maternal mortalityrates remained
nearly steady. A 31% increase in maternal mortality risk
wasfoundintheNortheastcomparedtotheMidwestregion
(resultsadjustedbyperiod,homebirth,andprenatalcare)
(Table2).
Regardingearlyneonatalmortalityrates, theresultsof
Table2andFig.2showedadecreaseinearlyneonatal
mor-talityriskinallperiods(adjustedbyregion,homebirth,and
prenatal care). This reduction was 17%, 30%, and 38% in
1997-2000 2001-2004 2005-2008 2008-2012
Rate/100 000 0~50 50~60 60~70 70~80 ≥80
Rate/1000 0~8 8~9 9~10 10~11 11~12 ≥12
Rate/1000 0~8 8~9 9~10 10~11 11~12 ≥12
N
S E W 3 000 000
2 000 000
Meters
Late neonatal mor
tality r
ate
Ear
ly neonatal mor
tality r
ate
Mater
nal mor
tality r
ate
1 000 000 0
Table2 Factorsassociatedwithmaternal,early,andlateneonatalmortalityinBrazil.
Maternalmortalityrate Earlyneonatalmortalityrate Lateneonatalmortalityrate
RR p-v RR p-v RR p-v
Period
1997-2000a 1.00 1.00 1.00
2001---2004 0.80 0.0001 0.83 0.0001 1.01 0.56
2005---2008 0.79 0.0001 0.70 0.0001 0.91 0.002
2009---2012 0.82 0.0002 0.62 0.0001 0.84 0.0001
Area
Midwesta 1.00 1.00 1.00
North 1.25 0.13 1.45 0.0001 1.10 0.27
Northeast 1.31 0.0002 1.38 0.0001 0.99 0.86
South 0.88 0.001 0.96 0.07 1.00 0.94
Southeast 1.00 0.98 0.86 0.0001 0.86 0.0001
RR,adjustedrelativerisk(binomialnegativeregressionmodels);p-v,p-value.
Thefactorsincludedinthemodelswere:period,region,prenatalcare,andhomebirth.Thenumberoflivebirthswasincludedinthe
modelsasanoffset.
a Referencecategory.
2001---2004,2005---2008,and2009---2012,respectively, com-paredtothe1997---2000referenceperiod.
EarlyneonatalmortalityriskintheNorthandNortheast regions was45% and38% higherthan theMidwest region, respectively(adjusted byperiod,homebirth,andprenatal care)(Table2).
Table2andFig.2alsorevealadecreaseinlate
neona-talmortalityriskin2005---2008and2009---2012ascompared
to 1997---2000 (adjusted by region, homebirth, and
pre-natal care). This reduction was 9% and 16%, respectively
in 2005---2008 and 2009---2012, compared to 1997---2000
(adjusted by region, homebirth, andprenatal care). Both
earlyandlateneonatalmortalityriskswere14%lowerinthe
SoutheastthanintheMidwestregion(adjustedbyperiod,
homebirth,andprenatalcare)(Table2).
Discussion
From 1997 to 2012, the average maternal mortality rate inBrazil was56/100,000.Stratifying thisdatain termsof periodandplacehelpstoclarifysomeinconsistenciesin pre-viousfindings.From1990to2010,Brazil’sMinistryofHealth reporteda decreaseof 62% (ranging from141/100,000 to 54/100,000).10 Ferraz andBordignon, however, sawa20%
jumpinBrazilianmaternalmortalityratesfrom54/100,000
in 2000 to 65/100,000 in 2009.6 In contrast, the present
study detected a 20% decrease inmaternal mortalityrisk
fromthe1997---2000periodtothe2001---2004period.After
this time, maternal mortality risk remained roughly
con-stant.
This study confirms previous findings showing regional
discrepanciesinmaternalmortalityrisk.In2009---2012,the
SouthandSoutheastshowedthelowestmaternalmortality
rates, while the North and Northeast showed the
high-est.PreviousstudieshavehighlightedthattheNorthregion
has the highest maternal mortality rates of the country,
while the Southretains thelowest.4,5,15 In the Northeast,
this study shows that maternal mortality rates increased
throughout the period, while in the South, the opposite
happened.
Thegreater availabilityof publichealthservicesinthe
SouthandSoutheastcomparedtotheNorthandNortheast
mayexplainregionaldifferences.In1999,therewere5709
healthservicesinBrazilprovidingchildbirthcare(73%ofall
Brazilianhospitals); however,only5% ofthese health
ser-vicesspecializedinobstetrics.Inthesameyear,theNorth,
Northeast, Southeast, South, and Midwest had 65%, 53%,
78%,71%,and91%oftheBrazilianhealthservicesproviding
obstetricscare,respectively.16,17
Brazil’sneonatalmortalityratesfell bymorethan half
from1990 to2012(from22.05/1000 to9.33/1000).12 The
presentstudydisaggregatesearlyvs.lateneonatal
mortal-ity rates. The findings show that average early neonatal
mortality rates decreased from 10.89/1000 (1997---2000)
to 7.86/1000 (2009---2012), while late neonatal
mortal-ity decreased from 2.92/1000 (1997---2000) to 2.29/1000
(2009---2012). Similarly, in the state of São Paulo
(South-eastregion),theaverageearlyneonatalmortalityratefell
from 8.67/1000, in 2000, to 5.74/1000 in 2010,18 while
the late neonatal mortality remained around 2.5/1000
(2006---2010).19
Brazil’s reductions in neonatal mortality risk compare
favorablytointernationalstandards.In2004,theneonatal
mortalityrateindevelopingcountrieswas31/1000,and76%
oftheneonataldeathsoccurredinthefirstweekoflife.20
In developed countries, there are few neonatal deaths,
withratesaround4/1000in2004.20Inunderdevelopedand
developingcountries(2010---2012), 34%ofneonataldeaths
occur onthe same day aschildbirth, and 14% in the day
after.21Inlow-incomecountries,thelateneonatalmortality
ratein2004wasapproximately7/1000,whileindeveloped
countries,thisratewasnearly1/1000.20
Neonatal mortality is gradually decreasing in several
partsoftheworld.From1990to2010,therewasadecrease
inneonatalmortality rates of approximately50%in
Euro-peanregions, and19%in Africanregions.22 Inthe present
1.05
A
B
C
10.95
0.9
0.85
0.8
0.75
0.7
0.65
0.6
1997-2000 2001-2004 2005-2008
Period
2009-2012
1997-2000 2001-2004 2005-2008
Period
Relativ
e r
isk
Relativ
e r
isk
Relativ
e r
isk
2009-2012
1997-2000 2001-2004 2005-2008
Period
2009-2012 1.05
1
0.95
0.9
0.85
0.8
0.75
0.7
0.65
0.6
1.05 1.1
1
0.95
0.9
0.85
0.8
0.75
0.7
0.65
0.6
Figure 2 Trends in mortality rates from 1997 to 2012. A, maternalmortality;B,earlyneonatalmortality;C,late neona-talmortality.Eachfigurecorrespondstoonebinomialnegative model.Dependentvariables ofeachmodel:maternal deaths (A),earlyneonataldeaths(B),andlateneonataldeaths(C).The factorsincludedinthemodels were:period,region,prenatal care,andhomebirth.Thenumberoflivebirthswasincludedin themodelsasanoffset.
detectedinearlyneonatalmortalityrisk,and16% dropin lateneonatalmortalityrisk.
Theavailabilityofhospitalbedsfornewborns---aswell asthe supplyof specializedequipmentforneonatal assis-tance--- is notuniform throughout Brazil.16 This situation
may explain the differences in neonatal mortality rates
acrossBrazilian regions. While in theSouth,in 1999, 40%
ofhealth institutions hadat least, ten neonatalintensive
careunit(ICU)beds,intheNorthandNortheast,only10%of
healthinstitutionshadatleasttenneonatalICUbeds.16The
prevention of neonatal deaths contributessignificantly to
reduceinfantmortality.23 Theneonatalcomponentis
asso-ciated withaccessto health servicesproviding assistance
withchildbirth,supportfornewborns,andcareforpregnant
women.23 Forexample,Brazil’sFamilyHealthProgramhas
playedasignificantroleinreducingperinatalmortality.24
Below,themainlimitationsofthisstudyarehighlighted.
The quality of health data from Brazil’s information
sys-tems is gradually improving. As the quality of mortality
information has improved only recently in the North and
Northeast regions, compared to the other regions, the
apparentincreaseinmaternalmortalityriskintheNorthand
Northeastregionsobservedinthisstudymustbeinterpreted
withcaution.Theresultsthusmayreflectrecent
improve-ments in Brazil’s health data collection systems in these
regions.25,26 Inaddition, thespread of maternal mortality
committeesacross the countryhasimproved thequantity
andqualityofinformationregardingthecausesofmaternal
deaths. In 2005, there were 748 and 206 of these
com-mitteesatthemunicipalandhospitallevel,respectively.27
Although the present findings represent official data, the
Brazilian national health information system still
experi-ences underreporting, slow data processing, and a high
numberofill-definedcausesofdeath.28
Brazilappearstohavemettheinternationaltargetsfor
reducinginfantmortality,butnotmaternalmortality.Infant
mortalityfellfrom48/100,000in1990to13.46/100,000in
2012.10,23Ifthistrendhasnotchangeduntil2015,theWorld
Health Organization (WHO) targets should be achieved.
Technologicaladvances,includingbetteruseofresourcesat
neonatalICUsthatsaveorprolonglivesofnewborns,
prob-ablycontributedtothereductionin neonatalrates during
thisperiod.
Maternal mortality rates have fallen, but this figure
still remains high and above the 75% reduction target
for the 1990---2015 period,2,3,9 i.e., reaching a level near
36/100,000.Since2001,Brazil’scurrentmaternalratehas
stagnatedataround54/100,000.Asmaternaldeathisa
sen-tineleventindicatingdeficientqualityofhealthassistance,
Brazilneedstoimprovehealthcareduringpregnanciesand
childbirth.Infact,childbirthandobstetricsproblemswere
themaincausesofhospitalizationin2001inpublichealth
hospitalsofBrazil.29
Publichealthpoliciescancontributetominimizehealth
risksinpregnantwomenandnewborns,aswellasimprove
accesstohealthassistance.TheMinistryofHealthhasmade
effortstoreduce theseindicators byestablishing national
pactsin2006,andbystartingnewprogramsliketheStork
Networkin2011.Healthofficialssetupthisnetworkinorder
toguaranteetherighttoasafebirth.Additional
intersec-toralactionscouldalsocontributetohealthpromotionand
favorpositiveresultsinthehealthofchildrenandwomen.1
Conflicts
of
interest
Theauthorsdeclarenoconflictsofinterest.
References
1.WorldHealthOrganization(WHO).Womenandhealth:today’s
Available from: http://www.who.int/gender-equity-rights/ knowledge/9789241563857/en/[cited18.04.16].
2.OestergaardMZ,InoueM,YoshidaS,MahananiWR,GoreFM, CousensS,etal.Neonatalmortalitylevelsfor193countriesin 2009withtrendssince1990:asystematicanalysisofprogress, projections,andpriorities.PLoSMed.2011;8:e1001080. 3.HoganMC,ForemanKJ,NaghaviM,AhnSY,WangM,MakelaSM,
etal.Maternalmortalityfor181countries,1980---2008:a sys-tematicanalysisofprogresstowardsMillenniumDevelopment Goal5.Lancet.2010;375:1609---23.
4.LaurentiR,JorgeMH,GotliebSL.Maternalmortalityin Brazil-ianStateCapitals:somecharacteristicsand estimatesfor an adjustmentfactor.RevBrasEpidemiol.2004;7:449---60. 5.MorseML,FonsecaSC,BarbosaMD,CalilMB,EyerFP.Maternal
mortalityinBrazil:whathasthescientificliteratureshownin thelast30years.CadSaudePublica.2011;27:623---38. 6.Ferraz L, Bordignon M.Mortalidade materna no Brasil: uma
realidade que precisa melhorar. Rev Baiana Saude Publica. 2012;36:527---38.
7.LanskyS,LimaFricheAA,SilvaAA,CamposD,Azevedo Bitten-courtSD,CarvalhoML,etal.BirthinBrazilsurvey:neonatal mortality,pregnancyandchildbirthqualityofcare.CadSaude Publica.2014;30:S1---15.
8.ProgramadasNac¸õesUnidasparaoDesenvolvimento(PNUD). Relatório do Desenvolvimento Humano Brasil 2009/2010. Brasília:UltraDigitalGráficaEditoraLtda;2010.Availablefrom: http://www.pnud.org.br/HDR/Relatorios-Desenvolvimento-Humano-Brasil.aspx?indiceAccordion=2&li=liRDHBrasil [cited 16.04.16].
9.United Nations (UN). The Millennium Development Goals Report 2008. New York: United Nations; 2008. Avail-ablefrom:http://www.un.org/millenniumgoals/reports.shtml [cited17.04.16].
10.MinistériodaSaúde,Brasil.SaúdeBrasil2011:Umaanáliseda situac¸ãodesaúdeevigilânciadasaúdedamulher,Brasília: Min-istériodaSaúde;2012.Availablefrom:http://artemis.org.br/ wp-content/uploads/2013/11/saudebrasil20111.pdf [cited 17.04.16].
11.SouzaJP.MaternalmortalityinBrazil:theneedfor strength-ening health systems. Rev Bras Ginecol Obstet. 2011;33: 273---9.
12.Ministério da Saúde, Brasil. DATASUS. [Health Information] Brazil; 2015. Available from: http://www2.datasus.gov.br/ DATASUS/index.php[cited16.02.14].
13.RedeInteragencialdeInformac¸õesparaaSaúde(RIPSA). Indi-cadoresedadosbásicos---Brasil---2012.Brasília;2012.Available from: http://tabnet.datasus.gov.br/cgi/idb2012/matriz.htm [cited26.10.15].
14.Ismail N, Jemain AA. Handling overdispersion with nega-tive binomial and generalized Poisson regression models. Casualty Actuar Soc Forum. 2007:103---58. Available from: http://www.casact.org/pubs/forum/07wforum/07w109.pdf [cited29.01.16].
15.Carreno I, Bonilha AL, Costa JS. Temporal evolution and spatial distribution of maternal death. Rev Saude Publica. 2014;48:662---70,discussion670.
16.LealMdC,ViacavaF.MaternitiesinBrazil.Radis:Comunicac¸ão emSaúde;2002.p.8---22.
17.Viacava F, Bahia L. Health services offering: an analysis of medical and healthcare research (AMS); 1999. Texto para Discussão n.◦ 915. Available from: http://www.ipea.gov.br/
portal/index.php?option=com content&view=article&id=4146% 3Atd-0915-oferta-de-servicos-de-saude-uma-analise-da-pesquisa-assistencia-medico-sanitaria-ams-de-1999&catid= 312%3A2002&directory=1&Itemid=1[cited29.01.16].
18.São Paulo Portal de Estatísticas do Estado de São Paulo. Fundac¸ão Sistema Estadual de Análise de Dados. Anuário estatístico do estado de São Paulo; 2003. Available from: http://produtos.seade.gov.br/produtos/anuario/ [cited 25.05.15].
19.Almeida MC, Gomes CM, Nascimento LF. Spatial analysis of neonatalmortalityinthestateofSãoPaulo,2006---2010.Rev PaulPediatr.2014;32:374---80.
20.WorldHealthOrganization(WHO).Neonatalandperinatal mor-tality: country,regional and global estimates 2004. Geneva: WHO; 2004. Available from: http://whqlibdoc.who.int/ publications/2007/9789241596145eng.pdf[cited25.05.15]. 21.SaleemS,McClureEM,GoudarSS,PatelA, EsamaiF,Garces
A,etal.Aprospectivestudyofmaternal,fetalandneonatal deathsinlow-andmiddle-incomecountries.BullWorldHealth Organ.2014;92:605---12.
22.WorldHealthOrganization(WHO).Neonatalmortality:trends 1990---2010.Geneva:WHO;2011.Availablefrom:http://www. who.int/maternalchildadolescent/topics/newborn/neonatal mortality/en/[cited14.12.11].
23.UnitedNationsChildren’sFund(UNICEF).Thestateofworld’s children2008.NewYork:UNICEF;2007.
24.PaimJ,TravassosC,AlmeidaC,BahiaL,MacinkoJ.The Brazil-ianhealthsystem:history, advances,and challenges.Lancet. 2011;377:1778---97.
25.Victora CG. Potential interventions to improve the health of mothers and children in Brazil. Rev Bras Epidemiol. 2001;4:3---69.
26.VictoraCG,AquinoEM,doCarmoLealM,MonteiroCA,Barros FC,SzwarcwaldCL.MaternalandchildhealthinBrazil:progress andchallenges.Lancet.2011;377:1863---76.
27.Brasil. Ministério da Saúde. Secretaria de Atenc¸ão à Saúde. DepartamentodeAc¸õesProgramáticasEstratégicas.Manualdos comitêsdemortalidadematerna.3ed.Brasília:Ministérioda Saúde;2007.(SérieA.NormaseManuaisTécnicos).
28.BessaFerreiraVM,PortelaMC.Evaluationofunder-reportingof AIDScasesinthecityofRiodeJaneirobasedondatafromthe hospitalinformationsystemoftheUnifiedHealthSystem.Cad SaudePublica.1999;15:317---24.