Aline Chimello FerreiraI Francisco Chiaravalloti NetoII
I Coordenadoria de Controle de Doenças. Secretaria de Saúde de São Paulo. São Paulo, SP, Brasil
II Superintendência de Controle de Endemias. São José do Rio Preto, SP, Brasil
Correspondence: Francisco Chiaravalloti Neto Av. Brigadeiro Faria Lima, 5416
15.090-000 São José do Rio Preto, SP, Brasil E-mail: [email protected]
Received: 11/10/2006 Reviewed: 5/15/2007 Approved: 6/18/2007
Infestation of an urban area by
Aedes aegypti
and relation with
socioeconomic levels
ABSTRACT
OBJECTIVE: To assess the association between Aedes aegypti larvae infestation rates and socioeconomic factors.
METHODS: Infestation rates in the urban area of the city of São José do Rio Preto, Southeastern Brazil, were calculated in January of 2005 and subsequently geocoded by address. The urban census tracts were grouped by means of main component analysis, thus producing four socioeconomic clusters (1–4, in a decreasing order of socioeconomic level) and a fi fth cluster (5) with a level below the others and not belonging to the urban census tracts (new districts and irregular residential development projects). The Breteau index (BI), the house index (HI), and the container index (CI), as well as the averages of existing containers surveyed per home, were calculated for each cluster.
RESULTS: The values of infestation indices did not show signifi cant differences among socioeconomic clusters 1 to 4, even though they were lower than the indices obtained for cluster 5. The averages of existing containers surveyed were higher for cluster 1 in relation to clusters 2 to 4, but did not show signifi cant differences when compared to cluster 5.
CONCLUSIONS: Larval indices did not show association with the different socioeconomic levels of the cluster that corresponds to the urban census tracts. Nonetheless, new districts, irregular residential development projects and locations adjacent to those with the worst basic sanitary conditions showed the highest values for these indicators.
KEY WORDS: Aedes aegypti. Larva, growth & development. Indica-tors. Insect vecIndica-tors. Urban zones.
INTRODUCTION
Effective control of Aedes aegypti is feasible, yet diffi cult. A better understand-ing of the ecology of the disease could lead to practical results, especially regarding prioritization of vector control in high-risk areas.17 Some factors
infl uence the mosquito density, such as sanitary conditions and the communi-ties’ socioeconomic and cultural aspects. Donalísio & Glasser5 affi rmed that
knowledge about these factors is crucial to understand the dengue epidemics and to direct control practices.
There are few published studies on the association between larval infestation levels and socioeconomic characteristics. This, in addition to the endemic context of dengue fever and urban infestation by Aedes aegypti
in the city of São José do Rio Preto,10 enabled to raise
the hypothesis that this infestation may occur in distinct regions of the city in different manners, possibly related to socioeconomic factors. By stratifying environments according to larval infestation indices, different strate-gies could be adopted.
The objective of the study was to analyze the asso-ciation between spatial variations of larval infestation indices by Aedes aegypti and socioeconomic factors.
METHODS
The study was carried out in the city of São José do Rio Preto, in the state of São Paulo’s northwest region, at 20º49’11” south latitude and 49º22’46” west longi-tude, with an area of 434.10 km2 and a population of
415,509 inhabitants. The local climate is tropical and the average temperature is 25.4ºC, with an average precipitation of about 200mm in the period between October and March.
The city’s urban area is comprised of 432 census tracts, according to the division conducted by the Fundação Instituto Brasileiro de Geografi a e Estatística – IBGE (Brazilian Institute of Geography and Statistics Foun-dation).* There are also some districts that are within the city’s urban boundaries, even though they are not included in the census tracts (new districts), and ir-regular residential development projects, located in rural areas, adjacent to the urban boundaries.
New districts are characterized by the presence of low income families and, in some cases, slums that were turned into housing projects, though with the minimum basic sanitary conditions (water, sewage system and garbage collection). Irregular residential development projects, despite their being located outside the urban boundaries, are inhabited by low income people, have urban characteristics, and are constituted by plots of land that are generally larger than those in urban areas. Their homes are only provided with (shallow or deep) well water, having neither a collective sewage disposal system (septic tank or untreated open sewage) nor regular garbage collection. Furthermore, the streets are unpaved.
In January of 2005, São José do Rio Preto’s Munici-pal Dengue Control Team conducted a survey on the infestation rate by two-stage cluster sampling9 (block
and building).1 Municipal team members visited all
the houses on the randomly selected blocks, surveyed existing containers, and collected mosquito larvae when these were present. Larva samples were sent to
the laboratory of the Superintendência de Controle de Endemias – Sucen (Superintendence of Endemic Dis-ease Control) for identifi cation and count. The samples were considered positive if Aedes aegypti larvae were found. The data were recorded in bulletins and input into the Aedes 7 program.** After this, all this infor-mation was grouped per block and geocoded by block address with the help of the MapInfo program*** and also São José do Rio Preto’s Cartographic Basis, in the UTM (Universal Transverse Mercator projection), provided by the City Hall.
The infestation indices utilized were the following:
• Breteau Index (BI) – number of containers with
Aedes aegypti larvae per 100 homes surveyed;3
• House Index (HI) – relation, in percentage, between the number of homes where Aedes aegypti larvae were found and the number of homes surveyed;
• Container Index (CI) – relation, in percentage, between the number of containers with water and the positive ones, that is, with the presence of Aedes aegypti;8
• Average number of existing containers per home – potential recipients for vector breeding, found in a home, with or without water;
• Average number of containers surveyed per home – containers that, at the moment of visit, were found with water, in a home.
All the 432 census tracts were grouped in distinct clus-ters by means of main component analysis. To carry out this analysis, the following socioeconomic variables were selected: average income and years of education of householders; average income and years of education of female householders; proportion of illiterate women and people; and proportion of households with fi ve or more residents.
The analysis was made by means of the STATA pro-gram and it produced several factors, of which the one responsible for the largest proportion of total variation was chosen. The factor value for each census tract was calculated, with each variable value being multiplied by the respective factorial weights obtained from the main component analysis and by the sum of results found. The value of each tract was utilized to divide the area with the 432 census tracts into four clusters, according to socioeconomic levels (quartiles).
Taking into consideration a predicted BI value equal to 15 containers with Aedes aegypti larvae per 100 homes surveyed, precision of 1 and alpha error of 5%, the sample size calculated for each of the four census tract
clusters was 4,732 homes. This value was increased to 6,760 homes due to an expected proportion of closed homes of 30%. Thus, for the city’s entire urban area, the sample size was 27,040 homes.
The geocoded information was initially grouped by cen-sus tracts and subsequently by the four socioeconomic tracts. For each cluster, the following indicators were calculated: average of existing containers per home, average of containers surveyed per home, BI, HI, and CI. Thematic maps of the four socioeconomic clusters and BI values referring to the cluster of the urban census tracts were designed.
Some of the information contained in the survey of infestation indices, also grouped per block and geo-coded by address, was located outside the census tract’s area range. The buildings located in new districts and irregular residential development projects were ana-lyzed as another cluster, distinct from the other four socioeconomic clusters.
The city’s urban census tracts were characterized ac-cording to socioeconomic levels and in relation to some environmental characteristics (water supply, sewage system and garbage collection). Socioeconomic and environmental information on the buildings located on blocks that were situated in new districts and in irregular residential development projects was not available. To obtain this information, a qualitative characterization by means of local visits was performed.
The values of larval indices (BI, HI, CI) and the aver-age numbers of existing containers and containers sur-veyed are shown with the respective 95% confi dence intervals. The statistical analysis of these values was made by means of a comparison of the respective confi dence intervals.
The research project was approved by the Ethics and Research Committee at the Faculdade de Medicina de São José do Rio Preto (School of Medicine of São José do Rio Preto).
RESULTS
A total of 22,254 buildings were surveyed. The BI value obtained for the city was 7.8 containers (95%CI: 7.1 – 8.5) with Aedes aegypti larvae per 100 homes surveyed.
The database with the infestation indices of surveyed addresses was comprised of 1,451 blocks. Information on all blocks was georeferenced, except for one that was not found. A total of 1,380 blocks out of these 1,450 were grouped according to urban census tracts, while other 70 blocks were analyzed separately as they were outside the area range.
The analysis of main components with the variables
utilized produced one factor, here denominated as socioeconomic factor, with 87% of the variation total. The factor characterized the socioeconomic level of urban census tracts, so that the higher its value, the bet-ter the socioeconomic level of the residing population. The composition of the factor was the following: 0.97 x (average years of education of householders) + 0.94 x (average years of education of female householders) + 0.85 x (average income of householders) + 0.85 x (average income of female householders) – 0.89 x (proportion of illiterate people) – 0.89 x (proportion of illiterate women) – 0.56 x (proportion of homes with fi ve or more residents).
Four ranges were established for the socioeconomic factor; the grouping with the highest values was denominated Cluster 1 (best socioeconomic level), the grouping of tracts with the lowest values was de-nominated Cluster 4 (worst socioeconomic level), and the groupings of tracts with intermediate values were denominated Clusters 2 and 3. The grouping result gen-erated a thematic map (Figure 1). The socioeconomic and environmental characterization of the fours clusters is shown on Table.
Figure 1. Urban census tracts grouped in socioeconomic clusters. São José do Rio Preto, Southeastern Brazil, 2005.
N 1
0 2.500
meters
5.000
Urban census tracts
Socioeconomic clusters (number of tracts)
All the 70 blocks that were outside the area range of the urban census tracts were analyzed as a separate cluster and are shown on Figure 2. These blocks were grouped
under the denomination of socioeconomic cluster 5. The visits conducted enabled to identify this area as having a socioeconomic level below cluster 4.
By comparing Figures 1 and 3, where the BI values according to census tracts are shown, it is observed
N 1
0 2.500
meters
5.000
Breteau Index
Number of containers with Aedes aegypti larvae per 100 homes
10,8 to 55,6 6,9 to < 10,8 3,6 to < 6,9 0,5 to < 3,6
Figure 3. Distribution of Breteau index values for the urban census tracts. São José do Rio Preto, SP, 2005.
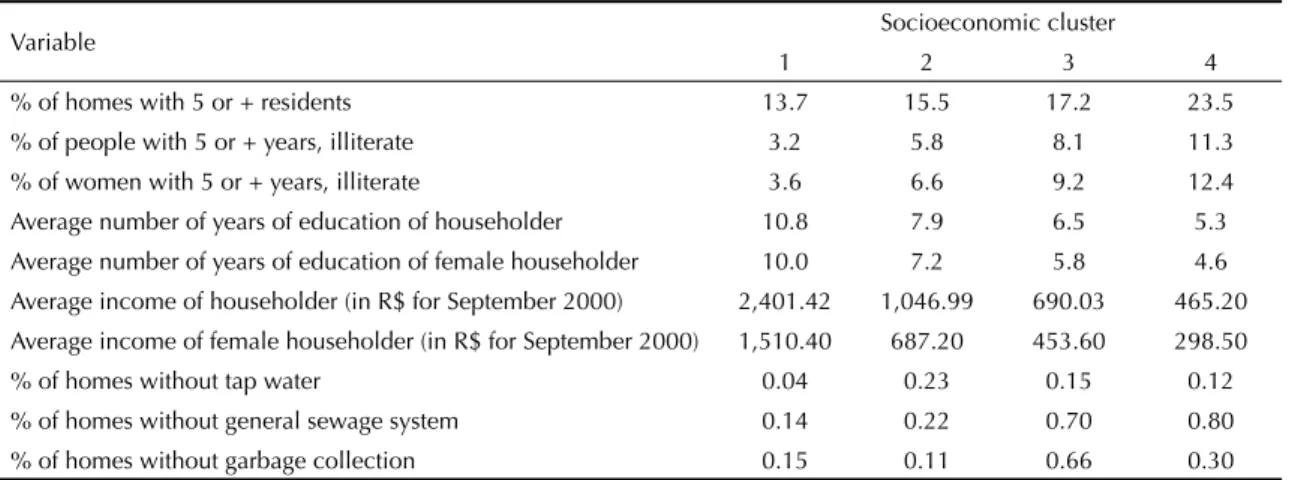
Table. Socioeconomic and environmental characterization of socioeconomic clusters corresponding to the urban census tracts. São José do Rio Preto, Southeastern Brazil, 2000.
Variable Socioeconomic cluster
1 2 3 4
% of homes with 5 or + residents 13.7 15.5 17.2 23.5 % of people with 5 or + years, illiterate 3.2 5.8 8.1 11.3 % of women with 5 or + years, illiterate 3.6 6.6 9.2 12.4 Average number of years of education of householder 10.8 7.9 6.5 5.3 Average number of years of education of female householder 10.0 7.2 5.8 4.6 Average income of householder (in R$ for September 2000) 2,401.42 1,046.99 690.03 465.20 Average income of female householder (in R$ for September 2000) 1,510.40 687.20 453.60 298.50 % of homes without tap water 0.04 0.23 0.15 0.12 % of homes without general sewage system 0.14 0.22 0.70 0.80 % of homes without garbage collection 0.15 0.11 0.66 0.30
0 4.000
meters
8.000
City’s boundaries Urban census tracts
Blocks of socioeconomic cluster 5 N
1
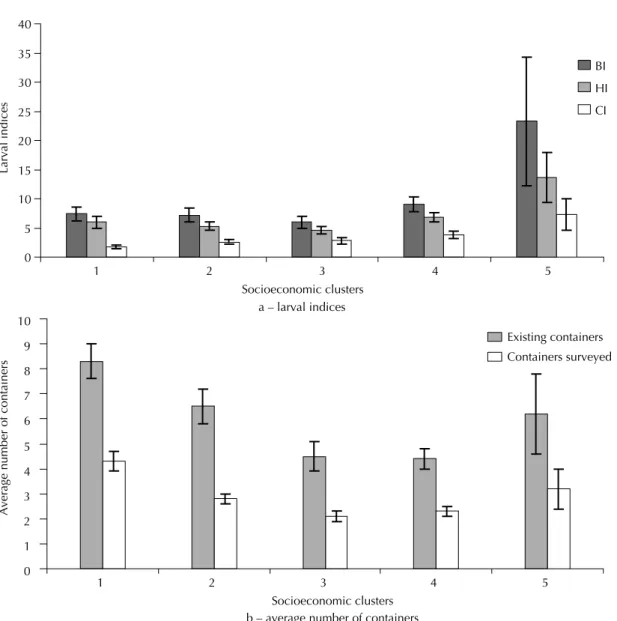
that low, medium and high BI values occurred in the four socioeconomic clusters. In other words, no relation between the index values and the socioeconomic levels in the cluster corresponding to the urban census tracts was verifi ed. This behavior is confi rmed by the results shown on Figure 4 (a), where it can be observed that practically no signifi cant differences occurred among the three indices (BI, HI and CI) in relation to socioeco-nomic clusters 1 to 4. The exceptions were: the BI and the HI showed differences in clusters 3 and 4; the CI showed a signifi cant difference between clusters 1 and 3 and clusters 1 and 4. On the other hand, the values of the three indicators for socioeconomic cluster 5 were higher than the values for the other clusters.
By the comparison of the average number of existing containers and containers surveyed per home in the fi ve clusters, the following behavioral characteristics
were identifi ed: (Figure 4 - b): cluster 1 values were signifi cantly higher than clusters 2 to 4; cluster 2 values were signifi cantly higher than clusters 3 and 4; clusters 3 and 4 values did not show differences between them; cluster 5 values did not show signifi cant differences in relation to clusters 1 to 4. Except for cluster 5, and considering clusters 3 and 4 together, it is observed that the better the socioeconomic level, the higher the values of these two variables.
DISCUSSION
The main limitation of this study is the use of second-ary data on Aedes aegypti infestation. In the case of the city of São José do Rio Preto, fi eld workers are trained and supervised regularly, thus guaranteeing work qual-ity and uniformqual-ity. However, one of the diffi culties is
Socioeconomic clusters a – larval indices 0
5 10 15 20 25 30 35 40
1 2 3 4 5
Larval indices
BI
HI
CI
Socioeconomic clusters b – average number of containers 0
1 2 3 4 5 6 7 8 9 10
1 2 3 4 5
Average
number of co
ntainers
Existing containers Containers surveyed
related to the counting of existing containers and con-tainers surveyed. This problem affects the RI and the average numbers of existing containers and containers surveyed, even though it does not interfere with the BI and the HI.
Focks7 affi rms that the CI is probably the poorest
epide-miological indicator for dengue transmission, because it does not take into consideration the number of con-tainers per area, home or individual, and also because the counting of containers depends on the observer’s discernment. For this author, among the larval infesta-tion indicators, the BI is the most effi cient one, as it combines information about containers and homes.
Another issue related to containers is the diffi cult access to some of them (water tank and gutter, among others), in which case workers usually do not have the means to conduct larval survey. Nonetheless, this problem is considered to occur in a generalized form, thus affecting indicators obtained for all the city clusters uniformly.
Any proposals to modify dengue control strategies must take into consideration not only Aedes aegypti infesta-tion and its determining factors, but also the disease behavior, which was not mentioned here. In this sense, Mondini & Chiaravalloti-Neto11 (2007) carried out a
study to assess the disease behavior and its relation to socioeconomic levels. The authors identifi ed, in certain periods, a minor infl uence from socioeconomic factors on dengue incidence, which coincides with the results from this study, though in relation to the vector.
Lack of signifi cant difference for the three indices (BI, HI, and CI) among the socioeconomic clusters (1 to 4) may evidence an absence of direct relation between the worst socioeconomic levels and the highest infestation levels by vector or risk of dengue occurrence. These results corroborate the fi ndings by Costa,* in a study conducted in the city of São José do Rio Preto to verify the conditioning factors in the occurrence of Aedes aegypti. The associations between BI values and the three identifi ed socioeconomic units were insuffi cient to point to a clear relation between socioeconomic unit and level of infestation.
Despite socioeconomic differences among the four clusters, the data presented on Table 1 show that the proportions of homes without water, sewage system and garbage collection are very small and similar. These adequate basic sanitary conditions could provide an explanation for the lack of relation between infestation and socioeconomic levels. However, cluster 5 showed signifi cantly high values for the three larval indices. As this is a region where socioeconomic, sanitary and
environmental conditions are poorer when compared to the other regions, it serves to confi rm the hypothesis that has been revoked in the area range of urban census tracts.
The results found point to a relation to the socioeco-nomic levels, though with a preponderance of basic sanitary aspects. Poorer areas with good basic sanitary conditions can have the same infestation levels than richer areas. On the other hand, a poor area without adequate basic sanitary conditions will have higher infestation levels and risks of dengue occurrence. An example of this is presented in a study conducted by Oliveira & Valla,14 where the relation between
pre-cariousness of basic sanitary services in slums of the city of Rio de Janeiro and the emergence of dengue epidemics is shown. Souza-Santos & Carvalho,16 in a
study conducted in the district of Ilha do Governador, in the city of Rio de Janeiro, identifi ed the slum region as permanently positive for Aedes aegypti larvae and linked this problem to the water supply irregularity.
On the island of São Luís, the capital of the state of Maranhão, the high density of infested buildings is due to, among other things, the great concentration of people in clusters of homes without basic sanitary conditions on the capital’s outskirts.15 Chan et al4 found signifi cant
differences of larval indices in areas with different so-cioeconomic and living standards. On the other hand, Barcelos et al2 found distinct results in the city of Porto
Alegre. Areas with high coverage of water supply ser-vices and higher number of people in the same home were the ones that showed highest vector concentration.
One of the expected consequences of the present study was that criteria permitting prioritization of dengue control and surveillance practices were defi ned. The fact that the highest infestation levels were found in cluster 5 shows that this region must be prioritized. Preliminary studies** point to the important role of the occurrence of dengue cases in an irregular residential development project, in the end of 2005, which led to the epidemic outbreak that happened in the city of São José do Rio Preto in 2006.
In any case, the existence of mosquito clusters and den-gue cases is an issue that needs to be further investigated. Studies carried out in Thailand13 and in Peru7 concluded
that homes infested by Aedes aegypti were randomly scattered in the neighborhood. Another study, carried out in Puerto Rico,12 showed that clusters of dengue
cases were identifi ed within very short distances, most probably in the homes, as well as the fact that control measures should be adopted uniformly throughout the whole area affected by transmission to be effective.
1. Alves MCGP, Gurgel SM, Almeida MCRR. Plano amostral para cálculo de densidade larvária de Aedes
aegypti e Aedes albopictus no estado de São Paulo,
Brasil. Rev Saude Publica. 1991;25(4):251-6.
2. Barcellos C, Pustai AK, Weber MA, Brito MRV. Identifi cação de locais com potencial de transmissão de dengue em Porto Alegre através de técnicas de geoprocessamento. Rev Soc Bras Med Trop.
2005;38(3):246-50.
3. Breteau H. La fi ève jaune en Afrique-Occidentalle Française. Un aspect de la médicine preventive massive. Bull World Health Org. 1954;11(3):453-81.
4. Chan YC, Chan KL, Ho BC. Aedes aegypti (L.)
and Aedes albopictus (Skuse) in Singapore City. 1.
Distribution and Density. Bull World Health Org.
1971;44(5):617-27.
5. Donalísio MR, Glasser CM. Vigilância entomológica e controle de vetores do dengue. Rev bras epidemiol.
2002;5(3):259-79.
6. Focks DA. A Review of entomological sampling methods and indicators for dengue vectors. Gainsville: World Health Organization; 2003.
7. Getis A, Morrison AC, Gray K, Scott TW.
Characteristics of the spatial pattern of the dengue vector, Aedes aegypti, in Iquitos, Peru. Am J Trop Med Hyg. 2003;69(5):494-505.
8. Gomes AC. Medidas dos níveis de infestação urbana para Aedes(Stegomyia) aegypti e Aedes (Stegomyia)
albopictus em programa de vigilância epidemiológica.
Inf Epidemiol SUS. 1998;7:49-57.
9. Kish LS. Survey sampling. New York: John Wiley; 1967.
10. Mondini A, Chiaravalloti Neto F, Gallo y Sanches M, Lopes JCC. Análise espacial da transmissão de dengue em cidade de porte médio do interior paulista. Rev
Saude Publica. 2005;39(3):444-51.
11. Mondini A, Chiaravalloti Neto, F. Investigação do papel das variáveis socioeconômicas na transmissão de dengue em cidade de porte médio do interior do estado de São Paulo. Rev Saude Publica; 2007. No prelo.
12. Morrison AC, Getis A, Santiago M, Rigau-Perez JG, Reiter P. Exploratory space-time analysis of reported dengue cases during na outbreak in Florida, Puerto Rico, 1991-1992. Am J Trop Med Hyg.
1998;58(3):287-98.
13. Morrison AC. Astete H. Chapilliquen F, Ramirez-Prada C, Diaz G, Getis A, et al. Evaluation of a sampling methodology for rapid assessment of Aedes aegypti
infestation level in Iquitos, Peru. J Med Entomol.
2004;41(3):502-10.
14. Oliveira RM, Valla VV. As condições e as experiências de vida de grupos populares no Rio de Janeiro: repensando a mobilização popular no controle do dengue. Cad Saude Publica. 2001;17(supl.):S77-88.
15. Rebêlo JMM, Costa JML, Silva FS, Pereira YNO, Silva JM. Distribuição de Aedes aegypti e do dengue no Estado do Maranhão, Brasil. Cad Saude Publica.
1999;15(3):477-86.
16. Souza-Santos R, Carvalho MS. Análise da distribuição espacial de larvas de Aedes aegypti na Ilha do Governador, Rio de Janeiro, Brasil. Cad Saude Publica.
2000;16(1):31-42.
17. Strickman D, Kittayapong P. Dengue and its vectors in Thailand: introduction to the study and seasonal distribution of Aedes larvae. Am J Trop Med Hyg.
2002;67(3):247-59.
REFERENCES
Supported by the Fundação de Amparo à Pesquisa do Estado de São Paulo – FAPESP(Research Support Foundation of the state of São Paulo) – Process nº 04/12623-3.
Article based on Master’s degree dissertation by AC Ferreira, presented to the Programa de Pós-Graduação em Ciências, da Coordenadoria de Controle de Doenças da Secretaria de Estado da Saude de São Paulo (Post-Graduation Program in Science from the Disease Control Offi ce of the state of São Paulo’s Health Department), in 2006.
Even with the need to analyze data on containers more cautiously, some considerations should be made. The di-rect relation between a larger number of existing contain-ers and containcontain-ers surveyed and better socioeconomic levels (except for cluster 5) could be related to the greater size of plots of land and constructions in wealthier areas. Considering the point estimates of the CIs exclusively, these showed a behavior that was the opposite of the container averages. In the end, there was a compensation, a greater number of containers in the wealthiest regions that was followed by lower positivity.
New studies must be conducted to confi rm and explain the differences found in the infestation levels in the area range of the urban census tracts. The fi rst issue would be to investigate whether there is some type of structure of spatial dependence in the mosquito population or not.7,13