Cristiane MelereI
Juliana Feliciati HoffmannI
Maria Angélica Antunes NunesI
Michele DrehmerI
Caroline BussI
Silvia Giselle Ibarra OzcarizI
Rafael Marques SoaresI
Patricia Portantiolo ManzolliI
Bruce Bartholow DuncanI
Suzi Alves CameyII
I Programa de Pós-Graduação em Epidemiologia. Departamento de Medicina Social. Faculdade de Medicina. Universidade Federal do Rio Grande do Sul. Porto Alegre, RS, Brasil
II Instituto de Matemática. Departamento de Estatística. Universidade Federal do Rio Grande do Sul. Porto Alegre, RS, Brasil Correspondence:
Cristiane Melere
Departamento de Medicina Social / PPG-Epidemiologia - UFRGS
Rua Ramiro Barcelos, 2600 - 4º andar Sala 419 90035-003 Porto Alegre, RS, Brasil E-mail: [email protected] Received: 8/23/2011 Approved: 7/8/2012
Article available from: www.scielo.br/rsp
Healthy eating index for
pregnancy: adaptation for use
in pregnant women in Brazil
ABSTRACT
OBJECTIVE: To evaluate dietary quality in a sample of pregnant women based on one simple and objective parameter.
METHODS: Pregnant women (n = 712), between 16 and 36 weeks, attending primary care clinics in Porto Alegre and Bento Gonçalves, Southern Brazil, in 2010 were recruited to take part. The Healthy Eating Index for Brazilian Pregnancy (HEIP-B) was created, derived from the American instrument called Alternate Healthy Eating Index for Pregnancy (AHEI-P). Questionnaires on frequency of consumption and on socio-demographic factors were completed. Focused principal component analysis (ACPF) was used to assess the relationship between the index and nutrients relevant to pregnancy.
RESULTS: The median (interquartile range) of AHEI-P and HEIP-B were 66.6 (57.8-72.4) and 67.4 (60.0-73.4), respectively. The HEIP-B showed a good positive correlation with nutrients which are specifi cally recommended for pregnancy: folate (r = 0.8; p < 0.001), calcium (r = 0.6; p < 0.001) and iron (r = 0.7; p < 0.001).
CONCLUSIONS: The quality of the diet of the pregnant women in this study was classifi ed as within the “improvements needed” cut off point, which demonstrates the need for more specifi c education on nutrition for this stage of life. The index showed good correlations and, thus, may be considered an effective tool for assessing the quality of nutrition during pregnancy.
Pregnancy is a period during which nutritional neces-sities increase, and appropriate nutrition is essential to the health of mother and baby. Pregnant women should consume specifi c varieties and quantities of foods, bearing in mind dietary guidelines and cultural eating habits, in order to meet energy and nutrition needs and
to follow weight gain recommendations.a
From a public health perspective, previous diagnosis and assessment of subsequent food intake in order to deter-mine the prevalence of appropriate consumption is as important as correct guidance. The study of dietary intake is a complex process, as nutrition involves biological, socio-economic, cultural and symbolic dimensions.2
One way of assessing nutrition patterns is through a
priori methods, using existing nutritional knowledge.
For example, indexes which evaluate individuals’ consumption compared to what is recommended are created using specifi c dietary guidelines.9,11
One such index, called the Healthy Eating Index (HEI) was produced by the US Department of Agriculture in order to assess the quality of the Americans’ diet. It includes ten components: fi ve refer to food groups from the American Dietary Guide (“Grains”, “Vegetables”, “Fruit”, “Dairy” and “Meat”), four to nutrients (“total fat”, “saturated fat”, “cholesterol” and “sodium”), and one that measures variety in the diet. Each component scores between 0 and 10.10
There are few studies on specifi c dietary standards in pregnancy, especially with dietary indexes.
Rifas-Shiman et al,25 used the Alternate Healthy Eating
Index (AHEI) to create a healthy eating index adapted for pregnancy: Alternate Healthy Eating Index for Pregnancy (AHEI-P). This index, created to assess diet quality, has nine components, each of which is worth ten points: vegetables; fruit; two ratios (“white meat/ red meat” and “polyunsaturated/saturated”); fi ber; trans fats; folate, calcium and iron.25
A national study carried out by Maedab applied the
Healthy Eating Index adapted for pregnancy. In spite of the name used, this index is not adapted from a pregnancy specifi c instrument but rather from the HEI10
developed to evaluate the American population’s diet.
The present study aimed to assess the overall diet quality in a sample of pregnant Brazilian women based on one simple, objective parameter.
INTRODUCTION
a United States. Department of Health and Human Services. Department of Agriculture. Dietary Guidelines for Americans. Washington; 2005 [cited 2011 Jun 28]. Available from: http://www.health.gov/dietaryguidelines/dga2005/document
b Maeda AP. Padrão de consumo alimentar de gestantes atendidas em um serviço público de pré-natal: um estudo de coorte [Dissertação de Mestrado]. São Paulo: Faculdade de Saúde Pública da USP; 2002.
c Ministério da Saúde. Secretaria de Atenção à Saúde. Departamento de Ações Programáticas Estratégicas. Área Técnica de Saúde da Mulher. Pré-natal e puerpério: atenção qualifi cada e humanizada: Manual Técnico. Brasília (DF); 2005 [cited 2011 Jun 15]. [Série A. Normas e Manuais Técnicos Série Direitos Sexuais e Direitos Reprodutivos – Caderno, 5] Available from: http://portal.saude.gov.br/portal/arquivos/pdf/ manual_puerperio_2006
METHODS
Between 2006 and 2008 the Study of Dietary
Consumption and Behavior During Pregnancy20 –
(ECCAGe) was carried out. This was a prospective cohort study of pregnant women composed of four stages: I – Validating the Food Frequency Questionnaire (FFQ) for pregnancy; II – Interviews with the pregnant women; III – Immediate post-partum interviews; IV – Interviews fi ve to six months after birth.
This article refers to data collected in stage II of ECCAGe, in which 785 pregnant women, aged 13-42, were selected consecutively in the waiting room of prenatal appoint-ments in the cities of Bento Gonçalves (eight Primary Care Units and one Maternal-Infant Referral Center) and Porto Alegre (seven PCU belonging to the School Health Center Murialdo and three belonging to the Municipal Health Department). Of the pregnant women selected, 59 refused to participate (7.5%) and there were nine losses to follow up (1.2%), making a total of 712 pregnant women in the fi nal sample.
Women completed a sociodemographic questionnaire. Clinical data and data referring to the women’s height and weight (barefoot and lightly clothed) were collected according to the Ministry of Health.c
The semi-qualitative Food Frequency Questionnaire
(FFQ), previously validated for pregnant women,6
was used to collect data on diet during pregnancy. Coeffi cients of correlation, adjusted for energy ranging from 0.10 (vitamin E) to 0.50 (vitamin C), were presented in the validation of this tool. The FFQ has eight options for frequency of consumption, which range from “more than three times a day” to “never or almost never”. The list of foods was composed of 88 items. In order to assess the quantity consumed, these food items were presented in standardized portions either in serving sizes or units of the food. The interviewee reported her usual consump-tion in multiples of these porconsump-tions.
In order to determine the quantity of the product in a standard portion in grams (g) or milliliters (ml), i.e., the portion corresponding to the serving size pre-established in the FFQ, the Table for Assessing Food Consumption in Portion Sizes was used.24 Foods
The frequency with which these foods were consumed were converted into daily equivalents whose assigned values were: “more than three times/day” = 3; “two to three times/day” = 2; “once/day” = 1, “fi ve to six times/ week” = 0.79 (=[(5+6)/2]/7); “two to four times/week” = 0.43 (=[(2+4)/2]/7); “once/week” = 0.14 (= 1/7); “once or twice/month” 0.07(=[(1+3)/2]/30); “never/ almost never” = 0.
For each food item, the value of micronutrients and fi ber was calculated in g, mg or micrograms (mcg). For macronutrients, the value was calculated in g and the percentage of the recommended Daily Allowance (%RDA).
The Brazilian Table of Food Composition (TACO)d
was used as the reference to obtain the foods’ nutri-tional composition. A second table, the Table of
Food Composition: support for dietary decisions,22
was consulted when any of the food items shown in the FFQ or nutrients being investigated were not included in the TACO.d A third option was to consult
the food’s label.
Some items in the FFQ had more than one subtype in the composition tables, such as the banana which, in Pinheiro’s table,24 had fi ve different types listed.
The mean of these subtypes was calculated in such cases in order to obtain a value in g or ml which took into account the variability of the food in question.e
Estimates for the consumption of each nutrient were consolidated based on the calculation: Total of the nutrient of a food = nº portions x frequency of consump-tion/day x nutrient in the portion.e
The food items were separated into groups according to their category in the dietary guide for the Brazilian population.f The number of portions consumed of each
food was calculated according to weight in grams or volume of the foods present in the groups of the Brazilian guide.f
The mean of the subtypes of a specifi c food was used to fi nd the most representative value for the food in question. For example, for the food item “cake”. There were four subtypes in the Brazilian guide:f banana cake,
carrot cake, chocolate cake and coconut cake.
d Universidade Estadual de Campinas. Núcleo de Estudos e pesquisas em Alimentação. Tabela Brasileira de Composição de Alimentos – TACO / NEPA-UNICAMP - Versão II - 2. ed. Campinas; 2006 [cited 2011 Jun 10]. Available from: http://www.unicamp.br/nepa/TACO/tabela. php?ativo=tabela
e Food items and values of macro and micronutrients, auxiliary table. Available from: www.mat.ufrgs.br/~camey/HEIP_B/tabelaauxiliar f Ministério da Saúde. Secretaria de Atenção à Saúde. Coordenação Geral da Política de Alimentação e Nutrição. Guia alimentar para a população brasileira: promovendo a alimentação saudável. Brasília (DF); 2006 [cited 2011 Jun 02]. Available from: http://dtr2001.saude.gov. br/editora/produtos/livros/pdf/05_1109_M.pdf
Table 1. Components of the AHEI-P and HEIP-B, with scoring criteria. Bento Gonçalves and Porto Alegre, Southern Brazil, 2007. (n = 712)
Componentes Cut off point for maximum score (10) Max. Cut off point for minimum score (0) Min.
Dietary guidelines AHEI-P HEIP-Ba AHEI-P HEIP-B
Vegetables 5 portions 3.5 portions 0 portion 0 portion
Beans and other protein-rich vegetables - 1.2 portions - 0 portion
Fruit 4 portions 3.5 portions 0 portion 0 portion
Ratio white meat/red meat 4 4b 0 0b
Fiber 25 g 25 g 0 g 0 g
Trans fats 0.5% do RDA 0 g 4% do RDA 2 g
Ratio Polyunsaturated/Saturated 1 1b 0.01 0.01b
Calcium 1,200 mg - 0 mg
-< 19 years old (n = 138) - 1,300 mg - 0 mg
19 years old (n = 574) - 1,000 mg - 0 mg
Folate 600 µg 600 µg 0 µg 0 µg
Iron 27 mg 27 mg 0 mg 0 mg
AHEI-P: Alternate Healthy Eating Índex for Pregnancy; HEIP-B: Healthy Eating Index for Pregnancy – adapted to Brazil; RDA: Recommended Daily Allowance
a Number of portions calculated using equations 1 and 2
Number of portions was obtained by adding the number of portions of all foods in that group.
A syntaxg for constructing the variables necessary for
calculating the indexes of health eating was created in the SPSS v.16 program.
The Brazilian dietary guide establishes portions based on a diet of 2000 kcal.f Adapting the number of
recom-mended portions for each group included in the indexes to the need of pregnant women was based on assuming an increase of 300kcal/day during pregnancy.12 (Table
1). To that end, we used a simple rule of three.
The AHEI-P25 was based on the AHEI, excluding
“alcohol”, as it is not recommended for pregnant women, and “nuts and soya protein”, due to allergic reactions (tofu and soya were included in the “vege-table” component). Three components were added to refl ect the intake of nutrients which are particularly important during pregnancy: folate, iron and calcium.25
The AHEI-P includes nine components: two food groups (“vegetables” and “fruit”), two ratios (“white meat/red meat” and “polyunsaturated/saturated”) and fi ve nutrients (“fi ber”, “trans fats”, “calcium”, “folate” and “iron”). Each of these components has a score varying between 0 and 10 (Table 1).25
The Brazilian population dietary guidef was used in
the creation of the HEIP-B in order to establish the recommended number of portions for each food group.
The DRI13-15 were used to establish
recommenda-tions for nutrients. Minimum and maximum porrecommenda-tions
determined by the Brazilian guidef were adapted to
the additional calorie needs of pregnant women, as mentioned above. In addition, another component, present in the Brazilian guide, was included: “beans and other protein-rich vegetables”. The AHEI-P ratios for “white meat/red meat” and “polyunsaturated/satu-rated” were used, as there were no Brazilian references which documented limits.
The scores for each component were calculated (equa-tions 1 and 2) according to the criteria shown in Table 1 and intermediate values were calculated proportionally:g
The only item for which this formula could not be used was trans fats, as the higher the consumption of foods which contained them, the worse the score. Therefore, the formula used was:
In both cases, = Quantity of the component ingested x.
Min = criteria for minimum score
Max = criteria for maximum score
To demonstrate the application of equation 1, let us assume a pregnant woman consumes three portions of vegetables; her AHEI-P score for this component would be 10*(3-0)/(5-0)=6 and the HEIP-B score would be 10*(3-0)/(3.5-0)=8.6.
For the HEIP-B, the total sum of components was divided by 10 and multiplied by 9, to enable comparison with the AHEI-P.
AHEI-P and HEIP-B were categorized similarly to Basiotis et al,1 with the aim of visualizing distribution
patterns in pregnant women’s diets. The cut off points to classify the quality of the diet established by these authors may be interpreted as follows: out of a total score of 100 points, a score which classifi es a diet as “good quality” (total score > 80) indicates that at least 80% of the dietary necessities included in the index are being achieved. Similarly, for a total score of 90 points the following cut off points were established: Poor Quality (< 45 points), Needs Improvement (45 to 72 points) and High quality (72 points).1
Socio-demographic and anthropometric data were described as means, standard deviations or absolute and relative frequencies. Quartiles and percentages for those pregnant women who scored maximum and minimum scores were used to describe the two dietary indexes.
Spearman’s correlation coeffi cient was used to measure the linear association between the indexes and nutrients investigated, due to the asymmetry of the data. Focused principal component analysis (FPCA) was used with
Spearman’s correlation5 in order to obtain graphic
representations of each of the indexes with some of the nutrients. This technique enables the description and understanding of the relationships between differing variables, particularly response variables, in the case of this study, the two indexes. The results are shown graphically and the variable of interest is in the center. Circles with a smaller radius indicate closer correlation. The 2nd circle from the outside defi nes correlation coeffi cients statistically signifi cant at the 5% level.3
This analysis was carried out using the R program (R
Development Core Team, 2008) using the psy library.5
The other analyses were carried out with SPSS v.16.
The research, based on stage II of the ECCAGe, was approved by the Ethical Research Committee of the
Universidade Federal do Rio Grande do Sul, of the
School Health Center Murialdo and of the Municipal Health Department of Porto Alegre and Bento
years old (SD = 6.4) and a mean of 7.6 years of schooling (SD = 2.7). The majority of the women (78.5%) were married or living with their partner and the mean household income was 1.1 minimum wages (SD = 0.7). The mean gestational age was 24.5 weeks (SD = 5.8)
Gonçalves (Protocol nº 2006561/2006). The interviews were carried out in a designated area, after a consent form had been signed.
RESULTS
The 712 pregnant women had a mean age of 24.6
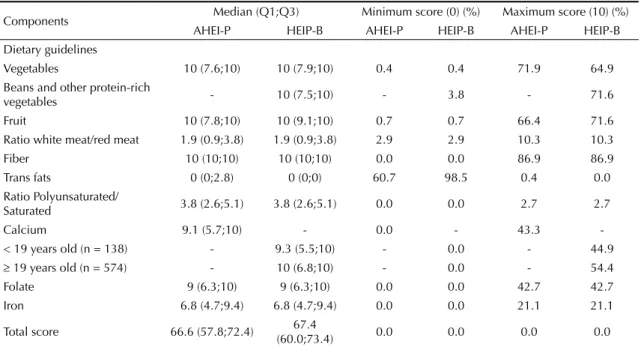
Table 2. Descriptive measures for each component and total scores for the AHEI-P and HEIP-B. Bento Gonçalves and Porto Alegre, Southern Brazil, 2007. (n = 712)
Components Median (Q1;Q3) Minimum score (0) (%) Maximum score (10) (%)
AHEI-P HEIP-B AHEI-P HEIP-B AHEI-P HEIP-B
Dietary guidelines
Vegetables 10 (7.6;10) 10 (7.9;10) 0.4 0.4 71.9 64.9
Beans and other protein-rich
vegetables - 10 (7.5;10) - 3.8 - 71.6
Fruit 10 (7.8;10) 10 (9.1;10) 0.7 0.7 66.4 71.6
Ratio white meat/red meat 1.9 (0.9;3.8) 1.9 (0.9;3.8) 2.9 2.9 10.3 10.3
Fiber 10 (10;10) 10 (10;10) 0.0 0.0 86.9 86.9
Trans fats 0 (0;2.8) 0 (0;0) 60.7 98.5 0.4 0.0
Ratio Polyunsaturated/
Saturated 3.8 (2.6;5.1) 3.8 (2.6;5.1) 0.0 0.0 2.7 2.7
Calcium 9.1 (5.7;10) - 0.0 - 43.3
-< 19 years old (n = 138) - 9.3 (5.5;10) - 0.0 - 44.9
19 years old (n = 574) - 10 (6.8;10) - 0.0 - 54.4
Folate 9 (6.3;10) 9 (6.3;10) 0.0 0.0 42.7 42.7
Iron 6.8 (4.7;9.4) 6.8 (4.7;9.4) 0.0 0.0 21.1 21.1
Total score 66.6 (57.8;72.4) 67.4
(60.0;73.4) 0.0 0.0 0.0 0.0
AHEI-P: Alternate Healthy Eating Index for Pregnancy HEIP-B: Healthy Eating Index for Pregnancy – adapted to Brazil
s I
DK D
JEX G C O T
N H M O
P URFB
VA
AHEI - P r= 0.8 r= 0.6 r= 0.4 r= 0.2 r= 0
L
r= 0.8
HEIP - B r= 0.6 r= 0.4 r= 0.2 r= 0
SI K
N P J E GC
O O T
MA VH F R
B L X J
A: Carbohydrate; B: Protein; C:Total fat; D: Cholesterol; E: Saturated fat; F: Polyunsaturated fat; G: Monounsaturated fat; H: Fiber; I: Vitamin A; J: Vitamin D; K: Vitamin C; L: Niacin; M: Vitamin B1; N: Folate; O: Vitamin B2; P: Pantothenic acid; Q: Vitamin B6; R: Vitamin E; S: Vitamin B12; T: Sodium; U: Calcium; V: Iron; X: Zinc; AHEI-P: Alternate Healthy Eating Index for Pregnancy HEIP-B: Healthy Eating Index for Pregnancy – adapted to Brazil Note: Circle between correlation 0 and 0.2 indicates limit of signifi cant correlations
The median, the 1st and 3rd quartiles and the percentage
of the pregnant women who scored maximum and minimum scores in the indexes and their components are shown in Table 2.
The medians and interquartile intervals (with the excep-tion of “calcium”), and the values of total scores were similar when AHEI-P and HEIP-B were compared. The median for the “calcium” component differed only for pregnant women aged 19 and over (9.1 for AHEI-P and 10 for HEIP-B). The absence of differences between medians in the other components occurred due to the majority of maximum and minimum values attributed being the same.
Based on the fi nal scores of the indexes, a dietary clas-sifi cation was performed which varied according to the dietary index: for AHEI-P and HEIP-B, 65.4% (n = 465) and 62.6% (n = 446) respectively, were in the Needs Improvement category.
HEIP-B showed signifi cant correlation with the nutri-ents under investigation: lower for vitamin B12 (r = 0.26, < 0.001) and higher for folate and potassium (r = 0.78, < 0.001). HEIP-B showed the following correla-tions for nutrients specifi cally recommended for preg-nancy: folate (r = 0.78; p < 0.001), calcium (r = 0.63; p < 0.001) and iron (r = 0.68; p < 0.001).
Nutrients relevant to pregnancy (Figure) showed similar patterns in AHEI-P (left) and HEIP-B (right), with positive correlations above 0.4, except for vitamin B12. There was weak correlation of two nutrients in HEIP-B, but which had high correlation between themselves (vitamins A and B12). A strong correlation was observed between two nutrients (folate and fi ber) and the index, close to the line closest to the center (r = 0.8). All of the correlations were signifi cant, once the variables were located within the circle derived by the line between correlations 0 and 0.2 (Figure).
DISCUSSION
HEIP-B showed good correlations with the nutri-ents being investigated during pregnancy and 62.6% of the pregnant women presented diets that “needs improvement”.
National studies using dietary indexes to assess dietary quality have found that the majority of the population studied “need to improve” their diet,19,b although cut
off points for this classifi cation vary between studies.
One of the reasons for adapting the AHEI-P to the national dietary guidef is that there are differences,
in terms of portions of the food groups, between the American and the Brazilian guide. Moreover, the “beans and other protein-rich vegetables” group was included in the “vegetable” group in the American guide, whereas the Brazilian guidef contained specifi c
recommendations. In a national study, Mota et al
adapted the Health Eating Index to the Brazilian population and included the group of legumes in the same way. 19
Including the “beans” group, a typically Brazilian food, and adopting the portions of the Brazilian guide to the extra 300 kcals needed for pregnancy may have increased the fi nal HEIP-B score.
The number of portions recommended for each group was rounded up to facilitate clinical practice. There was diffi culty with the “beans” group, since the number of portions obtained (1.2 portions) made it diffi cult to apply it in practice, limiting the recommendation to the public.
There are no nutritional and weight gain recommenda-tions specifi c to Brazilian pregnant women. National
authors27 working with pregnant women use, for
example, the Institute of Medicine16 recommendations
to estimate weight gain during pregnancy and to quan-tify the needed nutrients.
In this study, the FPCA technique was chosen to assess correlation between nutrients investigated during pregnancy and the dietary indexes because it has the advantage of showing correlations graphically and simultaneously. Based on this, we can state that these nutrients basically belong to one single cluster, i.e. the variability of each nutrient is captured in a similar way by the AHEI-P and the HEIP-B. Moreover, the HEIP-B showed moderate correlations (r > 0.4) with all nutri-ents, except vitamin B12. The reason this vitamin does not show a good correlation with the index is that few pregnant women consume less than the recommended quantity. Therefore, irrespective of the HEIP-B score, consumption of this vitamin was high.
In a Canadian study carried out by Pick et al,23 the
quality of pregnant women’s diet was assessed using a dietary index. The authors examined intake of nutrients of interest during pregnancy in the women who had what was considered a “good” index (HEI > 80), and observed that 4% reached the recommended level of folate and none consumed the recommended amount of iron. The authors concluded that the index was useful for analyzing whether dietary guidelines are followed, but that it did not capture the uniqueness of the pregnant women’s diet. The index proposed in the study by Pick et al23 did not include any pregnancy-specifi c nutrient.
A limitation of these indexes is that that maximum score for each food group is based only on the minimum number of portions to be consumed, i.e., there is no “penalty” for excessive consumption. One of the reasons for not including penalization of high consumption in the HEIP-B is that there is no consensus on limits for the number of recommended portions in each food groups. However, as excessive weight gain during pregnancy may affect the health of mother and baby, 16,21 further discussion in order to
Recommended intakes adapted to the energy needs of each individual were not used in constructing the HEIP-B, which may be another limitation. Instead we opted for a single recommendation, as in the Brazilian
guide.f However, calculating recommendations based
on energy density may have led to more precise results.
In a revision of dietary indexes, Waijers et al28 indicated
the limitations of using such tools to assess dietary quality: they reported that the indexes may not deal adequately with correlation in intake of various dietary factors and with the existence of interactions between
nutrients.28 Other authors describe how, although
limitations exist, the indexes manage to assess overall diet, characterizing dietary patterns, in contrast to the analysis of nutrients in isolation.4,7,17,18
Another limitation of the study was using the FFQ as an assessment method of dietary consumption, as it contains a limited number of foods in comparison with dietary history.28 Moreover, as it is a semi-quantitative
questionnaire, the FFQ used may have contributed to overestimating the quantities of each of the investigated food items consumed.6 The validation of the FFQ used
was for nutrients and not food groups, which may have had some infl uence in the construction of the dietary index. However, some authors have used the FFQ to calculate this type of index.8,26
In spite of these limitations, dietary indexes are instru-ments of recognized usefulness in assessing dietary quality, especially in the primary health care fi eld. These instruments should be adapted to national guidelines and to the population under study, so that cultural realities are considered. When comparing these indexes, dietary quality was found to be better when assessed by the HEIP-B.
In this study, the dietary quality of the majority of preg-nant women was classifi ed as within the “needs improve-ment” cut off point, demonstrating the need to work more specifi cally in the dietary education of this group.
1. Basiotis PP, Carlson A, Gerrior SA, Juan WY, Lino M. The healthy eating index: 1999-2000. Washington: US Department of Agriculture, Center for Nutrition Policy and Promotion; 2002.
2. Bertin RL, Parisenti J, Di Pietro PF, Vasconcelos FA. Métodos de avaliação do consumo alimentar de gestantes: uma revisão. Rev Bras Saude Matern Infant. 2006;6(4):383-90. DOI:10.1590/S1519-38292006000400004 3. Canuto R, Camey S, Gigante DP, Menezes AMB,
Olinto MTA. Focused Principal Component Analysis: a graphical method for exploring dietary patterns. Cad Saude Publica. 2010;26(11):2149-56. DOI:10.1590/S0102-311X2010001100016 4. Cervato AM, Vieira VL. Índices dietéticos
na avaliação da qualidade global da dieta. Rev Nutr. 2003;16(3):347-55. DOI:10.1590/S1415-52732003000300012 5. Falissard B. Focused Principal Component Analysis:
Looking at a Correlation Matrix with a Particular Interest in a Given Variable. J Comput Graph Stat. 1999;8(4):906-12.
6. Giacomello A, Schmidt MI, Nunes MAA, Duncan BB, Soares RM, Manzolli P, et al. Validação relativa de Questionário de Frequência Alimentar em gestantes usuárias de serviços do Sistema Único de Saúde em dois municípios no Rio Grande do Sul, Brasil. Rev Bras Saude Mater Infant. 2008;8(4):445-54. DOI: 10.1590/S1519-38292008000400010 7. Hu FB. Dietary pattern analysis: a new
direction in nutritional epidemiology. Curr. Opin. Lipidol. 2002;13(1):3-9. DOI:10.1097/00041433-200202000-00002 8. Kant AK, Schatzkin A, Graubard BI, Schairer C.
A prospective study of diet quality and mortality in women. JAMA. 2000;283(16):2109-15. DOI:10.1001/jama.283.16.2109
9. Kant AK. Dietary patterns and health outcomes. J Am Diet Assoc. 2004;104(4):615-35. DOI:10.1016/j.jada.2004.01.010
10. Kennedy ET, Ohls J, Carlson S, Fleming K. The Healthy Eating Index: design and applications. J Am Diet Assoc. 1995;95(10):1103-8. DOI:10.1016/S0002-8223(95)00300-2
11. Kourlaba G, Panagiotakos DB. Dietary quality indices and human health: a review. Maturitas. 2009;62(1):1-8. DOI:10.1016/j.maturitas.2002009;62(1):1-8.11.021
12. Institute of Medicine. Nutrition During Pregnancy. Part I: weight gain; Part II: nutrient supplements. Washington: National Academy Press. 1990. Available from: http://www.nap.edu/catalog.php?record_ id=1451#toc
13. Institute of Medicine. Dietary Reference Intakes for Thiamin, Ribofl avin, Niacin, Vitamin B6, Folate, Vitamin B12, Pantothenic Acid, Biotin, and Choline: a report of the Standing Committee on the Scientifi c Evaluation of Dietary Reference Intakes and its Panel on Folate, Other B Vitamins, and Choline and Subcommitee on Upper Reference Levels of Nutrients, Food and Nutrition Board. Washington; 1998 [cited 2011 Jun 2]. Available from: http://www.nap.edu/ openbook.php?isbn=0309065542
14. Institute of Medicine. Dietary Reference Intakes for Vitamin A, Vitamin K, Arsenic, Boron, Chromium, Copper, Iodine, Iron, Manganese, Molybdenum, Nickel, Silicon, Vanadium, and Zinc: A Report of the Panel on Micronutrients, Subcommittees on Upper Reference Levels of Nutrients and of Interpretation and Uses of Dietary Reference Intakes, and the Standing Committee on the Scientifi c Evaluation of Dietary Reference Intakes. Washington; 2001. [cited 2011 Jun 2]. Available from: http://www.nap. edu/openbook.php?isbn=0309072794
15. Institute of Medicine. Standing Committee on the Scientifi c Evaluation of Dietary Reference Intakes, Food and Nutrition Board. DRI: Dietary Reference Intakes for Calcium, Phosphorus, Magnesium, Vitamin D, and Fluoride. Washington; 1997 [cited 2011 Jun 2]. Available from: http://www.nap.edu/openbook. php?record_id=5776
16. Institute of Medicine. Weight Gain During Pregnancy: reexamining the guidelines. Washington, DC: The National Academies Press. 2009. [cited 2011 Jun 2]. Available from: http://www.cbsnews.com/htdocs/ pdf/052809_pregnancy.pdf
17. Mertz W. Foods and nutrients. J Am Diet Assoc. 1984;84(7):769-70.
18. Moeller SM, Reedy J, Millen AE, Dixon LB, Newby PK, Tucker KL, et al. Dietary patterns: challenges and opportunities in dietary patterns research an Experimental Biology workshop, April 1, 2006. J Am Diet Assoc. 2007;107(7):1233-9. DOI:10.1016/j.jada.2007.03.014
19. Mota JF, Rinaldi AEM, Pereira AF, Maestá N, Scarpin MM, Burini RC. Adaptação do índice de alimentação saudável ao guia alimentar da população brasileira. Rev Nutr. 2008;21(5):545-52. DOI:10.1590/S1415-52732008000500007
20. Nunes MA, Ferri CP, Manzolli P, Soares RM, Drehmer M, Buss C, et al. Nutrition, Mental Health and Violence: from pregnancy to postpartum Cohort of women attending primary care units in Southern Brazil - ECCAGE Study. BMC Psychiatry. 2010;10:66. DOI:10.1186/1471-244X-10-66
21. Olafsdottir AS, Skuladottir GV, Thorsdottir I, Hauksson A, Steingrimsdottir L. Maternal diet in
early and late pregnancy in relation to weight gain. Int J Obes (Lond). 2006;30(3):492-9. DOI:10.1038/sj.ijo.0803184
22. Philippi ST. Tabela de Composição de Alimentos: suporte para decisão nutricional. 2 ed. Brasília: Editora Gráfi ca Coronário; 2002.
23. Pick M E, Edwards M, Moreau D, Ryan EA. Assessment of diet quality in pregnant women using the Healthy Eating Index. J Am Diet Assoc. 2005;105(2):240-6. DOI:10.1016/j.jada.2004.11.028
24. Pinheiro ABV, Lacerda EMA, Benzecky EG, Gomes MCS, Costa VM. Tabela para avaliação de consumo alimentar em medidas caseiras. 5.ed. São Paulo: Atheneu; 2004.
25. Rifas-Shiman SL, Rich-Edwards JW, Kleinman KP, Oken E, Gillman MW. Dietary quality during pregnancy varies by maternal characteristics in Project Viva: a US cohort. J Am Diet Assoc. 2009;109(6):1004-11. DOI:10.1016/j.jada.2009.03.001
26 Shatenstein B, Nadon S, Godin C, Ferland G. Diet quality of Montreal-area adults needs improvement: estimates from a self-administered food frequency questionnaire furnishing a dietary indicator score. J Am Diet Assoc. 2005;105(8):1251-60. DOI:10.1016/j.jada.2005.05.008
27. Vitolo MR. Nutrição: da gestação ao envelhecimento. Rio de Janeiro: Rubio; 2008.
28. Waijers PMCM, Feskens EJM, Ocké MC. A critical review of predefi ned diet quality scores. Br J Nutr. 2007;97(2):219-31. DOI:10.1017/S0007114507250421