Use of medicines and other products
for therapeutic purposes among
children in Brazil
Tatiane da Silva Dal PizzolI, Noemia Urruth Leão TavaresII, Andréa Dâmaso BertoldiIII, Mareni
Rocha FariasIV, Paulo Sergio Dourado ArraisV, Luiz Roberto RamosVI, Maria Auxiliadora OliveiraVII,
Vera Lucia LuizaVII, Sotero Serrate MengueVIII
I Departamento de Produção e Controle de Medicamentos. Faculdade de Farmácia. Universidade Federal do Rio Grande do Sul. Porto Alegre, RS, Brasil
II Departamento de Farmácia. Faculdade de Ciências da Saúde. Universidade de Brasília. Brasília, DF, Brasil III Departamento de Medicina Social. Faculdade de Medicina. Universidade Federal de Pelotas. Pelotas, RS, Brasil IV Departamento de Ciências Farmacêuticas, Centro de Ciências da Saúde. Universidade Federal de Santa
Catarina. Florianópolis, SC, Brasil
V Departamento de Farmácia. Faculdade de Farmácia, Odontologia e Enfermagem. Universidade Federal do Ceará. Fortaleza, CE, Brasil
VI Departamento de Medicina Preventiva. Escola Paulista de Medicina. Universidade Federal de São Paulo. São Paulo, SP, Brasil
VII Departamento de Política de Medicamentos e Assistência Farmacêutica - Escola Nacional de Saúde Pública Sérgio Arouca. Fundação Oswaldo Cruz. Rio de Janeiro, RJ, Brasil
VIII Programa de Pós-Graduação em Epidemiologia. Universidade Federal do Rio Grande do Sul. Porto Alegre, RS, Brasil
ABSTRACT
OBJECTIVE: To assess the prevalence of the use of medicines and other products for therapeutic purposes in the Brazilian pediatric population and test whether demographic, socioeconomic and health factors are associated with use.
METHODS: A cross-sectional population-based study (National Survey on Access, Use and Promotion of Rational Use of Medicines – PNAUM), including 7,528 children aged 12 or younger, living in urban areas in Brazil. Medicine use to treat chronic or acute diseases was reported by the primary caregiver present at the household interview. Associations between independent variables and medicine use were investigated by Poisson regression.
RESULTS: he overall prevalence of medicine use was 30.7% (95%CI 28.3–33.1). he prevalence of medicine use for chronic diseases was 5.6% (95%CI 4.7–6.7) and for acute conditions, 27.1% (95%CI 24.8–29.4). he factors signiicantly associated with overall use were ive years old or under, living in the Northeast region, having health insurance and using health services in the last 12 months (emergency visits and hospitalizations). he following were associated with drug use for chronic diseases: age ≥ 2 years, Southeast and South regions, and use of health services. For drug use in treating acute conditions, the following associated factors were identiied: ≤ 5 years, North, Northeast or Midwest regions, health insurance, and one or more emergency visits. he most commonly used drugs among children under two years of age were paracetamol, ascorbic acid, and dipyrone; for children aged two years or over they were dipyrone, paracetamol, and amoxicillin.
CONCLUSIONS: he use of medicine by children is considerable, especially in treating acute medical conditions. Children using drugs for chronic diseases have a diferent demographic proile from those using drugs for acute conditions in relation to gender, age, and geographic region. DESCRIPTORS: Child. Child, Preschool. Drug Utilization. Socioeconomic Factors. Health Surveys. Correspondence:
Tatiane da Silva Dal Pizzol Av. Ipiranga, 2752 sala 203 90610-000 Porto Alegre, RS, Brasil E-mail: [email protected]
Received: 13 Jan 2015 Approved: 25 Feb 2016
How to cite: da Silva Dal Pizzol T, Tavares NUL, Bertoldi AD, Farias MR, Arrais PSD, Ramos LR, et al. Use of medicines and other products for therapeutic purposes among children in Brazil. Rev Saude Publica. 2016;50(suppl 2):12s.
Copyright: This is an open-access article distributed under the terms of the Creative Commons Attribution License, which permits unrestricted use, distribution, and reproduction in any medium, provided that the original author and source are credited.
INTRODUCTION
Drug use in children difers from drug use in adults for various reasons, especially lower prevalence of chronic diseases and higher degree of uncertainty in prescription and use. he uncertainty regarding the efectiveness and safety of medicines available for this population subgroup contributes to children being considered a risk group. Most drugs used in children have only been tested in adults, and it is observed a lack of products available in age-appropriate pharmaceutical formulations and dosage forms, as well as of studies on long-term efectiveness and safety6.
In 2007, the World Health Organization launched the campaign “Make Medicines Child Size” and published the First List of Essential Medicines for Children, aiming to raise awareness and speed up action to improve the availability of and access to medicines that are safe and suitable for children. Regulatory measures and measures to foster the research, development, and registration of drugs for use in children have occurred in the United States (US) and the European Union. Organizations like UNITAID, Drugs for Neglected Diseases initiative (DNDi) and Medicines Patent Pool (MPP) have stimulated the development and provision of appropriate medicines for children, such as for HIV and neglected diseases13.
hese initiatives highlight the need to develop better medicines for children, an area that is considered neglected by various international organizations. In this regard, information on the prevalence of drug use, user characteristics and medicines used by the pediatric population are important to evaluate the appropriateness of use and estimate therapeutic needs, to improve pediatric therapeutics3,17.
In this context, community-based epidemiological studies ofer a unique opportunity to proile drug use. Such studies provide more accurate estimates and enable a greater generalization of indings compared to studies based on samples of health service users, disease-speciic carriers, or on data collected for other purposes (prescriptions or dispensing data, for example)1.
In Brazil, no study with a representative sample of the country has been carried out, and population-based studies have been limited to samples of children living in municipalities in the South, Southeast, and Northeast Regions8,19,20,23. In these studies, prevalence of
use of at least one medicine ranged around 50.0%, with variations according to the age group investigated.
he aim of this study was to estimate the prevalence of the use of drugs and other products for therapeutic purposes in the Brazilian pediatric population and test whether demographic, socioeconomic and health factors are associated with use.
METHODS
The data in this analysis are part of the National Survey on Access, Use and Promotion of Rational Use of Medicines (PNAUM), a cross-sectional population-based study. The study’s population was composed of individuals aged 12 or younger living in permanent private households in urban areas within the five Brazilian regions. Specific questionnaires were answered by the primary caregiver present at the residence at the time of the interview.
he sampling plan was complex and resulted in a representative sample of the Brazilian population residing in urban areas. he composition of the sample, sampling procedures and other methodological details of PNAUM are available in a previous publication18.
were formulated for chronic respiratory diseases and diabetes, since they are diseases with high prevalence among children or that require complex administration of medicines. Caregivers were asked whether the child had a medical diagnosis and indication for the use any kind of drug to treat the related chronic disease and whether such medicines was being used.
For acute conditions (occasional health problems), speciic questions were asked (“In the past 15 days, did <<child’s name>> use any medicine for infection/sleeping or nervous symptoms/stomach or bowel problems/fever/pain/cold or lu/diarrhea and vomiting?”). he use of vitamins was also investigated with the question “In the last 15 days, did <<child’s name>> use any vitamin, mineral supplement, appetite stimulant or tonic?” At the end of this set of questions, the respondent was asked about the use of drugs in the previous 15 days for any other health reasons. hey were asked to provide, whenever possible, the packages or prescriptions of used medicines.
Outcomes to investigate prevalence in the pediatric sample were defined as: 1) prevalence of overall drug use (use of at least one drug, regardless of reason for use); 2) prevalence of drug use for chronic diseases (use of at least one drug to treat chronic disease); 3) prevalence of drug use for acute diseases or conditions (use of at least one drug to treat acute disease or health event). The outcome variables were categorized as yes/no. Prevalence calculation included herbal medicines and other products for therapeutic purposes mentioned by respondents (dietary supplements, foods, plants, and homeopathic products).
The following demographic and socioeconomic characteristics were analyzed: gender ( female; male), age (< 2 years; 2-5 years; 6-12 years), skin color (white; non-white), economic classification according to the Economic Classification Criterion developed by the Brazilian Association of Survey Companies (CCEB 2013/ABEP) (A/B, C, D/E)a
and Brazilian region (North, Northeast, Southeast, South, Midwest). Medical variables were: health insurance (yes; no); number of emergency visits in the last 12 months (none; one; two or more); and number of hospitalizations in the last 12 months (none; one; two or more).
he age group investigated was based on the classiication adopted by the Food and Drug Administration (FDA) for clinical investigation of medicines for pediatricsb, more commonly
used in previous studies, to facilitate comparison of results. We chose to analyze children aged 12 and under, as this is an age group in which drug use it still determined and directly supervised by parents or caregivers.
Based on the names of the products or medicines mentioned by respondents, the drugs were identiied in he Brazillian Health Regulatory Agency (ANVISA) drug lists and classiied according to the pharmacological agent(s) present in their composition. Drugs used in combination (containing two or more pharmacological agents in their composition) were considered just once.
In calculating prevalence of drug use, the total number of children in the weighted sample was used as the denominator, with 95% conidence intervals (95%CI). Likewise, estimates of prevalence of drug use with frequency equal to or above 0.5% also used as the denominator the total number of children present in the weighted sample, stratiied by age (< 2 years; 2-5 years; 6-12 years). For the description of the most commonly used drugs, the percentage denominator was the total amount of drugs in each age group.
Pearson’s Chi-squared test was used for the bivariate comparison of percentages, considering p < 0.05 values as signiicant.
Associations between independent variables and outcomes were estimated by prevalence ratio (PR), with 95%CI. Poisson regression models were developed to estimate crude PR and PR adjusted for independent variables. In the first stage, independent variables a Associação Brasileira de
Empresas de Pesquisa. Critério de Classificação Econômica Brasil 2013. São Paulo (SP): ABEP; 2013 [cited 2016 Feb 29]. Available from: http://www.abep. org/criterio-brasil
were analyzed individually. Variables showing statistical significance, defined as p < 0.20 in univariate analyses were selected for the second stage, in which all variables were introduced in the multiple model. At this stage, variables showing p > 0.05 were removed from the model one by one, with “backward” selection of variables. Statistical significance of the prevalence ratios obtained in the Poisson regression models was assessed by the Wald test.
Data were stored in SPSS software for Windows version 18.0 (SPSS Inc., Chicago, IL, USA). Descriptive analyses were executed in SPSS and the Poisson regression models were executed in Stata software version 12.0 (Stata Corp LP, College Station, TX, USA), using the appropriate set of svy commands for the analysis of complex samples and ensuring the necessary weighting, considering the sample design.
The project was approved by the Brazilian National Commission for Research Ethics (CONEP – Opinion 398,131, September 16, 2013). Participants were only interviewed following permission by means of an informed consent signed by the researcher and the participant.
RESULTS
he children’s characteristics are shown in Table 1. he study population is comparable to that of the 2010 Census in relation to gender (50.9% boys and 49.1% girls), age (< 2 years: 13.9%; 2-5 years: 29.0%; 6-12 years: 57.1%) and Brazilian region (North: 10.9%; Northeast: 30.7%; Southeast: 37.9%; South: 12.9%; and Midwest: 6.7%)c.
he questionnaires were answered by the child’s mother in 76.1% of cases, followed by grandparent (9.6%) and father (8.6%).
Prevalence of chronic diseases was 9.9% (95%CI 8.6–11.3). Diabetes was reported by 0.4% of the sample (95%CI 0.2–0.8%) and chronic lung diseases by 5.2% (95%CI 4.3–6.4). Prevalence of acute conditions treated in the 15 days prior to the interview was 27.4% (95%CI 25.2–29.8). he most common were fever (8.4%; 95%CI 7.4–9.5), cold or lu (7.3%; 95%CI 6.2–8.5), pain (5.8%; 95%CI 4.8–7.0%) and infection (4.6%; 95%CI 3.8–5.5). he use of vitamins or mineral supplements was reported by 6.1% (95%CI 5.3–7.1).
Table 1 shows the prevalence of overall use of drugs and other products for therapeutic purposes (30.7%). Use was highest among children aged five or under, resident in the Northeast Region, with health insurance and who had used health services in the previous 12 months (one or more emergency visits and one or more hospitalizations). In the final model, these factors remained positively associated with the outcome, with statistical significance.
Table 2 shows the prevalence of drugs used to treat chronic (5.6%) and acute diseases (27.1%). Two years old or over, resident in the Southeast or South Regions, one or more emergency visits, and one or more hospitalizations remained positively associated with the use of medicines for chronic diseases. The positive association between health insurance and the outcome failed to show any statistical significance when adjusted for other variables.
The following factors were associated with the use of medicines to treat acute conditions in the crude analysis: five years old or younger, resident in the North, Northeast, and Midwest Regions, health insurance, and use of health services. In the multivariate analysis, these factors remained positively associated with the outcome and statistically significant, except for the number of hospitalizations. Belonging to economic classes A/B was negatively associated with the outcome, but not sustained after adjustment for covariates.
Table 1. Sample characteristics and overall prevalence of medicine use, according to demographic, socioeconomic and medical variablesa.
(N = 7,528)
Variable Sample Overall medicine use
% Prevalence 95%CI pb PR
crude 95%CI PRadjusted
c 95%CI
Overall 100 30.7 28.3–33.1 - - - -
-Gender 0.27 - - -
-Female 50.3 29.5 26.6–32.5 1 - 1
-Male 49.7 31.9 28.6–35.3 1.08 0.94–1.24 1.08 0.94–1.24
Age (years) < 0.0001
< 2 13.5 48.0 44.8–51.2 2.01 1.77–2.29 1.78 1.58–2.00
2-5 26.9 37.1 34.4–39.9 1.56 1.36–1.78 1.33 1.17–1.52
6-12 59.6 23.8 20.9–27.0 1 1
Skin color 0.95
White 46.7 30.8 27.9–33.8 1 - 1
-Non-white 53.3 30.9 28.0–33.9 1.00 0.90–1.12 1.00 0.90–1.12
Economic
classificationd 0.2
A/B 16.8 27.0 22.9–31.4 1 - 1
-C 56.2 31.5 28.7–34.5 1.17 0.99–1.38 1.17 0.99–1.38
D/E 27.0 31.1 27.3–35.2 1.15 0.96–1.39 1.09 0.91–1.31
Brazilian Region < 0.0001
North 9.9 32.5 25.5–40.3 1.24 0.94–1.63 1.22 0.97–1.53
Northeast 26.7 38.4 34.9–42.0 1.47 1.23–1.74 1.34 1.14–1.57
Southeast 41.2 26.9 22.8–31.5 1.03 0.83–1.28 0.99 0.81–1.20
South 13.8 26.2 22.5–30.2 1 - 1
-Midwest 8.4 29.7 25.7–34.0 1.13 0.92–1.39 1.04 0.86–1.26
Health Insurance < 0.0001
Yes 19.3 37.9 33.0–43.0 1.31 1.13–1.51 1.28 1.11–1.47
No 80.7 28.9 26.5–31.05 1 - 1
-No. of emergency
visitse < 0.0001
None 84.1 24.8 22.7–27.0 1 - 1
-Two 9.5 51.5 44.3-58.7 2.08 1.76–2.45 1.79 1.52–2.11
Two or more 6.4 75.9 70.6-80.4 3.06 2.75–3.41 2.48 2.18–2.81
No. of
hospitalizationse < 0.0001
None 95.1 29.0 26.7-31.5 1 - 1
-One 4.0 59.8 50.6-68.3 2.06 1.75–2.43 1.31 1.10–1.56
Two or more 0.9 85.4 74.6-92.1 2.94 2.58–3.34 1.37 1.19–1.58
a Percentages weighted by the sampling weights. b Pearson’s Chi-Squared test.
c Poisson Regression.
Table 2. Prevalence of medicine use for chronic diseases and acute conditions, according to demographic, socioeconomic and medical
variablesa. (N = 7,528)
Variable
Medicine use for chronic diseases Medicine use for acute conditions
Prevalence
(95%CI) p
b PRcrude
(95%CI)c
PRadjusted (95%CI)c
Prevalence
(95%CI) p
b PRcrude
(95%CI)c
PRadjusted (95%CI)c
Overall 5.6 (4.7–6.7) 27.1 (24.8–29.4)
Gender 0.174 0.302
Female 4.9 (3.7–6.4) 1 1 26.1 (23.5–28.9) 1 1
Male 6.4 (4.9–8.3) 1.32 (0.88–1.98) 1.33 (0.91–1.94) 28.0 (25.0–31.3) 1.07 (0.94–1.23) 1.07 (0.94–1.23)
Age (years) 0.003 < 0.001
< 2 3.7 (2.8–4.8) 1 1 46.5 (43.3–49.7) 2.32 (2.02–2.67) 2.09 (1.83–2.38)
2-5 7.5 (6.0–9.3) 2.05 (1.51–2.80) 2.14 (1.56–2.94) 32.9 (30.0–35.8) 1.64 (1.43–1.89) 1.44 (1.25–1.66)
6-12 5.2 (4.1–6.7) 1.43 (1.02–2.01) 1.88 (1.35–2.61) 20.0 (17.4–22.9) 1 1
Skin color 0.104 0.779
White 6.4 (5.1–8.1) 1.30 (0.95–1.78) 1.10 (0.76–1.60) 27.0 (24.2–29.9) 0.98 (0.87–1.11) 0.98 (0.87–1.11)
Non-white 5.0 (3.9–6.3) 1 1 27.5 (24.7–30.4) 1
Economic
classificationd 0.537 0.097
A/B 5.6 (3.7–8.4) 1.18 (0.68–2.06) 1.18 (0.68–2.06) 22.7 (18.9–27.0) 0.80 (0.65–0.98) 0.87 (0.70–1.08)
C 6.0 (4.8–7.5) 1.26 (0.81–1.97) 1.26 (0.81–1.97) 27.6 (24.6–30.6) 0.97 (0.83–1.13) 1.05 (0.91–1.20)
D/E 4.8 (3.3–6.9) 1 1 28.5 (24.8–32.5) 1 1
Brazilian Region < 0.001 < 0.001
North 2.6 (1.6–4.0) 1 1 31.0 (24.3–38.6) 1.53 (1.14–2.06) 1.52 (1.19–1.96)
Northeast 4.3 (3.1–6.0) 1.69 (0.97–2.97) 1.56 (0.92–2.63) 35.5 (32.2–39.0) 1.76 (1.43–2.17) 1.61 (1.33–1.95)
Southeast 6.8 (5.0–9.2) 2.66 (1.54–4.61) 2.93 (1.76–4.88) 22.8 (19.1–27.0) 1.13 (0.87–1.46) 1.10 (0.88–1.38)
South 7.7 (6.3–9.5) 3.02 (1.83–4.98) 3.56 (2.21–5.73) 20.2 (16.7–24.2) 1 1
Midwest 4.4 (2.6–6.0) 1.55 (0.83–2.87) 1.45 (0.83–2.53) 27.5 (23.5–32.0) 1.36 (1.07–1.73) 1.26 (1.01–1.57)
Health Insurance 0.021 0.007
Yes 8.4 (5.6–12.2) 1.68 (1.08–2.61) 1.28 (0.86–1.91) 32.2 (27.9–36.9) 1.25 (1.07–1.46) 1.26 (1.08–1.48)
No 5.0 (4.1–6.0) 1 1 25.8 (23.4–28.3) 1 1
No. of emergency
visitse < 0.001 < 0.001
None 4.0 (3.3–5.0) 1 1 22.2 (20.1–24.3) 1 1
Two 7.5 (4.9–11.3) 1.86 (1.17–2.94) 1.55 (0.89–2.68) 45.2 (38.5–52.1) 2.04 (1.71–2.44) 1.80 (1.53–2.12)
Two or more 22.2 (16.2–29.7) 5.51 (3.82–7.93) 4.39 (2.62–7.34) 64.2 (58.0–70.1) 2.90 (2.56–3.27) 2.42 (2.12–2.78)
No. of hospitalizationse < 0.001 < 0.001
None 4.7 (3.8–5.7) 1 1 26.1 (23.9–28.5) 1 1
One 17.8 (11.3–26.9) 3.81 (2.30–6.28) 2.84 (1.50–5.38) 46.7 (38.0–55.7) 1.79 (1.45–2.20) 1.12 (0.92–1.36)
Two or more 44.3 (27.8–62.1) 9.46
(6.13–14.61) 3.84 (2.29–6.43) 55.9 (37.8–72.6) 2.14 (1.54–2.97) 0.98 (0.70–1.37) a Percentages weighted by the sampling weights.
b Pearson’s Chi-Squared test. c Poisson Regression.
Of the total number of products or drugs reported (5,185), 91.4% (95%CI 89.9–92.6) corresponded to medicines, 1.7% (95%CI 1.3–2.4) to dietary supplements (low-dose vitamin combinations), 1.2% (95%CI 0.9–1.7) to herbal medicines, 1.1% (95%CI 0.7–1.9) to plants or teas, 0.5% (95%CI 0.3–0.8) to food (honey compounds), and 0.1% (95%CI 0.0–0.7) to homeopathic medicines. The name of 3.9% (95%CI 3.0–5.1) of the products was not identified.
Table 3 shows the prevalence of medicines most used by Brazilian children (equal to or above 0.5%). Considering the total sample, the highest prevalence in drug use was observed for dipyrone (5.1%; 95%CI 4.3–6.1), paracetamol (4.3%; 95%CI 3.6–5.1), and amoxicillin (2.7, 95%CI 2.2–3.4).
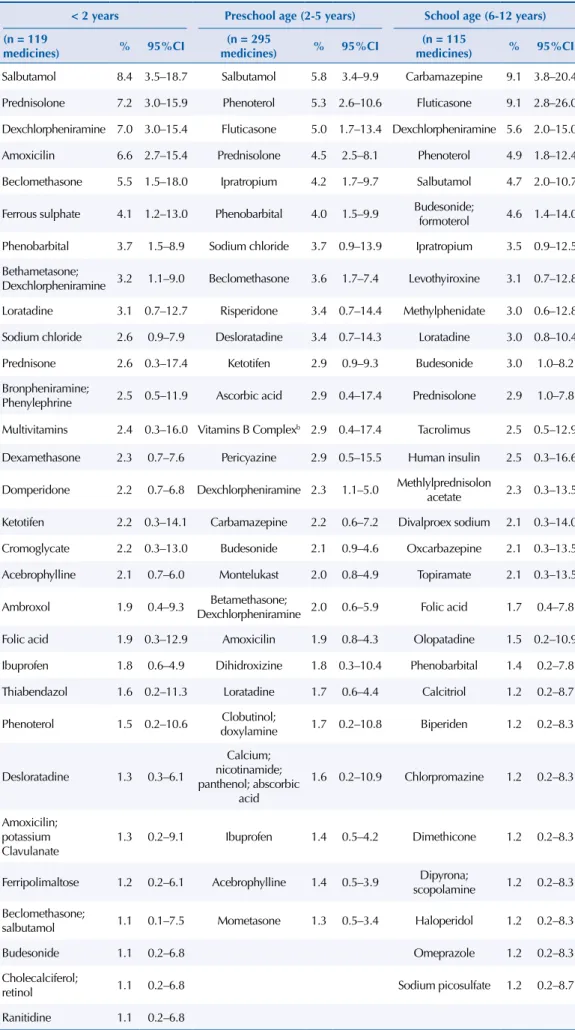
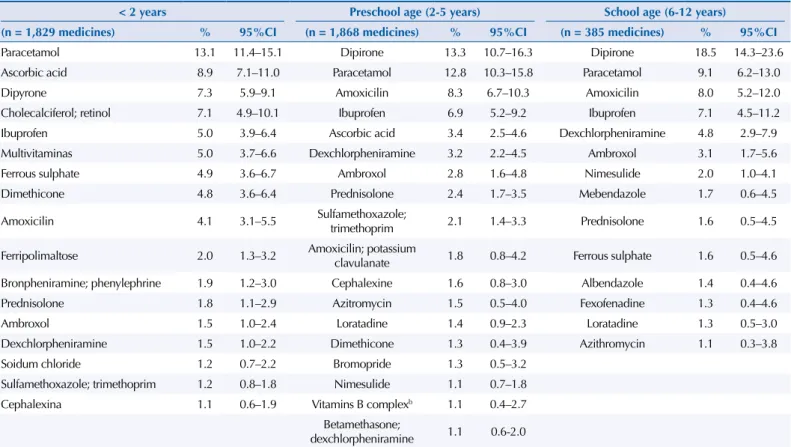
Tables 4 and 5 show, for each age group, the drugs reported in treating chronic and acute diseases, respectively. Prominent among the total number of drugs to treat chronic diseases were those acting on the respiratory system (salbutamol, dexchlorpheniramine, luticasone, and phenoterol), in all age groups (Table 4). Painkillers were the most cited drugs for treating acute conditions (Table 5).
Table 3. Prevalence of most often used medicines (prevalence of use ≥ 0.5%) by children, by age
groupa. (N = 7,528)
Drugb
< 2 years (n = 2,302)
2-5 years (n = 3,671)
6-12 years (n = 1,555)
Total (n = 7,528)
Prevalence 95%CI Prevalence 95%CI Prevalence 95%CI Prevalence 95%CI
Dypirone 5.7 4.5–7.2 6.2 4.9–7.7 4.6 3.4–6.1 5.1 4.3–6.1
Paracetamol 10.1 8.6–11.8 5.9 4.6–7.5 2.2 1.5–3.2 4.3 3.6–5.1
Amoxicilin 3.4 2.6–4.6 4.0 3.2–5.0 2.0 1.3–3.1 2.7 2.2–3.4
Ibuprofen 3.9 3.0–5.0 3.3 2.5–4.5 1.7 1.0–2.8 2.4 1.9–3.1
Ascorbic acid 6.9 5.5–8.6 1.9 1.3–2.9 0.3 0.1–0.7 1.6 1.3–2.0
Dexchlorpheniramine 1.5 1.0–2.2 1.7 1.2–2.4 1.6 0.9–2.5 1.6 1.2–2.2
Ambroxol 1.3 0.8–2.0 1.3 0.8–2.3 0.8 0.4–1.4 1.0 0.7–1.4
Prednisolone 1.7 1.1–2.8 1.6 1.2–2.2 0.6 0.3–1.3 1.0 0.7–1.4
Ferrous sulphate 4.0 3.0–5.5 0.4 0.2–0.7 0.4 0.1–1.1 0.9 0.6–1.3
Cholecalciferol; retinol 5.7 3.9–8.3 0.2 0.1–0.6 0 0.0–0.0 0.8 0.6–1.2
Multivitamins 4.0 3.0–5.3 0.4 0.2–0.6 0.1 0.0–0.3 0.7 0.5–0.9
Dimethicone 3.7 2.8–5.1 0.6 0.2–1.8 0.1 0.0–0.6 0.7 0.5–1.1
Loratadine 0.6 0.3–1.1 0.9 0.6–1.4 0.6 0.3–1.2 0.6 0.4–1.0
Fluticasone 0 0.0–0.3 0.7 0.2–1.8 0.7 0.3–2.0 0.6 0.2–1.6
Sulfamethoxazol;
trimethropim 0.9 0.6–1.4 1.0 0.7–1.5 0.2 0.0–0.6 0.5 0.3–0.7
Salbutamol 0.7 0.4–1.4 0.9 0.6–1.3 0.3 0.1–0.9 0.5 0.3–0.8
Nimesulide 0.4 0.2–0.8 0.5 0.3–0.9 0.5 0.2–1.0 0.5 0.3–0.8
Cephalexin 0.9 0.6–1.5 0.8 0.4–1.5 0.2 0.1–0.7 0.5 0.3–0.8
Amoxicilin; potassium
clavulanate 0.4 0.2–1.1 0.9 0.4–2.0 0.2 0.1–1.0 0.5 0.2–0.9
Phenoterol 0.4 0.2–1.0 0.7 0.3–1.4 0.4 0.2–1.1 0.5 0.3–0.9
a Percentages weighted by the sampling weights.
Table 4. Most used medicines (frequency > 1.0%) for chronic diseases, by age groupa.
< 2 years Preschool age (2-5 years) School age (6-12 years)
(n = 119
medicines) % 95%CI
(n = 295
medicines) % 95%CI
(n = 115
medicines) % 95%CI
Salbutamol 8.4 3.5–18.7 Salbutamol 5.8 3.4–9.9 Carbamazepine 9.1 3.8–20.4
Prednisolone 7.2 3.0–15.9 Phenoterol 5.3 2.6–10.6 Fluticasone 9.1 2.8–26.0
Dexchlorpheniramine 7.0 3.0–15.4 Fluticasone 5.0 1.7–13.4 Dexchlorpheniramine 5.6 2.0–15.0
Amoxicilin 6.6 2.7–15.4 Prednisolone 4.5 2.5–8.1 Phenoterol 4.9 1.8–12.4
Beclomethasone 5.5 1.5–18.0 Ipratropium 4.2 1.7–9.7 Salbutamol 4.7 2.0–10.7
Ferrous sulphate 4.1 1.2–13.0 Phenobarbital 4.0 1.5–9.9 Budesonide;
formoterol 4.6 1.4–14.0
Phenobarbital 3.7 1.5–8.9 Sodium chloride 3.7 0.9–13.9 Ipratropium 3.5 0.9–12.5
Bethametasone;
Dexchlorpheniramine 3.2 1.1–9.0 Beclomethasone 3.6 1.7–7.4 Levothyiroxine 3.1 0.7–12.8
Loratadine 3.1 0.7–12.7 Risperidone 3.4 0.7–14.4 Methylphenidate 3.0 0.6–12.8
Sodium chloride 2.6 0.9–7.9 Desloratadine 3.4 0.7–14.3 Loratadine 3.0 0.8–10.4
Prednisone 2.6 0.3–17.4 Ketotifen 2.9 0.9–9.3 Budesonide 3.0 1.0–8.2
Bronpheniramine;
Phenylephrine 2.5 0.5–11.9 Ascorbic acid 2.9 0.4–17.4 Prednisolone 2.9 1.0–7.8
Multivitamins 2.4 0.3–16.0 Vitamins B Complexb 2.9 0.4–17.4 Tacrolimus 2.5 0.5–12.9
Dexamethasone 2.3 0.7–7.6 Pericyazine 2.9 0.5–15.5 Human insulin 2.5 0.3–16.6
Domperidone 2.2 0.7–6.8 Dexchlorpheniramine 2.3 1.1–5.0 Methlylprednisolon
acetate 2.3 0.3–13.5
Ketotifen 2.2 0.3–14.1 Carbamazepine 2.2 0.6–7.2 Divalproex sodium 2.1 0.3–14.0
Cromoglycate 2.2 0.3–13.0 Budesonide 2.1 0.9–4.6 Oxcarbazepine 2.1 0.3–13.5
Acebrophylline 2.1 0.7–6.0 Montelukast 2.0 0.8–4.9 Topiramate 2.1 0.3–13.5
Ambroxol 1.9 0.4–9.3 Betamethasone;
Dexchlorpheniramine 2.0 0.6–5.9 Folic acid 1.7 0.4–7.8
Folic acid 1.9 0.3–12.9 Amoxicilin 1.9 0.8–4.3 Olopatadine 1.5 0.2–10.9
Ibuprofen 1.8 0.6–4.9 Dihidroxizine 1.8 0.3–10.4 Phenobarbital 1.4 0.2–7.8
Thiabendazol 1.6 0.2–11.3 Loratadine 1.7 0.6–4.4 Calcitriol 1.2 0.2–8.7
Phenoterol 1.5 0.2–10.6 Clobutinol;
doxylamine 1.7 0.2–10.8 Biperiden 1.2 0.2–8.3
Desloratadine 1.3 0.3–6.1
Calcium; nicotinamide; panthenol; abscorbic
acid
1.6 0.2–10.9 Chlorpromazine 1.2 0.2–8.3
Amoxicilin; potassium Clavulanate
1.3 0.2–9.1 Ibuprofen 1.4 0.5–4.2 Dimethicone 1.2 0.2–8.3
Ferripolimaltose 1.2 0.2–6.1 Acebrophylline 1.4 0.5–3.9 Dipyrona;
scopolamine 1.2 0.2–8.3
Beclomethasone;
salbutamol 1.1 0.1–7.5 Mometasone 1.3 0.5–3.4 Haloperidol 1.2 0.2–8.3
Budesonide 1.1 0.2–6.8 Omeprazole 1.2 0.2–8.3
Cholecalciferol;
retinol 1.1 0.2–6.8 Sodium picosulfate 1.2 0.2–8.7
Ranitidine 1.1 0.2–6.8
a Excluding herbal medicines and other products for therapeutic purpose reported by respondents (dietary supplements, food, plants and homeopathic products).
DISCUSSION
his is the irst study of drug use in children with a representative sample of the Brazilian urban population, providing estimates of the prevalence of drug use based on the chronic or acute nature of the treated health problem. he proile of medicine users and the most frequently used pharmacological agents in each phase of childhood are also described in this study.
Prevalence of overall drug use was lower than that observed in studies involving drug use in the previous seven days by children under 12 living in the US (56.0%)25 and individuals aged
zero to 17 in Germany (50.8%)15. However, it was similar to that observed in surveys based
on two-week periods in Spain4 and Norway10. In Spain, surveys with children aged zero to
15 carried out in 1993 and 2003 showed prevalence rates of 36.8% and 34.0%, respectively4.
In Norway, about 25.0% of children up to four years of age used medicines, decreasing to approximately 20.0% among older children10. Compared to studies carried out in Brazil,
prevalence was lower than that observed in Salvador, BA23, Bagé, RS19, and the Jequitinhonha
Valley, MG8.
he signiicant diference between prevalence of drug use to treat chronic diseases and acute conditions was expected, considering that this population group is characterized by predominantly healthy individuals. Although Cox et al.7 (2008) observed an increase in the
prevalence of certain chronic diseases among American children aged ive to 19, children are most commonly afected by acute medical conditions, directly inluencing how drugs are used (continuous versus occasional use).
he lack of diference in prevalence of overall drug use or related to acute events between boys and girls is in accordance with recent studies4,8,19. he decrease in the prevalence of
overall drug use or related to acute conditions as age increases corroborates indings from studies that showed increased use among children under two years old, compared to older
Table 5. Most used medicines (frequency > 1.0%) for acute conditions, by age groupa.
< 2 years Preschool age (2-5 years) School age (6-12 years)
(n = 1,829 medicines) % 95%CI (n = 1,868 medicines) % 95%CI (n = 385 medicines) % 95%CI
Paracetamol 13.1 11.4–15.1 Dipirone 13.3 10.7–16.3 Dipirone 18.5 14.3–23.6
Ascorbic acid 8.9 7.1–11.0 Paracetamol 12.8 10.3–15.8 Paracetamol 9.1 6.2–13.0
Dipyrone 7.3 5.9–9.1 Amoxicilin 8.3 6.7–10.3 Amoxicilin 8.0 5.2–12.0
Cholecalciferol; retinol 7.1 4.9–10.1 Ibuprofen 6.9 5.2–9.2 Ibuprofen 7.1 4.5–11.2
Ibuprofen 5.0 3.9–6.4 Ascorbic acid 3.4 2.5–4.6 Dexchlorpheniramine 4.8 2.9–7.9
Multivitaminas 5.0 3.7–6.6 Dexchlorpheniramine 3.2 2.2–4.5 Ambroxol 3.1 1.7–5.6
Ferrous sulphate 4.9 3.6–6.7 Ambroxol 2.8 1.6–4.8 Nimesulide 2.0 1.0–4.1
Dimethicone 4.8 3.6–6.4 Prednisolone 2.4 1.7–3.5 Mebendazole 1.7 0.6–4.5
Amoxicilin 4.1 3.1–5.5 Sulfamethoxazole;
trimethoprim 2.1 1.4–3.3 Prednisolone 1.6 0.5–4.5
Ferripolimaltose 2.0 1.3–3.2 Amoxicilin; potassium
clavulanate 1.8 0.8–4.2 Ferrous sulphate 1.6 0.5–4.6 Bronpheniramine; phenylephrine 1.9 1.2–3.0 Cephalexine 1.6 0.8–3.0 Albendazole 1.4 0.4–4.6
Prednisolone 1.8 1.1–2.9 Azitromycin 1.5 0.5–4.0 Fexofenadine 1.3 0.4–4.6
Ambroxol 1.5 1.0–2.4 Loratadine 1.4 0.9–2.3 Loratadine 1.3 0.5–3.0
Dexchlorpheniramine 1.5 1.0–2.2 Dimethicone 1.3 0.4–3.9 Azithromycin 1.1 0.3–3.8
Soidum chloride 1.2 0.7–2.2 Bromopride 1.3 0.5–3.2
Sulfamethoxazole; trimethoprim 1.2 0.8–1.8 Nimesulide 1.1 0.7–1.8
Cephalexina 1.1 0.6–1.9 Vitamins B complexb 1.1 0.4–2.7
Betamethasone;
dexchlorpheniramine 1.1 0.6-2.0
children4,12,15,16. hese indings indicate that the irst 24 months of life, when children are
more susceptible to diseases and receive more medical care, either elective or emergency, are followed by a period of low incidence of acute conditions, which lasts approximately until early adolescence. Menarche-related events entail the use of painkillers and contraceptives by adolescent girls, contributing to increased prevalence in this age group2.
The data of this study show that the profile of drug use to treat acute or chronic health conditions differs according to region. The highest prevalence of use for chronic conditions was observed in the South and Southeast Regions, associated with the higher prevalence of chronic respiratory diseases in these regions (data not shown). The use of drugs for acute conditions, higher in the Northeast and North Regions, can be explained by the higher frequency of medicine use for diarrhea and other gastrointestinal disorders, and the higher percentage of self-medication in these regions, according to PNAUM data not shown.
An overall positive association was found between use of health services and use of medicines, in line with data from the 2003 Spanish survey4. Contact with health care services provides
greater chances of children receiving medical prescriptions, which may lead to the routine use of prescription drugs or new posterior use.
Medicines to control pain and fever are among the most used, according to previous studies4,8,19,25. Dipyrone is the most used analgesic and antipyretic, followed by paracetamol
and ibuprofen. his pattern difers from that observed in studies carried out in countries where the use of dipyrone has been banned or restricted, as in the US, where ibuprofen stands out as the second most used painkiller25. Amoxicillin was the most used antimicrobial
in all age groups, with higher prevalence among children aged two to ive (4.0%) and lower prevalence among children aged six to 12 (2.0%). In the US, amoxicillin also ranked as the most widely used antimicrobial, with higher prevalence among children under two years of age (5.1%) and lower prevalence in the six to 11 age group (1.5%)25. With the exception of
dipyrone, whose safety controversies have persisted for years, the other drugs mentioned are considered efective and safe, with good evidence for pediatric use21.
Another fact that draws attention relates to the use of vitamins, alone or in combination. he use of ascorbic acid alone was superior to the use of multivitamins in all age groups investigated, in contrast to the indings of a US study, in which multivitamins were mentioned more often25 (2009). In Salvador, vitamin C was used more often than multivitamins, although
the diference observed in prevalence of use was smaller24.
Prominent among the 10 most mentioned drugs for use in chronic diseases are those indicated for respiratory diseases such as asthma and rhinitis, followed by those with therapeutic use in epilepsy. Among children below two years old it is observed use of various drugs without FDA approval for this age group and no indication in the standard package inserts approved by ANVISAd. Among the most frequently cited drugs with restrictions
for use in this age group are salbutamol, dexchlorpheniramine (alone or combined with betamethasone), loratadine, and brompheniramine + phenylephrine. It should be noted that, in some cases, drugs not approved by the FDA are indicated in Brazilian standard package inserts, as is the case of betamethasone and ambroxold,e. If, on the one hand, the use
of non-approved drugs may represent a potentially inappropriate administration of drugs whose eicacy and safety have not been established, on the other it may relect the lack of therapeutic options to treat health conditions prevalent in children, such as asthma, rhinitis, and acute or chronic coughing, among others5.
Among children under two years of age, one of the most used drugs to treat chronic diseases was amoxicillin. his can be explained by recurrent respiratory infections in this age group, identiied as chronic by parents or caregivers for occurring with high frequency in short periods of time. his inding should be considered in the context of the increase in antimicrobial resistance rates reported worldwide and in Brazil11,22.
d Ministério da Saúde, Agência Nacional de Vigilância Sanitária. Bulário eletrônico. Brasília (DF); s.d [cited 2016 Feb 20]. Available from: http://www. anvisa.gov.br/datavisa/fila_bula/ index.asp
Regarding medicines most used in acute conditions, important diferences are found in the characteristics of the most commonly used drugs in the irst two years of life compared to older children. he presence of ascorbic acid, cholecalciferol+retinol, ferrous sulfate and multivitamins among the 10 drugs most used by children under 12 shows that supplementation with vitamins alone or in combination in the irst years of life is common practice in pediatrics, despite not always being supported by evidence9,14,26. Among
preschool children, what draws attention is the higher frequency of antimicrobials, including amoxicillin, sulfamethoxazole+trimethropim, and amoxicillin+clavulanate, among the 10 most cited drugs. hese results suggest that with increasing age, the higher incidence of infectious diseases, particularly respiratory, leads to greater use of antimicrobials. he age groups of two to ive years and six to 12 years show the use of nimesulide, a drug with risk of liver toxicity and Reye’s syndrome in children with symptoms of viral infection, being contraindicated for children under the age of 12 according to the standard package insert approved by ANVISA.
his study has limitations. It uses information provided by interviewees on the presence of chronic disease, which can lead to overestimation of prevalence of use. On the other hand, socio-cultural aspects involving the use of medicines, particularly when related to risk groups, may contribute to parents (the main respondents in this research) giving socially desirable answers4,25. hus, omissions in reporting the use of certain medicines cannot be
ruled out. Finally, the use of drugs for diseases that are typical in colder months, especially in the South and Southeast Regions, may be underrepresented, given that data collection occurred during spring and summer.
The results of this study indicate that a considerable percentage of Brazilian children make use of medicines, especially to treat acute conditions. Children using drugs for chronic diseases have a different demographic profile compared to those using drugs for acute conditions according to gender, age, and geographic region. Among the most commonly used drugs are medicines acknowledged as effective for pediatric use and others whose effectiveness and safety are uncertain when used in children, particularly those under the age of two.
REFERENCES
1. Barros M. Inquéritos domiciliares de saúde: potencialidades e desafios. Rev Bras Epidemiol. 2008;11 Supl 1:6-19. DOI:10.1590/S1415-790X2008000500002
2. Bertoldi AD, Silveira MP, Menezes AM, Assunção MC, Gonçalves H, Hallal PC. Tracking of medicine use and self-medication from infancy to adolescence: 1993 Pelotas (Brazil) birth cohort study. J Adolesc Health. 2012;51(6 Suppl):S11-5. DOI:10.1016/j.jadohealth.2012.06.027
3. Carnovale C, Conti V, Perrone V, Antoniazzi S, Pozzi M, Merlino L, et al. Paediatric drug use with focus on off-label prescriptions in Lombardy and implications for therapeutic approaches. Eur J Pediatr. 2013;172(2):1679-85. DOI:10.1007/s00431-013-2111-7
4. Carrasco-Garrido P, Jiménez-García R, Barrera VH, Andrés AL, Miguel AG. Medication consumption in the Spanish paediatric population: related factors and time trend, 1993-2003. Br J Clin Pharmacol. 2009;68(3):455-61. DOI:10.1111/j.1365-2125.2009.03449.x
5. Coelho HL, Rey LC, Medeiros MS, Barbosa RA, Cruz Fonseca SG, Costa PQ. Uma comparação crítica entre a Lista de Medicamentos Essenciais para Crianças da Organização Mundial de Saúde e a Relação Nacional de Medicamentos Essenciais (Rename). J Pediatr (Rio J). 2013;89(2):171-8. DOI:10.1016/j.jped.2013.03.004
6. Costa PQ, Rey LC, Coelho HL. Carência de preparações medicamentosas para uso em crianças no Brasil. J Pediatr (Rio J). 2009;85(2):229-35. DOI:10.1590/S0021-75572009000300008
8. Cruz MJB, Dourado LFN, Bodevan EC, Andrade RA, Santos DF. Medication use among children 0-14 years old: population baseline study. J Pediatr (Rio J). 2014;90(6):608-15. DOI:10.1016/j.jped.2014.03.004
9. De-Regil LM, Jefferds ME, Sylvetsky AC, Dowswell T. Intermittent iron supplementation for improving nutrition and development in children under 12 years of age. Cochrane Database Syst Rev. 2011;(12):CD009085. DOI:10.1002/14651858.CD009085.pub2
10. Eggen AE. Patterns of medicine use in a general population (0-80 years). The Influence of age, gender, diseases and place of residence on drug use in Norway. Pharmacoepidemiol Drug Saf. 1997;6(3):179-87. DOI:10.1002/(SICI)1099-1557(199705)6:3<179:AID-PDS258>3.0CO;2-P
11. Goossens H, Ferech M, Stichele RV, Elseviers M; ESAC Project Group. Outpatient antibiotic use in Europe and association with resistance: a cross-national database study. Lancet. 2005;365(9459):579-87. DOI:10.1016/S0140-6736(05)17907-0
12. Hämeen-Anttila K, Lindell-Osuagwu L, Sepponen K, Vainio K, Halonen P, Ahonen R. Factors associated with medicine use among children aged under 12 years: a population survey in Finland. Pharmacoepidemiol Drug Saf. 2010;19(4):400-407. DOI:10.1002/pds.1887
13. Hoppu K, Anabwani G, Garcia-Bournissen F, Gazarian M, Kearns GL, Nakamura H, et al. The status of paediatric medicines initiatives around the world: what has happened and what has not? Eur J Clin Pharmacol. 2012;68(1):1-10. DOI:10.1007/s00228-011-1089-1
14. Imdad A, Herzer K, Mayo-Wilson E, Yakoob MY, Bhutta ZA. Vitamin A
supplementation for preventing morbidity and mortality in children from 6 months to 5 years of age. Cochrane Database Syst Rev. 2010;(12):CD008524.
DOI:10.1002/14651858.CD008524.pub2
15. Knopf H. [Medicine use in children and adolescents. Data collection and first results of the German Health Interview and Examination Survey for Children and Adolescents (KiGGS)]. Bundesgesundheitsblatt Gesundheitsforschung Gesundheitsschutz. 2007;50(5-6):863-70. DOI:10.1007/s00103-007-0249-z
16. Knopf H, Wolf IK, Sarganas G, Zhuang W, Rascher W, Neubert A. Off-label medicine use in children and adolescents: results of a population-based study in Germany. BMC Public Health. 2013;13:631. DOI:10.1186/1471-2458-13-631
17. Lasky T. Estimates of pediatric medication use in the United States: current abilities and limitations. Clin Ther.2009;31(2):436-45. DOI:10.1016/j.clinthera.2009.02.003
18. Mengue SS, Bertoldi AD, Boing AC, NUL Tavares, da Silva Dal Pizzol T, Oliveira MA, et al. Pesquisa Nacional sobre Acesso, Utilização e Promoção do Uso Racional de Medicamentos (PNAUM): métodos do inquérito domiciliar. Rev Saude Publica. 2016;50(supl 2):4s. DOI:10.1590/S1518-8787.2016050006156
19. Moraes CG, Mengue SS, Tavares NUL, Dal Pizzol TS. Utilização de medicamentos entre crianças de zero a seis anos: um estudo de base populacional no sul do Brasil. Cienc Saude Coletiva. 2013;18(12):3585-3593. DOI:10.1590/S1413-81232013001200015
20. Oliveira EA, Bertoldi AD, Domingues MR, Santos IS, Barros AJD. Uso de medicamentos do nascimento aos dois anos: Coorte de Nascimentos de Pelotas. Rev Saude Publica. 2010;44(4):591-600. DOI:10.1590/S0034-89102010000400002
21. Perrott DA, Piira T, Goodenough B, Champion GD. Efficacy and safety of acetaminophen vs ibuprofen for treating children’s pain or fever: a meta-analysis. Arch Pediatr Adolesc Med. 2004;158(6):521-6. DOI:10.1001/archpedi.158.6.521
22. Rossi F. The challenges of antimicrobial resistance in Brazil. Clin Infect Dis 2011;52(9):1138-43. DOI:10.1093/cid/cir120
23. Santos DB, Barreto ML, Coelho HLL. Utilização de medicamentos e fatores associados entre crianças residentes em áreas pobres. Rev Saude Publica 2009;43(5):768-78. DOI:10.1590/S0034-89102009000500005
24. Santos DB, Barreto ML, Coelho HLL. Use of prescribed and non-prescribed medications among children living in poor areas in the city of Salvador, Bahia State, Brazil. Cad Saude Publica. 2011;27(10):2032-40. DOI:10.1590/S0102-311X2011001000016
26. Winzenberg T, Powell S, Shaw KA, Jones G. Effects of vitamin D supplementation on bone density in healthy children: systematic review and meta-analysis. BMJ. 2011;342:c7254. DOI:10.1136/bmj.c7254
Funding: Department for Pharmaceutical Services and Strategic Health Supplies (DAF) and Department of
Science and Technology (DECIT) of the Secretariat of Science, Technology and Strategic Inputs – SCTIE of the Ministry of Health (Process 25000.111834/2011-31).
Authors’ Contributions: design, analysis, interpretation of results, and critical review of intellectual content:
TSDP, NULT, SSM. All authors participated in drafting the study, approved the inal version of the manuscript
and declare they are responsible for all aspects of the work, ensuring its accuracy and integrity.
Acknowledgments: Departments of Science and Technology (DECIT) and Pharmaceutical Services (DAF) of the
Secretariat of Science, Technology and Strategic Inputs (SCTIE) of the Ministry of Health (MS) for funding and
technical support to carry out the National Survey on Access, Use and Promotion of Rational Use of Medicines,
and in particular the team that worked on data collection, represented here by Professor Alexandra Crispim Boing and the project’s statistical support team, by Amanda Ramalho Silva, Andréia Fontanella and Luciano
Santos Pinto Guimarães.