*e-mail: mpggih@intec.unl.edu.ar
Chemical Changes of Titanium and Titanium
Dioxide under Electron Bombardment
Romina Brascaa, Luciana Ines Vergarab,c, Mario César Guillermo Passeggib*, Julio Ferróna,b
a
Facultad de Ingeniería Química, Universidad Nacional del Litoral, Santiago del Estero, 2829,
(S3000AOM) Santa Fe, Argentina
b
Laboratorio de Superficies e Interfaces, Instituto de Desarrollo Tecnológico para la Industria
Química, INTEC (CONICET-UNL), Güemes 3450, (S3000GLN) Santa Fe, Argentina
c
Department of Chemistry, University of Tennessee, Knoxville, TN 37996 USA
Received: March 15, 2007; Revised: August 6, 2007
The electron induced effect on the first stages of the titanium (Ti0) oxidation and titanium dioxide (Ti4+) chemical
reduction processes has been studied by means of Auger electron spectroscopy. Using factor analysis we found that both processes are characterized by the appearance of an intermediate Ti oxidation state, Ti2O3 (Ti3+).
Keywords: titanium, titanium oxides, AES, electron bombardment, factor analysis
1. Introduction
Thin metal oxide films over metal and semiconductor surfaces are probably the most widely studied structures in basic physics and technology. The reason is quite simple; their applications cover areas of interest such as catalysis1 microelectronic devices2,3, medicine4,5,
and aircraft construction6. Metal-metal oxide structures involving
titanium (Ti) are among the most interesting and used ones. Thus, the surface oxide passivation of Ti makes possible the biocompat-ibility of Ti and its use in medicine, and the production of protective coatings against corrosion7. Since most of the useful properties are
determined by phenomena occurring at the surface, the kinetic and thermodynamic features of the oxide films growth and chemical reactions at the surfaces are key facts in most of these processes. These chemical reactions can be greatly affected by the incidence of energetic particles or photons. While sometimes these reactions are looked for wanted effects, such as in electron lithography8-10, in other
cases they represent experimental artifacts, like in surface analysis techniques based on electron spectroscopies. The chemical reactions can be either oxidation or reduction depending on the particular substrate. Thus, while in electron lithography the desired effect is the metallic reduction11, the electron bombardment can enhance by
several orders of magnitude the oxidation kinetic of a semiconduc-tor12,13. The identification of the different products appearing in the
growth of oxide films, as well as in the different reaction occurring at surfaces, allows us a better understanding of the different processes and, at the same time, opens the possibility of designing reliable growth and characterization methods.
In this paper, using Auger electron spectroscopy (AES) and factor analysis (FA)14, applied in the sequential way15,16, we study
the oxidation process of metallic titanium and the reduction proc-ess of a TiO2 thin film under electron irradiation. In both cases we determine the chemical state of the different compounds formed over the surface. The application of FA to the Auger spectra allows us to obtain the Auger line shapes of the different species formed along the irradiation process.
2. Experimental details
2.1. Experimental setup
All measurements were performed at room temperature in a com-mercial ultra high vacuum (UHV) surface analysis system with a base pressure in the lower 10-10 Torr range, equipped with Auger electron
spectroscopy (AES) facilities. Differentiated Auger spectra of the transitions TiLMM, TiLMV and OKLL were acquired using a single-pass cylindrical mirror analyzer with a resolution of 0.6% and modulation amplitude of 4 and 2 Vp-p for the oxidation and reduction processes, respectively. The incidence angle of the electron beam was 30º with respect to the surface normal. The primary electron beam energy was 3 keV, the irradiated area ~7 x 10⁻⁵ cm2, the electron gun was
perma-nently switched on during the oxidation and reduction processes, and the acquisition of the Auger spectra was performed within the same irradiation conditions. The current density was 48 and 35 mA.cm-2,
for the oxidation and reduction processes, respectively.
The sample used for the oxidation process was high-purity poly-crystalline titanium (with 125 ppm of impurities including Fe, Si, Mn, Mg and Sn). The sample surface was cleaned by ion bombardment using Ar+ at 4 keV until carbon and oxygen contamination was below
the AES detection limits. The UHV chamber was filled with high purity oxygen (better than 99.997%) at a pressure of 2 x 10⁻⁸ Torr.
The pressure was measured by means of a non-corrected Bayard-Alpert gauge and the oxygen exposure was maintained at least until the saturation of the oxygen Auger signal was obtained.
The TiO2 film for the reduction process was grown over a Cu(100) single crystal, cleaned by cycles of Ar+ ion bombardment
(1 keV) followed by annealing at 850 K, until carbon and oxygen contamination was below the AES detection limit. The TiO2 film was prepared by Ti thermal evaporation from a high purity polycrystal-line Ti bar heated through electron bombardment in an O2 environ-ment (2 x 10⁻⁷ Torr). The Cu substrate was kept at room temperature
the Cu substrate . The evaporation rate was determined through the attenuation of the substrate signal with deposition time, being a typi-cal value 0.15 mL/min. The analyzed films were ~10 mL thick. This thickness was large enough to attenuate any Auger signal coming from the substrate, but small enough to prevent sample charging.
The irradiation dose φ was calculated as φ = Ja⋅ ti, where Ja is the current density and ti the total irradiation time in seconds. Since, the same irradiation conditions were used during the AES spectra acqui-sition, the total dose was obtained by the addition of irradiation and acquisition times. A typical spectrum acquisition time was 30 seconds and the whole irradiation time until saturation ~6 hours.
2.2. Data treatment
The factor analysis (FA) method14 has been extensively discussed
in previous works12,15,16,18,19, and it is currently included as a standard
data treatment system in most data treatment packages. Therefore we will limit ourselves here to a brief description. The first step in FA is the determination of the number of linearly independent factors, i.e. the minimum number of pure components required to describe the complete series of spectra corresponding to the evolution under study. In doing that, we compare the error obtained, by fitting the ex-perimental data with a minimum set of factors, with the exex-perimental error (EE). This procedure is performed as Auger spectra are added in a sequential way15, and each time the fitting error surpasses the
experimental one, a new factor appears in the process.
Once the number of independent factors is known, the Auger line shape of each pure component (or base) is determined through a least square fit procedure called target transformation (TT)14,15.
The final step in FA is the correlation among the obtained bases and actual compounds, which is performed through a simple fingerprint procedure. Since the experimental Auger spectra of all Ti compounds involved in this study are available in the literature19-24, this final step
is easily performed.
3. Results and Discussion
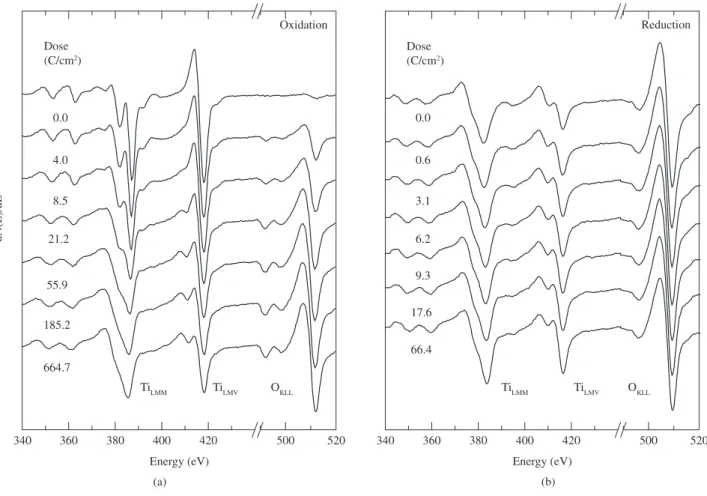
In Figure 1, we present two sets of spectra showing the evolution of the Auger line shape corresponding to the TiLMM, TiLMV and OKLL transitions as a function of the electron irradiation dose during the Ti oxidation (a) and TiO2 reduction (b) processes. The total irradia-tion dose required to reach saturairradia-tion during the oxidairradia-tion process is one order of magnitude larger than that for the reduction. As the irradiation dose increases, the spectra show the growth/decrease of the amount of oxygen at the surface for the oxidation/reduction process and changes in the Auger line shapes of Ti in both cases, especially in the region corresponding to the LMV transition. As expected, this last result suggests changes in the Ti electron density of states due to the oxidation/reduction process.
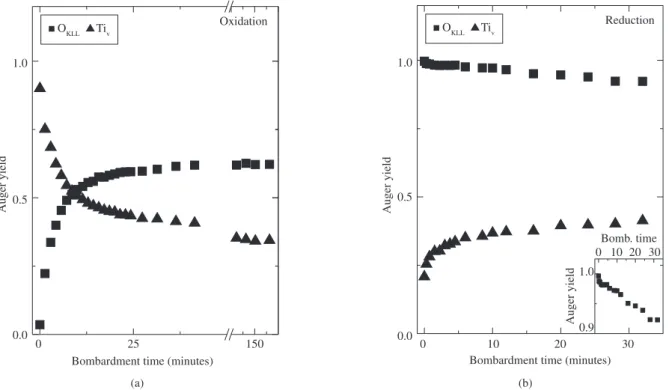
To analyze the results in a more quantitative way, we depict in Figure 2 the peak intensities corresponding to the TiLMV (~418 eV) and OKLL (~510 eV) Auger transitions as a function of the electron bombardment time for both experiments already mentioned. The intensities were normalized to the OKLL initial yield of the TiO2 spectrum.
In Figure 2a, the TiLMV and OKLL Auger yields show a typical oxidation behavior, with two clearly different evolution stages: an initial fast decrease/increase of the titanium/oxygen amount at the
Figure 1. TiLMM (340-395 eV), TiLMV (395-440 eV) and OKLL (490-520 eV) Auger line shapes evolution as a function of the irradiation dose during the electron stimulated oxidation of metallic Ti (a) and reduction of a TiO2 film (b) under electron irradiation.
Dose
(C/cm2)
OKLL
TiLMV
TiLMM
664.7 185.2 55.9
21.2 8.5 4.0 0.0
dN(E)/dE
Dose
(C/cm2)
Reduction
OKLL
TiLMV
TiLMM
66.4 17.6 9.3 6.2 3.1 0.6 0.0
Energy (eV)
340 360 380 400 420 500 520
Energy (eV)
340 360 380 400 420 500 520
Oxidation
0 0.0 0.5 1.0
Oxidation
Auger yield
Bombardment time (minutes)
Tiv
OKLL
150 25
(a)
0.0 0.5 1.0
Auger yield
Bombardment time (minutes) 0
0.9
Auger yield
Reduction
1.0
Bomb. time
Tiv
OKLL
30 20
10
0 10 20 30
(b)
Figure 2. Evolution of the TiLMV () and OKLL () peak-to-peak Auger yields as a function of the electron bombardment time, for the metallic Ti oxidation (a) and TiO2 reduction (b) processes under electron irradiation. Inset (2b): zoom of the OKLL signal.
0.0 0.3 0.6 0.9 1.2 1.5
Ti + TiO2
RVM
OKLL Auger yield
1.0 0.8
0.6 0.4
0.2
Ti oxidation without e- bombardment
Ti oxidation with e- bombardment
TiO2 reduction with e- bombardment
Figure 3. Evolution of the parameter RVM as a function of the OKLL Auger yield, for the metallic Ti oxidation () and TiO2 reduction () processes under electron irradiation. For comparison purposes, we added a curve ob-tained from measurements made keeping the electron bombardment to a minimum ()19.
surface followed by a slowing down of the kinetics until a plateau is reached. In Figure 2b, we depict the results for the reduction process. Although a substantial change is observed for the TiLMV signal during the first 5 minutes of bombardment, i.e. a large monotonic increase, little modifications are visible for the OKLL signal in this scale. Thus, a zoom for the latter is shown in the inset of Figure 2b. As we can see, the oxygen depletion begins as soon as the irradiation starts, showing a large monotonic decrease along the whole process.
A more detailed analysis can be performed based in the fact that only one of the main Ti Auger transitions involves valence electrons (TiLMV)25. Thus, it has been proposed that the ratio between both Ti
Auger transitions yields, TiLMV/TiLMM hereinafter named as RVM, can be used as a good indicator of the Ti oxidation state26,27. Moreover,
comparing the evolution of this parameter with factor analysis re-sults19, we showed that the evolution of the R
VM ratio can be used as
a first indicator for a qualitative analysis.
In Figure 3, we show the evolution of the RVM ratio as a function of the oxygen Auger yield, for the experiments already mentioned. The arrows indicate the direction in which each experiment has been done. We can observe that the Ti oxidation state for the oxidation experiment strongly depends on the electron irradiation; in fact changes in the RVM ratio take place for lower OKLL yields in comparison with measurements made keeping the electron bombardment to a minimum19. The same
effect has been observed by decreasing/increasing the oxygen pressure/ electron beam density for a given electron density/pressure. Thus, under electron irradiation we can get larger changes in the RVM evolution for lower oxygen Auger yields28. These results can be explained based only
in the oxygen enhanced diffusion induced by electron irradiation. In the case of the reduction experiment, the RVM shows a monotonic increase originated in the electron transference to the Ti valence band (chemical reduction process), which is correlated with the monotonic decrease of the OKLL yield along the process. The dotted line, added in the figure as a guide to the eye, seems to suggest that the oxide reduction under electron irradiation might follow the same path as the Ti oxidation in
a reversible way. As we will see, this is not true, but in order to prove this fact we need to identify the different Ti compounds that appear along both experiments, by applying the factor analysis method 14 to
the titanium Auger line shape evolutions.
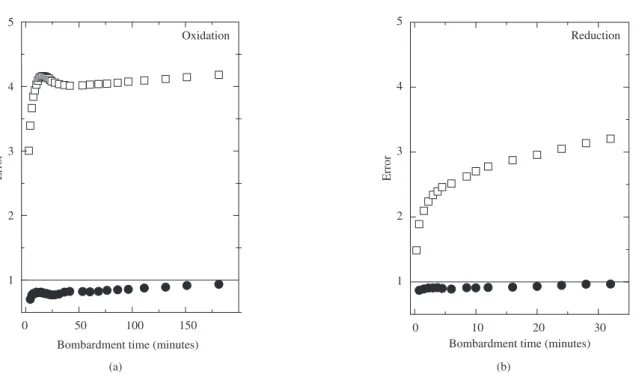
In order to determine the number of independent components present in the oxidation and reduction processes, we apply the PCA in the sequential way15,16,19. In Figure 4, we depict the evolution of the
that both, the oxidation and reduction processes, can be described in terms of two independent components. Since metallic titanium and titanium dioxide are present as the starting surface component for the oxidation and reduction processes, respectively, under these particular analyzed conditions the results imply that only one Ti oxide is created by electron irradiation in both cases.
In Figure 5, we compare the shape of the Auger spectra obtained through FA for the oxidation (a) and reduction (b) processes with known experimental Auger spectra of Ti20 and different Ti oxides
(c)21,22,29,30. The spectrum ascribed to the first component (Base 1)
obviously corresponds to pure Ti for the oxidation process and TiO2 for the reduction process. The second component spectrum seems to be the same for both experiments. A fingerprint procedure allows us to identify this second independent component as Ti2O3. The slight discrepancies observed among the bases coming from the different experiments, may point out the presence of small amounts of a third component. Within the FA capability of compound identification, the oxidation and reduction processes are characterized by the appearance of only one Ti oxide, i.e. Ti2O3.
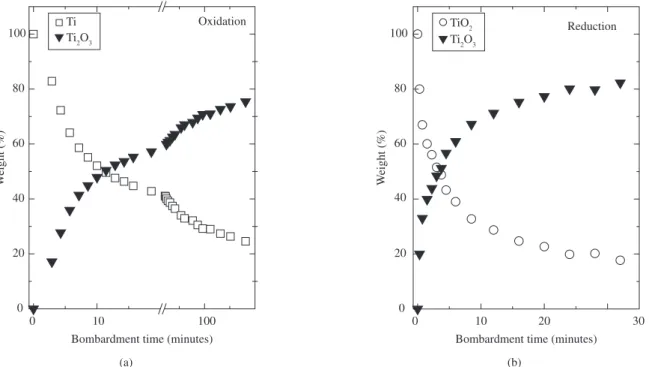
In Figure 6, we show the evolution of the weight of each inde-pendent component in the total Auger line shape of the experimental spectra acquired along the irradiation processes under study. One of the processes is characterized by a rapid metallic Ti depletion and the other one by TiO2 chemical reduction, both giving place to the forma-tion of Ti2O3. Although, the oxide reaches a similar maximum weight in both experiments, it is clear that the reduction is a faster process. Another interesting issue to be noticed is that for both experiments the Ti2O3 weight reaches a steady stage at a saturation value of about 80%, which prevents the complete disappearance of metallic Ti or TiO2 in the oxidation and reduction processes, respectively. This last result can be explained as a consequence of the deposition of little amounts of carbon at the surface, favored by the electron bombard-ment, which tends to stabilize the oxide preventing us from reaching the complete disappearance of metallic Ti or TiO2. From the fact that at saturation in the reduction process we still observe the presence of
1 2 3 4 5
Error
Bombardment time (minutes)
0 10 20 30
Reduction
(b)
Figure 4. Evolution of the error attained in reproducing the data matrix as a function of the electron bombardment time considering one () and two () factors, for the metallic Ti oxidation (a) and TiO2 reduction (b) processes under electron irradiation. The horizontal line at unity corresponds to a calculated error equal to the EE.
(a)
0 1 2 3 4 5
Oxidation
Error
Bombardment time (minutes) 150 100
50
TiO2, we conclude that the reduction length towards the bulk is below 20 Å (typical escape depth of Ti Auger electrons in an oxide).
Although the electron stimulated desorption is present in both experiments, it is of crucial importance in the chemical reduction of TiO2 to Ti2O3 due to electron irradiation. This process can be explained on the basis of the Knotek and Feibelman model (KF)31-33, which
is the most suitable for electron stimulated desorption on ionically bonded surfaces. The KF model introduces the Auger stimulated desorption, which in a maximal valence ionic compound is produced by the repulsive potential that appears when the sign of the anion charge changes due to an Auger transition. In an ionic compound, like TiO2, electrons are spatially accumulated around the O anions, while the Ti is nominally ionized down to the noble gas configuration Figure 5. Auger spectra of the independent bases obtained after applying the TT method to the Ti spectra acquired along the electron stimulated oxidation of metallic Ti (a) and reduction of a TiO2 film (b) under electron irradiation. Experimental Auger spectra of Ti20 and its different compounds (c)21,22.
380
dN(E)/dE
Energy (eV)
Ti
TiO
Ti2O3
TiO2
(c) Experimental spectra (from literature)
380
(b) Reduction - FA bases
Base 2
Base 1
380
(a) Oxidation - FA bases
Base 2 Base 1
420
Ti4+ (maximal valence). If an energetic electron ionizes a titanium
(oxygen) inner shell, the dominant decay will be an inter-atomic (intra-atomic) Auger process involving two or three O electrons. This will leave both O and Ti positively charged giving place to the O expulsion. In the sub-oxide Ti3+, however, valence electrons do
reside on the Ti cation. Consequently, the dominant decay will be an intra-atomic Auger process, which will make the Ti more positive and thus will generally increase surface stability.
4. Conclusions
We have characterized through Auger electron spectroscopy and factor analysis the titanium (Ti0) oxidation and titanium dioxide (Ti4+)
chemical reduction processes under electron irradiation. We found that the electron bombardment affects the chemical reactions at the surface depending on the experimental environment. Thus, for the oxidation process we have a competition between the enhanced reaction kinetics through the dissociation of oxygen molecules induced by the electron bombardment, and the stimulated desorption produced, for instance, through the Knotek-Feibelmann process. On the other hand, the stimu-lated desorption is the only process present in the oxide reduction, previ-ous to the C enhanced deposition. The measurable output in both cases is the appearance of an intermediate Ti oxidation state, i.e., Ti2O3.
Acknowledgment
This work has been partially supported by CONICET, ANPCyT and Universidad Nacional del Litoral through grants PIP 2553/99 and 5277, PICT 14730 and CAI+D 2000-6-6-62, respectively. One of us (R.B.) thanks the Universidad Nacional del Litoral for an un-dergraduate fellowship.
References
1. Linsebigler AL, Lu G, Yates Jr. JT. Photocatalysis on TiO2 surfaces: Principles, mechanisms, and selected results. Chemical Reviews. 1995; 95(3):735-758.
2. Keister FZ. Thin-film titanium dioxide capacitors for microelectronic applications. Microelectronic Reliability. 1966; 5(1):95.
3. Intemann A, Koemer H, Koch F. Film Properties of CVD titanium nitride deposited with organometallic precursors at low pressure using inert gases, ammonia, or remote activation. Journal of the Electrochemical Society. 1993; 140(11):3215-3222.
4. Muller U, Hauert R. XPS investigation of Ti-O containing diamond-like carbon films. Thin Solid Films. 1996; 290-291(1):323-327.
5. Hanawa T, Ota M. Characterization of surface film formed on titanium in electrolyte using XPS. Applied Surface Science. 1992; 55(4):263-276. 6. Shevell S. Fundamental of Flight. New Jersey: Prentice Hall, Englewoods
Cliffs; 1989.
7. Espinós JP, Fernández A, González AR. Oxidation and diffusion processes in nickel-titanium oxide systems. Surface Science. 1993; 295(3):402-410.
8. Chen S, Boothroyd CB, Humphreys CJ. Electron-beam induced crystal-lization transition in self-developing amorphous AlF3 resists. Applied Physics Letters. 1996; 69(2):170-172.
9. Watanabe H, Fujita J, Ochiai Y, Matsui S, Ichikawa M. Self-developing properties of an inorganic electron beam resist and nanometer-scale patterning using a scanning electron beam. Japanese Journal of Applied Physics. 1995; 34(12B):6950-6955.
10. Langheinrich W, Spangenberg B, Beneking H. Nanostructure fabrication using lithium fluoride films as an electron beam resist. Journal of Vacuum Science and Technology B. 1992; 10(6):2868-2872.
11. Vergara LI, Vidal RA, Ferrón J. Electron induced reduction on AlF3 thin films. Applied Surface Science. 2004; 229(1-4):301-310.
12. Passeggi Jr. MCG, Vaquila I, Ferrón J. Auger electron spectroscopy and principal component analysis of the first stages of oxidation in GaAs(100). Surface and Interface Analysis. 1993; 20(9):761-765.
13. Passeggi Jr., MCG, Vaquila I, Ferrón J. Auger electron spectroscopy analysis of the first stages of thermally stimulated oxidation of GaAs(100). Applied Surface Science. 1998; 133(1-2):65-72.
14. Malinowski E, Howery D. Factor Analysis in Chemistry. New York: Wiley; 1980.
Figure 6. Evolution of the weights of the different titanium compounds obtained with the TT method as a function of the electron bombardment time, for the metallic Ti oxidation (a) and TiO2 reduction (b) processes under electron irradiation.
0 20 40 60 80 100
Oxidation
W
eight (%)
Bombardment time (minutes)
0 10 100
Ti
Ti2O3
(b) (a)
0 20 40 60 80 100
W
eight (%)
Bombardment time (minutes) Reduction
0 10 20 30
TiO2
15. Vidal RA, Ferrón J. Application of Auger electron spectroscopy and principal component analysis to the study of the Pd/c-Si and Pd/a-Si interfaces. Applied Surface Science. 1988; 31(2):263-276.
16. Steren L, Vidal RA, Ferrón J. AES and factor analysis study of silicide growth at the Pd/c-Si interface. Applied Surface Science. 1987; 29(4):418-426.
17. Passeggi Jr. MCG, Vergara LI, Mendoza SM, Ferrón J. Passivation and temperature effects on the oxidation process of titanium thin films. Surface Science. 2002; 507-510(1):825-831.
18. Vaquila I, Passeggi Jr. MCG, Ferrón J. Oxidation process in titanium thin films. Physical Review B. 1997; 55(20):13925-13931.
19. Vaquila I, Passeggi Jr. MCG, Ferrón J. Oxide stoichiometry in the early stages of titanium oxidation. Surface Science. 1993, 292(1-2):L795-L800.
20. Davis LE, Mac Donald NC, Palmberg PW, Riach GE, Weber RE. Hand-book of Auger Electron Spectroscopy. Minnesota: Perkin-Elmer, Eden Prairie; 1978.
21. Solomon JS, Baun WL. Molecular orbital effects on the Ti LMV auger spectra of TiO and TiO2. Surface Science. 1975; 51(1):228-236. 22. Bermudez VM. Changes in the surface composition of Si, TiO2, and SiO2
induced by pulsed ruby-laser irradiation. Journal of Vacuum Science and Technology. 1982; 20(1):51-57.
23. Mitura E, Niedzielska A, Niedzielski P, Klimek L, Rylski A, Mitura S, et al. The properties of carbon layers deposited onto titanium substrates. Diamond and Related Materials. 1996; 5(9):998-1001.
24. Frage N, Froumin N, Dariel MP. Wetting of TiC by non-reactive liquid metals. Acta Materialia. 2002; 50(2):237-245.
25. Szalkouski FJ, Somorjai G. Auger electron spectroscopy investigations of the surface chemical composition of vanadium, the vanadium oxides, and oxidized vanadium: chemical shift and peak intensity analysis. Journal of Chemical Physics. 1972; 56(12):6097-6103.
26. Roman E, Sanchez-Avedillo M, de Segovia JL. AES and ELS study of tita-nium oxidation in high vacuum. Applied Physics A. 1984; 35(1):35-40. 27. Rao CNR, Sarma DD, Hedge MS. A novel approach to the study of
surface oxidation states and oxidation of transition metals by Auger electron spectroscopy. Proceedings of the Royal Society of London A. 1980; 370(1741):269-280.
28. Brasca R, Passeggi Jr. MCG, Ferrón J. Titanium oxidation-reduction at low oxygen pressure under electron bombardment. Thin Solid Films. 2006; 515(4):2021-2025.
29. Gandon J, Joud JC. Analysis of the films of titanium oxides by Auger electron spectroscopy. Journal of the Less-Common Metals. 1980; 69(1):277-291.
30. Vaquila I, Passeggi Jr. MCG, Ferrón J. Temperature effect in the early stages of titanium oxidation. Applied Surface Science. 1996; 93(3):247-253.
31. Knotek ML, Feibelman PJ. Ion desorption by core-hole Auger decay. Physical Review Letters. 1978; 40(14):964-967.
32. Feibelman PJ, Knotek ML. Reinterpretation of electron-stimulated desorption data from chemisorption systems. Physical Review B. 1978; 18(12):6531-6539.