DO:
D 10.1590/S1516-14392011005000075
*e-mail: [email protected]
Magnetic and Dielectric Proprieties of Multiferroic (1-x)Pb(Fe
2/3W
1/3)O
3-xPbTiO
3Ceramics Prepared Via a Modified Two-stage Solid-state Reaction
Bárbara Maraston Fraygolaa*, Adelino de Aguiar Coelhob, Ducinei Garciaa, José Antônio Eirasa
a
Grupo de Cerâmicas Ferroelétricas, Departamento de Física – DF,
Universidade Federal de São Carlos – UFSCar, CEP 13565-670, São Carlos, SP, Brazil
b
Laboratório de Preparação e Caracterização de Materiais – LPCM,
Departamento de Física Aplicada – DFA, Instituto de Física “Gleb Wataghin” – IFGW,
Universidade Estadual de Campinas – UNICAMP, CEP 13083-859, Campinas, SP, Brazil
Received: April 26, 2010; Revised: August 17, 2011
Multiferroic Pb(Fe2/3W1/3)D3-PbTiD3 (PFW-PT) ceramics were synthesized via a modiied two-stage solid-state reaction. This method utilized Fe2WD6, prepared at a irst-stage, which was subsequently reacted with a stoichiometric amount of PbD and TiD2 at the second stage. This procedure eficiently suppressed the formation of lead tungstates and leads to getting dense ceramics. Electric and dielectric properties of (1-x)Pb(Fe2/3W1/3)D3-xPbTiD3 solid solutions were investigated as a function of the frequency and temperature. All samples present density higher than 96% of the theoretical one, low percentage of pyrochlore phase (<2%) and relatively high electrical resistivity (<1010 Ω.m). RF dielectric measurements over the temperature showed the presence of a peak, which is related to the ferro-paraelectric phase transition and conductive contributions (in the range 200-700 K), associated to a electronic hoping mechanism. The dielectric properties of the PFW shows a
typical relaxor behaviour for x = 0 and 0.10 with frequency-dependent peak temperature (Tm), while the samples
with higher PT-content undergo a ’normal’ para-ferroelectric transition at the Curie temperature TC.The FE phase transition of PFW is shifted to higher temperatures by PbTiD3 (PT) additions and high resistivity are obtained for PT containing samples. Different types of magnetic activity dependent on composition and temperature were found.
Keywords: multiferroics, ferroelectrics, PFW
1. Introduction
Due to the low temperature sinterability, high permittivity and diffuse phase transition among other characteristics, lead-based complex perovskite compound have been investigated widely and have found many applications as multilayer ceramic capacitors (MLCC’s), electrostrictive actuators, pyroelectric detectors, etc1-4. On particular, lead iron tungstate (PFW) has been studied when the interest is in dielectrics for capacitors due to its high relative permittivity, relaxor proprieties and low sintering temperatures (below 900 °C) and as well as presenting conditions for the coexistence of ferroelectric and magnetic order (multiferroic), due to two kinds of cations (Fe3+ and W6+) randomly distribute at the octahedral B-site positions1,5,6. The interaction of the electric and magnetic subsystems can manifest itself as the magnetoelectric effect as the effect of mutual
inluence of the polarization and magnetization. Magnetoelectric
coupling can be observed in multiferroic materials in the regions where magnetic and ferroelectric ordering coexists, generally, at very low temperatures. PFW is ferroelectric (Tc ~ 180 K) and antiferromagnetic (TN ~ 340 K), besides, the Curie temperature is too low for practical applications. However, an interesting peculiarity of PFW system by comparison with other multiferroics is caused by the presence of magnetic ions Fe3+ with occupancy of 66.66% of the B-octahedral sites of the perovskite cells, leading to one of highest magnetic ordering temperature establishment in multiferroics materials7 and, additionally, PFW can form solid solutions with PbTiD3-PT. As the PT content is increased, the Curie temperature increases, because PT has a transition at a rather high temperature (around 763 K). Adittionally, magnetic proprieties of PFW-PT system
are studied in ceramics samples8 and in single crystal form9 and both result are contradictories.
On the reaction process, a substantial amount of lead tungstates
and pyrochlore phase can be produced; in addition, two liquid
phases are formulated at 690 and 860 °C respectively10,11 resulting
in the dificulty in fabricating pure Pb(Fe2/3W1/3)D3 compound. Many attempts have thus been made to synthesize single-phase PFW of perovskite structure. On conventional solid state reaction, PbD, Fe2D3 and WD3 were mixed, and then calcined for developing the perovskite PFW phase, prior to sintering10. Various kinds of solution methods have been used for alternating the reaction routes so as to yield pure Pb(Fe2/3W1/3)D3 without lead tungstates, such as mechanical activation-assisted synthesis12-14 and coprecipitation15, with some
success. Additionally, to get intensiied properties in magnetoelectric
materials high density and low electric conductivity must achieved. Considering the complicated and severe operation conditions demanded by the above solution processes, in this work consideration is given to the synthesis and characterization of PFW-PT ceramics,
prepared following a modiied two-stage mixed oxide route. By this
method a step in the preparation of the powders can be avoided, compared to the conventional two steps method, which considers the preparation of PFW and PT separately, soon to adapt the solid solution PFW-PT. The reaction and sintering mechanisms are investigated for the formation of the pure phase of (1-x)PFW-xPT ceramics, with
x = 0.10, 0.20, 0.30 and the samples study encompasses identiication
2. Experimental
A two-stage solid-state reaction is a synthesis process similar to that used by Swartz and Shrout16 in fabricating perovskite PMN.
Modiied two stage solid state reaction was used in this work to
prepare PFW and PFW-PT ceramics. On this case, Fe2D3 was irst reacted with WD3 to produce Fe2WD6, followed by a second reaction between the Fe2WD6 and PbO. In case of the PT modiied samples the second reaction is accompanied by the TiD2 addition.
The following two-stage solid-reaction sequence is designed for
this synthesizing procedure:
2 3 3 2 6
Fe O +WO →Fe WO (950 C – 3 hours) – (FW)° (1)
in the irst stage and:
2 6 2 2/3 1/3 1-x x 3
(1–x)Fe WO +3PbO +3xTiO 3Pb(Fe W ) Ti O
(800 °C – 3 hours) – PFW – PT →
(2)
for x = 0; 0.10; 0.20 and 0.30, as the second stage.
Fe2D3 (99.99%, Alfa) and WD3 (99.8%, Alfa) were mixed in distilled H2D media for 2 hours, and then dried and preheated at 850, 950 e 1000 °C for 3 hours to study the phase formation of Fe2WD6. Afterward ground for 5 hours, PbD (99.99%, GFS Chemicals) or PbD and TiD2 (99.99%, Aldrich) was mixed in a stoichiometric ratio to Fe2WD6 in distilled H2D media for 1 hour. The mixture was initially calcined at 800 °C for 3 hours and reground for 5 hours in distilled H2D media. Ceramic fabrication was achieved by adding 3 wt. (%) polyvinyl alcohol (PVA) binder to the calcined powders, prior to pressing as pellets, of 10 mm in diameter and 1-2 mm thickness, in a 100 MPa pseudo-uniaxial die and then isostatically, followed
inally by sintering at 830-870 °C for 5 hours in alumina crucible.
The pellets were covered by powder of the same composition, in order to reduce the Pb-evaporation during the sintering process. With the increase of PT content, the sintering temperature was increased slightly. The temperature ramps were controlled at 5 oC/min for heating and 2 oC/min for cooling. Analysis performed by EDX and
SEM conirmed the compositional stoichiometry and microstructural
homogeneity for all compositions.
The reaction sequence to obtain PFW and PFW-PT was analyzed, with the adequate mixture of the precursors, by differential thermal
analysis (DTA) and thermogravimetry (TGA) using AlD3 as standard. DTA was carried out in air with heating and cooling rates of 10 °C/min. The crystallinity, present phases and symmetry of (1 – x) PFW –
xPT was checked by XRD using a least mean square method17 to ind the cell parameters and the amount of secondary phases.
Sintering studies were performed in a dilatometer at a 10 °C/min heating rate up to 1000 °C, in air. The relative densities of the sintered samples were determined by the Archimedes method, while their morphological features were analyzed in a Jeol/5800LV scanning electron microscope (SEM). The X-ray powder diffraction patterns were obtained at room temperature on a Rigaku Denki powder diffractometer with geometry θ-2θ, rotating anode X-ray source (Cu Kα radiation, λ = 1.542 Å), and scintillation detector. Gold electrodes were deposited by sputtering on the polished parallel faces of the pellets for the dielectric and electric measurements.
Dc resistivity of the ceramics was measured in the temperature range 300-750 K by two probe method, applied low voltages, using a 6517A Keithley electrometer. Dielectric permittivity was measured at
various frequencies between 100 Hz and 10 MHz in the temperature
range from 10 to 750 K, using an Ompedance Analyzer HP 4194A at a constant cooling rate of 2 K/min. The magnetic moments of
samples were measured using a commercial superconducting quantum
interferometric device SQUOD magnetometer and in a PPMS in the range of temperatures 4-400 K. The samples were cooled to the
measurement temperature (K) in the absence of a magnetic ield (zero-ield cooling - ZFC). A magnetic ield was subsequently applied (200 Oe for dc measurements and 10 Oe for ac, at a frequency of 1 KHz) while heating (ield heating FH) for the measurement of the temperature
dependence of the magnetization M (T) and magnetic moment m (T).
3. Results
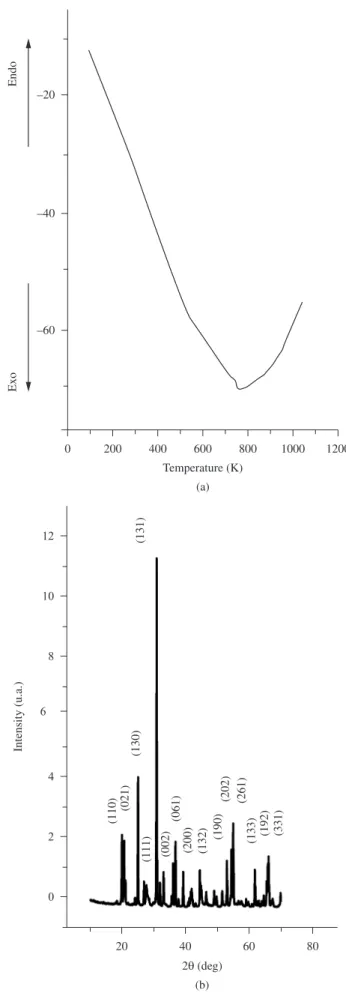
Figure 1a depicts the DTA curve for a mixture of WD3 and Fe2D3 to form Fe2WD3(FW). A small exothermic peak in DTA curve around 800 °C can be observed over the whole measured temperature range, which can be associated to the FW phase formation. This temperature it is very close to that indicate by Chung-Hsin Lu and Yeak-Chong Wong 18 for FW calcining (850 °C), however, we only check phase completes formation at 950 °C (Figure 1b).
X-ray diffraction pattern of Fe2WD6 – FW calcined at 950 °C revealed no secondary crystalline phases (Figure 1b) [JPCDS #42-0492].
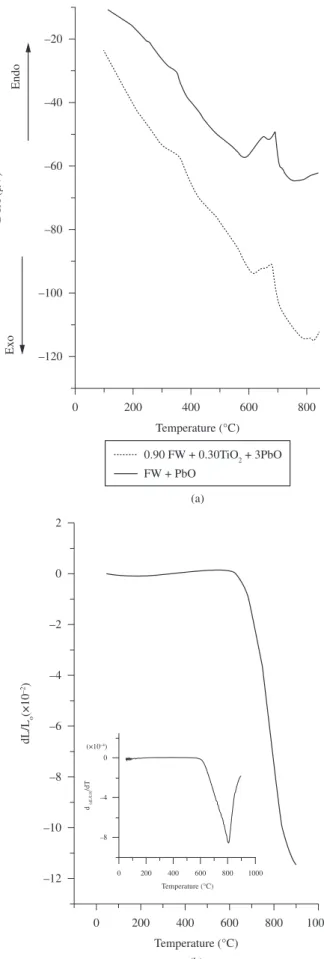
DTA were also used to analyze the powder containing lead oxide mixed with FW (PbD + Fe2WD6), as shown in Figure 2a (dotted line). On the range from 200 to 400 °C occur the water and organics decomposition that can be associated to a large exothermic peak in the DTA curve. A shoulder, an endothermic peak centered at 680 °C, is associated to the solid state reaction between PbD and FW. These results indicate that the PFW is formed in the range from 600 to 800 °C. The best range for the kinetic of this solid state
reaction was veriied to be between 750 and 800 °C. In the DTA
curve for PFW-30 PT (PbD + Fe2WD6 + TiD2) it can be seem a large endothermic peak, which can be separated in two endothermic peaks as follows: a) an endothermic peak probably related to the PbD-TiD2 reaction between 600 and 650 oC and b) an endothermic peak related to PFW-PT formation, around the peak obtained for pure PFW. On the others PT solid solutions the DTA similar results were obtained. Based on these results all the powders were calcined at 780 oC. No indications of formation of pyrochlore phase were found in DTA measurements. A typical example of a sintering shrinkage curve is given in Figure 2b. At low temperatures only thermal expansion of the green body is recorded. When 600 °C is reached the shrinkage process begins and the material starts to sinter19. The maximum shrinkage rate, take place at 800 °C for PFW-30 PT samples (see linear shrinkage rate, insert Figure 2b). These results indicate that the PFW-PT ceramics could be sintered in the range from 780 to 880 °C. However, density analysis indicated the best sintering temperatures and time between 830-870 °C for 5 hours. As the PT content increases the sintering temperature was slighted increased.
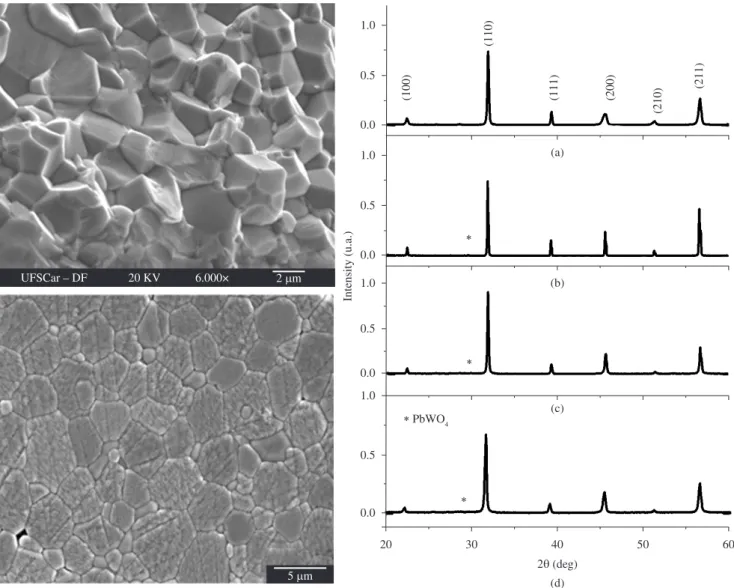
Figure 3 shows the X-ray diffractograms recorded for pure PFW and PFW-PT sintered samples. As can be seem, the XRD patterns indicate the formation of a majoritary PFW perovskite phase, to a
irst approximation, with a cubic perovskite-type structure with space
group symmetry pm m3 . A tetragonal pyrochlore-type structure of PbWD4 is the only minor phase which could be detected (indicated with * in Figure 3). The relative amounts of perovskite and pyrochlore phases present in each sintered ceramic were calculated from the
intensities of the major X-ray relections from the respective phases.
On this connection, the following approximation was adopted20.
% perovskite
perovskite pyroclore
I Perovskitephase
I I
=
+
(3)
where Ipyrochlore is the intensity of the (222) relection peak of the
pyrochlore phase and Iperovskite is the intensity of the (110) peak of the
perovskite phase respectively, these being the most intense relections
in the XRD patterns of each phases [JPCDS #40-0374]. Results of the analysis are condensed in Table 1.
Figure 3. Room temperature XRD patterns for a) PFW; b) PFW-10 PT; c) PFW-20 PT; and d) PFW-30 PT sintered ceramics. SEM microstructure of (1-x)Pb(Fe2/3W1/3)D3-xPbTiD3 (x = 0,20) ceramics.
Table 1. Percentage of perovskite phase, lattice parameter, relative densities and resistivity for PFW ceramics with various PT contents.
Sample Perovskite phase
(%)
a (Å)
Theoretic density (g.cm–3)Relative density
(%)
ρ (Ω.m)
PFW 99.4 3.98837 8.91 96.7 1.13 × 10⁴
PFW 10 PT 99.0 3.98435 8.81 98.1 7.25 × 10⁷
PFW 20 PT 98.5 3.97927 8.71 99.1 1.56 × 10⁸
PFW 30 PT 98.5 3.98034 8.56 99.6 7.28 × 10⁷
It has been commented that a single perovskite phase is dificult
to obtain for pure PFW using the conventional mixed-oxide method, but the X-ray diffraction patterns showed that the pyrochlore phase was in very small amount for the PFW-PT solid solutions obtained using the two step method.
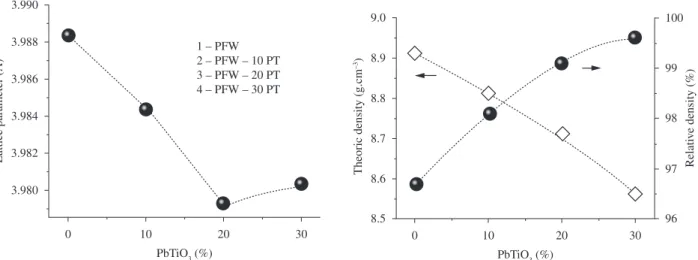
The variation of the relative and theoretical density and cell parameters as a function of the PT content for PFW-PT ceramics is presented in Figure 4. Densities of about 93-99% of the theoretic values could be achieved following the procedure described before. The theoretic densities were calculated considering the nominal
composition (Equations 1 and 2) and the cell volume obtained from
the XRD patterns, assuming a cubic symmetry. Cell parameters decrease up to 20% PT and increase for the sample with 30% PT. The small increase of the cell parameter for the sample PFW-30 PT is related to the formation of a phase with a pseudo-tetragonal symmetry. The highest density was obtained for the sample containing the higher percentage of PT, indicating that the addition of PT helps to increase
the densiication of the samples. The theoretical density decreases
with PT addition.
High degrees of densiication could also be inferred by the MEV
observation of the polished surfaces. The microstructure of the x = 0.20 sample, representative for all investigated samples, is shown in Figure 4. The average grain size was around 5 μm for all samples. The variations of the room temperature electric resistivity with the PT content are listed in Table 1. The resistivity initially increases as the %PT is increased, reaches the maximum of 1.56 × 10⁸ Ω.m for 20% PT, and decreases for higher PT content. Electric dc conductivity as a function of the temperature for the PFW and PFW-PTsamples is shown in Figure 5a. The bars of experimental errors are less than the represented experimental points. The temperature dependence
Figure 5. Temperature dependence of electrical dc conductivity; for PFW ceramics with various contents of PT.
Figure 6. a) Relative dielectric permittivity at various frequencies as a
function of the temperature for PFW ceramic; and b) Dielectric permittivity at 100 kHz as a function of temperature for (1-x)Pb(Fe2/3W1/3)D3-xPbTiD3 solid solutions (0 ≤ x ≤ 0.30).
with the concentration ratio of cation and anion vacancies. Of in the crystal lattice anion vacancies predominate over cation vacancies, a perovskite exhibits electron conduction (n-type); if cation vacancies dominate it exhibits hole conduction (p-type). Thought Hall effect measurements, they showed that the main carriers in PFW ceramics are holes and related to lead losses during the sintering process and formation of cation vacancies and to a change in the degree of Fe oxidation.
Dielectric permittivity as a function of the temperature for “pure” PFW ceramic is presented in Figure 6a. These curves are representative and similar to those measured in the other samples. On the range 150-700 K real and imaginary components present a strong
dependence on the frequency and at least two peaks can be assigned
to the curves. The peak around 180 K, which is attributed to the ferroelectric-paraelectric transition (FE), increases the temperature
of its maximum with the measuring frequency (Figure 6a). As
the PT content in the (1-x)PFW-xPT solid solutions is increased, the maximum dielectric permittivity, corresponding to the FE
(PFW) to TC = 320 K for x = 0.3, while the character of the phase transition changes from diffuse, typical for relaxors, to a sharp one, characteristic of “normal” ferroelectrics.
The peaks observed in the real and imaginary part in Figure 6, at temperatures higher than those related to the FE transition (in the range 200-700 K), shift as well towards higher temperatures with
increasing frequency. The maximum permittivity values decreased as frequency was raised. This result suggests a thermally activated relaxation process, which also appear for the PT modiied samples.
This was attributed to the conductivity effects due to electronic charges21,24. These charges would arise from the Fe+3 ions (dn), which are usually combined with Fe+2 ions to form charge defects. Electron hopping between Fe+3/Fe+2 ions would responsible for the conductivity, which in turn give rise to the dielectric dispersion. A
detailed impedance spectroscopic study is required to analyze the
contributions of different electrically active parts and it will be an objective of other works.
The magnetic proprieties in the (1-x)PFW-xPT ceramic system, with x = 0, 0.10, 0.20, 0.30 have been investigated by measuring
the magnetization as a function of temperature and magnetic ield.
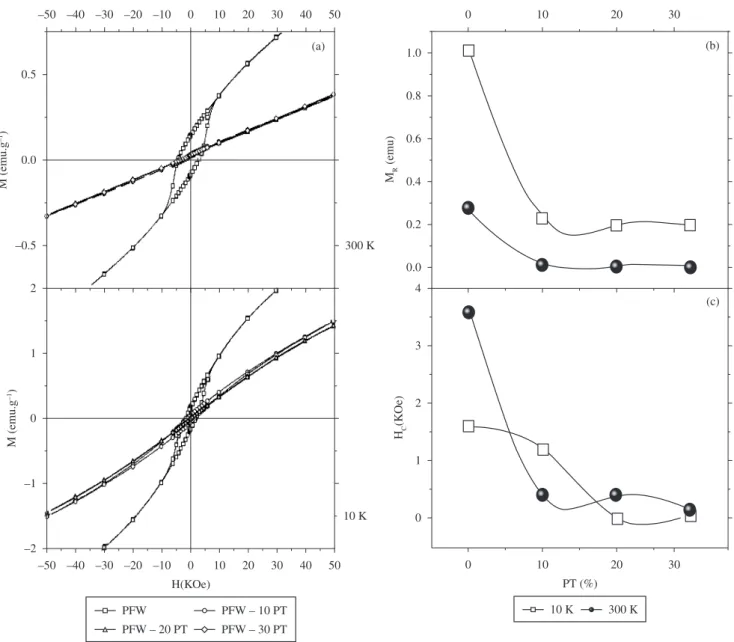
Figure 7 shows the magnetic hysteresis loops M(H) recorded at 10 and 300 K for PFW-PT ceramics that presents a temperature dependent magnetic activity in these systems, demonstrating the existence of weak ferromagnetism at low temperature for all samples. For PFW pure samples, this ferromagnetism persists in all temperature interval. From the DRX measurements there is no evidence of segregation of iron or iron oxide-related phases coexisting with perovskite phase in the sample. This suggests that the observed magnetic responses must to be associated to the PFW pure phase. For PT contain samples, a
quasi linear relationship of the magnetization vs. magnetic ield
was obtained, for 150 and 300 K, i.e., in antiferromagnetic and paramagnetic phase.
The weak ferromagnetism at room temperature in PFW samples, in the antiferromagnetic phase, probed by a remanent magnetization, arises due the canted antiferromagnetic interaction in which the magnetic moment of two opposite sublattices are not exactly antiparallel aligned. The occurrence of Fe2+ and oxygen vacancies
during the sintering and a signiicant difference in valence state
Figure 8. Temperature dependence of magnetic moment M(T) (dc measurements) for a) PFW; and b) m’(T) (ac measurements) for PFW-PT system, x = 0.10; c) 0.20; and d) 0.30.
and ionic size (radius) of Fe3+ and Fe2+ has produced even a small distortion in the structure of PFW, leading to the weak magnetization of PFW. Ot is important to take into account that the PFW samples prepared in different conditions can have different degree of ion disorder, and, correspondingly, different magnetic behavior26.
The temperature dependence of the remanent magnetization (MR) and magnetic coercive ield (Hc) are presented in Figure 7b. MR changes to 0.26 at 300 K from 1.0 emu.g–1 for PFW and for from 0.19 emu.g–1 at 10 K to 0.004 emu.g–1 for PFW-30 PT, showing tendency to zero with increasing PT content at all temperatures.
However, the remanent magnetization is different from zero and decrease with PT content as the PT content increases. This tendency is oppositely to that presented in the literature at 10 K for single crystals9 where the remanent magnetization increased as the PT content increased from 0 to 30.
Two types of magnetic orders have been observed on the temperature dependence of magnetization which arises from different magnetic interactions (Figure 8). The low temperature magnetic order corresponding to the weakly ferromagnetic to antiferromagnetic order transitions occurs at TN2 = 10 to 17 K for x = 0-0.30 respectively. The high temperature ordering referred to antiferromagnetic to paramagnetic transition appears at TN1 = 360, 274, 161 and 134 K for x = 0, 0.10, 0.20, 0.30. Bokov et al.25,26 by simulations, assuming different degrees of disorder of the Fe and W ions in the octahedral sites of the PFW lattice, extracted information
about its antiferromagnetic properties. From the calculation with the assumption of a completely disordered Fe and W ions arise TN = 406 K, while the experimental values for PFW single crystal TN is 363 K. They concluded that if the ion-order degree is different, the properties (such as temperatures transitions and ferroelectric and magnetic proprieties) will be also different. The difference of the calculated and experimental values of TN, and between different ceramic samples prepared from different methods can be connected with a partial ion disordering in PFW, which is an additional support to consider a canted antiferromagnetic interaction.
There are two factors that affect the magnetic transition in PFW-PT system: the dilution of the concentration magnetic ion Fe3+ by
the addition the non magnetic component PT and, consequently,
the change in distances of the adjacent Fe3+ ions due to lattice changes. The magnetic interactions that give rise to the observed behavior might be ascribed as follows: in the Fe/W ordered region, a weak superexchange of -Fe3+-D-W-D-Fe3+ type of interaction responsible for the magnetic anomaly at low-temperature TN2 and at high temperatures, in the Fe/W disordered regions, a stronger superexchange of -Fe3+-D-Fe3+ pathway interaction is responsible for the magnetic ordering at higher temperatures TN1.
rapidly decreases from 350 K x = 0 to 170 K x = 0.2, and above x = 0.25, no antiferromagnetic phase transition was distinguished8. Dn the other hand, in single crystals, was only observed a small decrease in TN2 with rising x was, and TN1 was detected even at higher PT concentration TN2 = 274 K at x = 0.27[9]. The unusual increase in TN2 with x was observed in PFW-xPT ceramics and was qualitatively
conirmed in single crystals, but the TN2 values are practically smaller in crystals than in ceramics TN2 = 12.5 K for x = 0.27 in crystals and TN2 = 25 K for x = 0.25 in ceramics.
4. Conclusions
A two-stage solid-state reaction turned out to be appropriate for the formation of the majoritary PFW phase as well as PFW-PT solid solutions, with low percentage of spurious phases, high densities, dielectric constant and electric resistivity. Dielectric properties could be tailored by adding PbTiD3 in PFW composition to form (1-x) Pb(Fe2/3W1/3)D3-xPbTiD3 ((1-x)PFW-xPT) solid solution, bringing the ferroelectric transition up to the room temperature and transform the phase transition from diffuse, typical for relaxors, to a sharp one, characteristic of “normal” ferroelectrics. Ot was found that PT additions decreased the electric conduction of the PFW ceramic. Samples with 20% PT showed the best conditions combined pure phase, density and resistivity, added to excellent dielectric properties and ferroelectric-paraelectric transition temperature close to room temperature. The presence of loss anomaly at high temperature in all PFW-PT samples is related to charge hopping.
Two types of superexchange magnetic interactions and a succession of magnetic transitions with Néel temperatures dependent on the composition were found in the solid solution.
Acknowledgements
The authors wish to thank FAPESP for the inancial support (Proc.
2008/04025-0 and 2010/11187-6), to Prof. Yvonne P. Mascarenhas (Crystallography Group of the Physics Onstitute of USP-São Carlos) for the use of the XRD Lab facilities and to Mr. Francisco J. Picon
and Mrs. Natalia A. Zanardi for the technical assistance.
References
1. Ovanov SA, Eriksson SG, Tellgrend R and Rundlof H. Neutron powder diffraction study of the magnetoelectric relaxor Pb(Fe2/3W1/3)D3. Materials
Research Bulletin. 2004; 39:2317-2328.
2. Mitoseriu L, Vilarinho PM, Viviani M and Baptista JL. Structural study of Pb(Fe2/3W1/3)D3-PbTiD3 system. Materials Letters. 2002; 57:609-614. http://dx.doi.org/10.1016/S0167-577X(02)00839-X
3. Hong C-S, Chu S-Y, Li B-J, Su W-C, Chang R-C, Nien H-H et al. Onvestigation of the dielectric properties of MnD-additive Pb(Fe2/3W1/3 )-PbTiD3 relaxors using the spin-glass model. Journal of Applied Physics. 2008; 103:094102-094108. http://dx.doi.org/10.1063/1.2903511
4. Liou Y-C. Effect of heating rate on properties of Pb(Fe1/2Nb1/2)D3 ceramics produced by simpliied wolframite route. Ceramics International. 2004; 30:567-569. http://dx.doi.org/10.1016/j.ceramint.2003.09.008
5. Fiebig M. Revival of the magnetoelectric effect. Journal of Physics D: Applied Physics. 2005; 38:123-152. http://dx.doi.org/10.1088/0022-3727/38/8/R01
6. Mitoseriu L, Stancu A, Fedor C and Vilarinho PM. Analysis of the composition-induced transition from relaxor to ferroelectric state in PbFe2/3W1/3D3–PbTiD3 solid solutions. Journal of Applied Physics.
2003; 94:1918-1925. http://dx.doi.org/10.1063/1.1586470
7. Ovanov SA. Structural, magnetic and Mossbauer spectroscopic investigations. Solid State Sciences. 2007; 9:440-450. http://dx.doi. org/10.1016/j.solidstatesciences.2007.03.018
8. Mitoseriu L, Marré D, Siri AS and Nanni P. Magnetic properties of PbFe2/3W1/3D3-PbTiD3 solid solutions. Applied Physics Letters. 2003; 83:5509-5511. http://dx.doi.org/10.1063/1.1632033
9. Feng L, Guo H and Zuo-Guang Y. Magnetic ordering in relaxor ferroelectric (1-x)Pb(Fe2/3W1/3)D3-xPbTiD3 single crystals. Journal of Materials Research. 2007; 22:2116-2124.
10. Lu CH, Shinokasi K, Mizutani N and Kato M. Liquid-phase formation in reaction process of 3PbD.Fe2D3.WD3. Journal of the ceramic Society of Japan. 1989; 97:97115-20.
11. Mizutani N, Lu C H, Shinokasi K and Kato M. Formation of a high-temperature liquid phase during the sintering of Pb(Fe2/3 W1/3)D3.
Journal of the American Ceramic Society. 1990; 7:1214-20. http://dx.doi. org/10.1111/j.1151-2916.1990.tb05182.x
12. Khim AS, Wang J, Wan D, Li L and Xue J. Mechanical Activation-Assisted Synthesis of Pb(Fe2/3W1/3)D3. Journal of the American Ceramic Society. 2000; 83(7):1575-80.
13. Kong LB,Zhang TS, Ma J and Boey F. Progress in synthesis of ferroelectric ceramic materials via high-energy mechanochemical technique. Progress in Materials Science. 2008; 53:207-322.
14. Khim AS, Wang J and Junmin X. Seeding effect in the formation of Pb(Fe2/3W1/3 )D3 via mechanical activation of mixed oxides. Solid State
Ionics. 2000; 132:55-61.
15. Khim AS, Junmin X and Wang J. Pb(Fe2/3W1/3 )D3 by mechanical activation of coprecipitated PbD, Fe2D3 and WD3. Journal of Alloys and
Compounds. 2002; 343:156-16.
16. Swartz SL and Shrout TR. Dielectric properties of pyrochlore lead magnesium niobate. Materials Research Bulletin. 1982; 17:1245-1250. http://dx.doi.org/10.1016/0025-5408(82)90159-3
17. Pinheiro JMV and Mascarenhas YP. Dois programas computacionais úteis em difratometria de raios-x por amostras policristalinas. On: Anais da 37a Reunião Anual da SBPC; 1985; Belo Horizonte. SBPC; 1985.
18. Chung-Hsin L and Yeak-Chong W. Fabrication of Ferroelectric Lead Oron Tungstate Ceramics Via a Two-Stage Solid-State Reaction. Ceramics International. 1995; 21:413-419. http://dx.doi.org/10.1016/0272-8842(02)72884-N
19. Kingery WD and Narasimhan MD. Densiication during Sintering in the Presence of a Liquid Phase. II. Experimental. Journal of Applied Physics. 1959; 30:307-310. http://dx.doi.org/10.1063/1.1735156
20. Fang B, Sun R, Shan Y, Tezuka K and Omoto H. Dn the feasibility of synthesizing complex perovskite ferroelectric ceramics via a B-site oxide mixing route. Journal of Materials Science. 2007; 42:9227-9233. http:// dx.doi.org/10.1007/s10853-007-1908-z
21. Szwagierczak D and Kulawik J. Inluence of MnO2 and Co3O4 dopants on dielectric properties of Pb(Fe2/3W1/3)D3 ceramics. Journal of the European Ceramic Society. 2005; 25:1657-1662. http://dx.doi.org/10.1016/j. jeurceramsoc.2004.05.022
22. Feng L and Ye ZG. Phase Diagram and Phase Transitions in the Relaxor Ferroelectric Pb(Fe2/3W1/3)D3-PbTiD3 System. Journal of Solid State Chemistry. 2002; 163:484-490. http://dx.doi.org/10.1006/jssc.2001.9433 23. Zhou L, Vilarinho PM and Baptista JL. Ordering in Lead Iron Tungstate
Relaxor Ceramics. Journal of the European Ceramic Society. 1998; 18:1383-1387. http://dx.doi.org/10.1016/S0955-2219(98)00025-9 24. Raymond O, Font R and Portelles J, Suárez-Almodovar N, Siqueiros JM.
Frequency-temperature response of ferroelectromagnetic Pb(Fe1/2Nb1/2)D3 ceramics obtained by different precursors. OOO. Dielectric relaxation near the transition temperature. Journal of Applied Physics. 2006; 99:1241011-1241019. http://dx.doi.org/10.1063/1.2201853
25. Osupov VA. Peculiarities of the PbB2/3 2+B
1/3 6+D
3 perovskites. Ferroelectrics. 2005; 315:149-16. http://dx.doi.org/10.1080/00150190490891463