Efect of Aluminium Addition on the Magnetic Properties of a Semi-Processed Electrical Steel
Kleiner Marques Marraa*, Lívia Carneiro Marrab, Vicente Tadeu Lopes Buonoc
Received: October 30, 2015; Revised: July 18, 2016; Accepted: August 11, 2016
Aluminum is often added to electrical steels since this element causes improvement of the magnetic properties. However the addition of aluminum is usually limited to 0.30 wt%1. Therefore, this work aimed at evaluating the inluence of higher levels of aluminum in the magnetic properties of semi-processed steels. To accomplish this, four types of steel were produced in laboratory with diferent
aluminum contents (0.10, 0.30, 0.60 and 1.0 wt%). Carbon, manganese and silicon concentrations were kept constant. It was observed that an increased aluminum content caused reduction of the magnetic core loss, especially of the eddy current component. However, the magnetic permeability virtually
wasn’t inluenced by aluminum concentration.
Keywords: magnetic core loss, magnetic permeability, aluminum addition, semi-processed electrical steel.
* e-mail: [email protected]
1. Introduction
Grain non-oriented (GNO) electrical steel is employed
mainly to the cores of electric generators and motors.
GNO steels are suitable for this application because of the
small anisotropy of magnetic properties. Within this class
of materials, there is the semi-processed electrical steel,
which is usually supplied as cold rolled sheet and, in this condition, has inadequate magnetic properties2,3. These
properties are enhanced through heat treatments carried out by the fabricators of motors and generators, commonly denominated decarburization treatment. This sort of treatment results in a reduction of the carbon content, as well as in a decrease in the residual stress level, the formation of a thin oxide layer on the sheet surface, and the occurrence of secondary recrystallization with an expressive grain growth and improvement of the crystallographic texture3.
Regarding the chemical composition, carbon, sulfur,
nitrogen, and oxygen are commonly present in GNO steel
in low concentration, and their presence is inherent to the steel production process. Such elements are very harmful to magnetic properties. Carbon forms iron carbides, which cause an increase in the hysteresis loss and a reduction in magnetic permeability4. Additionally, carbon in solid
solution may precipitate owing to the warming of the generators and motors core, and this leads to the magnetic aging phenomenon4,5. Sulfur and nitrogen yield MnS and AlN particles in the metal matrix and, in turn, oxygen is
present as oxide inclusions. All aforementioned second phase particles are injurious to the magnetic characteristics because they hamper the movement of the magnetic domains,
especially when they occur in diameters as small as tenths of micrometers6. If thinner, such particles play the role of
inhibitors of grain growth during the steel decarburization treatment, yielding small grains and resulting in inadequate magnetic properties7.
On the other hand, the controlled addition of certain elements which form substitutional solid solution with iron can promote the improvement of magnetic properties. Therefore, Si, Mn, P and Al are usually added to cause an increase in the electrical resistivity. However, the use of such elements should be made in a controlled manner, as, when in excess, they can reduce the saturation magnetic polarization.
Aluminum, in particular, besides increasing the electrical resistivity, also decreases the temperature range in which austenite exists (ferritizingefect) and, when in high concentrations, stabilizes and reduces the dissolution
of the AlN precipitate, mainly during the steel hot rolling. The latter efect is important for weakening the formation of ND//{111} texture (“gamma iber”), which is not suitable
for magnetic properties1,8,9.
Therefore, this study aimed at evaluating the efect of
high levels of aluminum concentration on the magnetic
properties of semi-processed steel.
2. Experimental Procedure
The pilot scale production of the semi-processed electrical steels was irstly carried out with the casting of four small
ingots (50kg) in a vacuum melting furnace. Diferent chemical
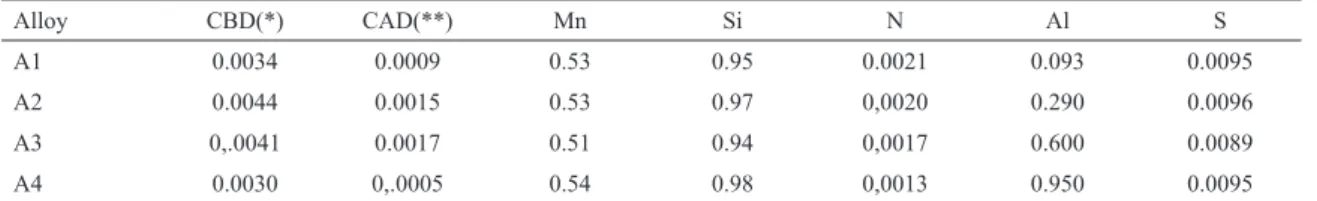
compositions were obtained in accordance to aluminum content, as shown in Table 1. It can be noticed that all alloys display low levels of carbon, sulfur and nitrogen,
aDepartment of Mechanical Engineering, Centro Universitário UNA, Belo Horizonte, MG, Brazil bDepartment of Chemical Engineering, Universidade Federal de São João Del Rei, Ouro Branco, MG, Brazil
cDepartment of Metallurgical and Materials Engineering, Universidade Federal de Minas Gerais,
Alloy CBD(*) CAD(**) Mn Si N Al S
A1 0.0034 0.0009 0.53 0.95 0.0021 0.093 0.0095
A2 0.0044 0.0015 0.53 0.97 0,0020 0.290 0.0096
A3 0,.0041 0.0017 0.51 0.94 0,0017 0.600 0.0089
A4 0.0030 0,.0005 0.54 0.98 0,0013 0.950 0.0095
Table 1: Chemical composition (% mass).
(*) CBD: carbon content before decarburization. (**) CAD: carbon content after decarburization.
Figure 1: Electrical resistivity calculated by ASTM A 712-98 Standard.
Table 2: α/γ transformation temperatures.
Alloy AC1 (ºC) AC3 (ºC)
A1 910 975
A2 960 1015
A3 1010 1110
A4 >1150 >1150
and practically the same manganese and silicon contents. Aluminum was increased from A1 alloy (about 0.1 wt%) to A4 alloy (about 1.0 wt%).
The hot rolling was carried out in two stages: roughing
and inishing. Firstly, the ingots were reheated in a mule
furnace and kept there at 1110oC for 180 minutes. They were
then hot rolled in a laboratory rolling mill through a sequence of 11 reversible passes, and their thickness was reduced from 135 mm to 35 mm. The materials were air cooled to room temperature, then heated again to 1100oC and kept at this
temperature for 1.0 hour. Afterward, the second stage of hot
rolling was conducted by targeting the inishing temperature
at 850oC, which resulted in a thickness of 7.0mm.
The hot coiling was simulated by putting the material
inside a mule furnace at 750°C for 1.0 hour, after which the furnace was turned of so as to cool the materials to
room temperature.
Before undergoing cold rolling, the thickness was reduced from 7.0mm to 2.2mm by machining. After that, cold rolling
was carried out in order to obtain a inal thickness of 0.5
mm, i.e. 77% thickness reduction. The operation was also conducted using a laboratory rolling mill.
To simulate bath annealing, cold rolled samples underwent a thermal cycle, which consisted of 17oC/h heating rate,
soaked at 660oC for 7.0 h, and cooled at a rate of 12oC/hour.
After bath annealing, a typical skin pass rolling for
semi-processed steels was used, i.e. 6% thickness reduction. The decarburization treatment was executed in a mule
furnace, under natural atmosphere conditions and at a 120oC/h
heating rate, in a way that it soaked at 760oC for 2 hours and
cooled at a rate of 90oC/h.
Samples of semi-processed electrical steels were
evaluated via quantitative metallography (i.e. microstructural observation and average ferritic grain size measurement),
determination of α/γ transformation temperature (Ac1 and
Ac3), and assessment of crystallographic texture and magnetic properties (core magnetic loss and magnetic permeability at 1.5 Tesla and 60 Hz).
Ac1 and Ac3 transformation temperatures were determined
through analyses which were carried out in a DIL
805A/D-Bähr dilatometer.
Crystallographic texture has been evaluated by measuring
{110}, {200} and {222} direct pole igures using an x-ray – X Siemens difractometer, D5000 model, under Mo Kα1 radiation and by the Schulz back relection method. From
the direct pole igures was derived the ODF (orientation distribution function), and the following texture ibers were
obtained in section equivalent to φ2 at 45°: (<110>//RD), (<100>//ND), ({hkl}<001>), and (<111>//ND).
Because of the small width of cold rolled samples, magnetic properties were measured only along the rolling
direction with the use of an Epstein Frame coupled with a Brockhauss Messtechnik equipment, MPG 100 D model.
3. Results and Discussion
After the decarburization treatment, the carbon content was very low for all the alloys, below 18 ppm (Table 1).
Figure 1 shows the electric resistivity values for all
steels, calculated according to the equation given by the
ASTM A-98 712 Standard, which takes into account only
aluminum and silicon contents. As expected, the increased aluminum content led to a steady rise of electrical resistivity.
The α/γ critical transformation temperatures, Ac1 and, Ac3, which indicate the conditions of the ferrite/austenite
Figure 2: Grain size evolution during steels fabrication. Ferritic grain size progress during the material processing can be seen in Figure 2. After decarburization, there was full grain
growth for all alloys (the average grain size was bigger than 90 µm), and it is worth noting a tendency of grain size reduction
with increasing aluminum content. This efect might be linked to the increase in the amount of precipitate (especially AlN) from A1 to A4 steel. Fine precipitates can hinder the kinetic of
grain growth during decarburization treatment3,4. As hot rolled
or annealed condition, the steel samples showed smaller grains
without clear inluence of aluminum concentration.
Figure 3: Fiber igures: (a) Alfa, (b) Gamma, (c) Cubic and (d) RD’.
Regarding crystallographic texture, Figure 3 shows the main texture ibers for electrical steels, i.e. three suitable components for magnetic properties: alfa iber (<110>//RD), cubic iber (<100>//ND) and RD’ iber ({hkl}<001>), and an unsuitable component: gamma iber (<111>//ND)8. The evaluation of the area under the “iber curves” by mathematical
numeric integration, according to the Simpson’s rule10, can be seen in Figure 4. The results can hence be interpreted as indicators of the incidence of each type of iber. As shown in Figure 4, the higher the aluminum content, the more attenuated
all components, which resulted in a texture randomization.
As to the magnetic properties, Figure 5, there was a clear
trend towards reduction in the magnetic core loss (at 1,5T and
60Hz) with the increase in the aluminum concentration. For
a better analysis of this behavior, the core loss was separated
in two parts: (i) the classic eddy-current component and (ii)
the hysteresis component, using the Bertoti Method11. This
method doesn’t consider the anomalous component.
Figure 6 shows that increasing aluminum content considerably decreased the eddy-current component. Certainly,
this was mainly due to increased electrical resistivity.However,
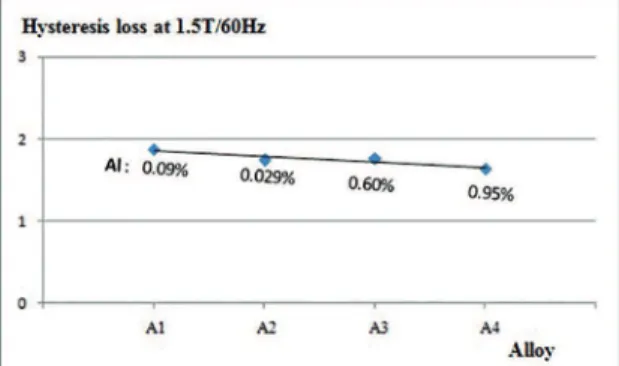
Figure 7 presents the progress of the hysteresis component,
Figure 4: Incidence of each type of iber.
Figure 5: Variation of magnetic core loss in function of Al content.
Figure 6: Variation of eddy-current loss as function Al content.
Figure 7: Variation of hysteresis loss as function Al content.
caused a discreet reduction on this magnetic loss component, despite the texture randomization and probable increased presence of second phase particles in the metallic matrix3,9,11.
Magnetic permeability (at 1,5T and 60Hz), shown in
Figure 8, displayed no clear trend towards variation with
the aluminum content and reached a plateau. The negligible
efect of aluminum content on the magnetic permeability can be justiied by two arguments: (i) this property is not strongly afected by precipitates under high induction values (like 1,5T), and (ii) other “suitable” components of crystallographic
texture were possibly created after decarburization treatment, with the randomization process.
4. Conclusion
The produced semi-processed electrical steels reached
full ferritic grain growth after decarburization treatment. With respect to electrical resistivity, the increase in the Al content promoted a steady rise of this property.
Concerning crystallographic texture, it was observed that the increase in aluminum content caused a strong
attenuation of gamma iber, alfa iber, cubic iber, and RD’ iber.
Regarding the magnetic properties, it was seen that the aluminum increased addition led to the reduction of
the magnetic core loss and did not signiicantly change
the magnetic permeability. The magnetic core loss
variation might be justiied by the efect of aluminum
on the electrical resistivity. With respect to the magnetic permeability, the texture randomization and probable more intense presence of second phase particles caused by increased aluminum content did not have a strong
negative efect on it.
Therefore, the alloy with higher concentrations of Al, around 1%, exhibited the best magnetic properties
along the rolling direction, i.e. core loss around 3,5W/
kg (1.5 Tesla and 60 Hz) and permeability next to 4000
G/Oe (1.5 Tesla and 60 Hz).
5. References
1. Nakayama T., Honjou N. Efect of aluminum and nitrogen on the magnetic properties of non-oriented semi-processed electrical
steel sheet. Journal of Magnetism and Magnetic Materials.
2000;213(1-2):87-94.
2. Barros J., Targhetta A., León O., Ros T., Schneider J., Houbaert Y. Efect of temper rolling on the texture formation and magnetic properties of non-oriented semi-processed electrical steel. Journal of Magnetism and Magnetic Materials.2007;316(2):e865-e867.
3. Marra K.M., Alvarenga E.A., Buono V.T.L. Decarburization kinetics during annealing of a semi-processed electrical Steel. ISIJ International.2004;44(3):618-622.
4. Marra K.M., Alvarenga E.A., Buono V.T.L. Magnetic aging anisotropy of a semi-processed non-oriented electrical steel. Materials Science and Engineering: A. 2005;390(1-2):423-426. 5. Sidor Y., Kovak F. Efect of heat treatment conditions on the
internal and external oxidation processes in non-oriented electrical steels. Materials & Design. 2005;26(4):297-304.
6. Michal G.M., Slane J.A. Carbide precipitation in electrical steels. JOM The Journal of The Minerals, Metals & Materials Society
(TMS). 1986;38(1):32-36.
7. Vanherpe L., Moelans N., Blanpain B., Vandewalle S. Pinning efect of spheroid second-phase particles on grain growth studied by three-dimensional phase-ield simulations. Computational Materials Science. 2010;49(2):340-350.
8. Kestens L., Jacobs S. Texture control during the manufacturing of non-oriented electrical steels. Texture, Stress, and Microstructure.
2008; 2008:173083.
9. Park, J.T., Development of annealing texture in nonriented electrical steels. Doctoral Thesis, Department of Mining,
Metals and Materials Engineering, McGill University, Montreal, Canada; 2002, 192p.
10. Davis P.J., Rabinowitz P. Methods of numerical integration. New York:Academic Press; 1984. 632p.
11. Bertotti G. General properties of power losses in soft ferromagnetic materials. IEEE Transactions on Magnetics.