S
C
I
E
N
T
I
F
I
C
-T
E
C
H
N
I
C
A
L
Time domain NMR evaluation of poly(vinyl alcohol)
xerogels
Elton Jorge da Rocha Rodrigues
1, Maxwell de Paula Cavalcante
1and Maria Inês Bruno Tavares
1*
1
Centro de Tecnologia, Instituto de Macromoléculas Professora Eloisa Mano – IMA,
Universidade Federal do Rio de Janeiro – UFRJ, Rio de Janeiro, RJ, Brazil
*[email protected]Abstract
Poly(vinyl alcohol) (PVA)-based chemically cross-linked xerogels, both neat and loaded with nanoparticulate hydrophilic silica (SiO2), were obtained and characterized mainly through time domain NMR experiments (TD-NMR). Fourier-transform infrared (FT-IR) and wide angle X-ray diffraction (WAXD) analyses were employed as secondary methods. TD-NMR, through the interpretation of the spin-lattice relaxation constant values and related information, showed both cross-linking and nanoparticle inluences on PVA matrix. SiO2 does not interact chemically with the PVA chains, but has effect on its molecular mobility, as investigated via TD-NMR. Apparent energy of activation, spin-lattice time constant and size of spin domains in the sample have almost linear dependence with the degree of cross-linking of the PVA and are affected by the addition of SiO2. These three parameters were derived from a single set of TD-NMR experiments, which demonstrates the versatility of the technique for characterization of inorganic-organic hybrid xerogels, an important class of materials.
Keywords: inorganic-organic hybrid, polymer gels, relaxometry, low-ield nuclear magnetic resonance, time domain
nuclear magnetic resonance.
1. Introduction
Time domain nuclear magnetic resonance (TD-NMR) – also known as relaxometry, wideline or low-field nuclear magnetic resonance (LF-NMR) – is a rapid and inexpensive way to characterize polymeric materials. It is based on the measurement of the time necessary for relaxation to equilibrium of a magnetized atomic nucleus in a nuclear magnetic resonance experiment[1-3]. This process is related to the molecular dynamics of the sample and can reveal many factors acting on the polymer matrix, such as variations in crystallinity, blending of two or more polymers, presence of plasticizing agents or fillers, cross-linking and others[1,4-8]. This versatile tool has been applied in various fields, such as determination of physico-chemical parameters of crude oil samples, polymer-filler interactions in rubber materials, and reaction monitoring and quality assurance in industrial processes, to cite a few examples[9-12].
Polymeric gels are networks containing physically and/or chemically cross-linked segments which can halt the long distance rearrangements between the polymer chains that are responsible for the material’s dissolution and plastic deformation[13]. When polymeric gels are not filled with fluids, they are dubbed xerogels[14]. This class of polymeric material has many applications, such as in tissue engineering, drug delivery, prosthetics and membranes applied in separation processes [14-16].
Various efforts have been made to characterize polymeric gels through TD-NMR[15,17-22], but the majority of the reported methods involve soaking the sample in a solvent[14,19,23,24], with the analysis being conducted under strict temperature conditions[18,20,21], or limiting the chemical nature of the polymeric matrix to elastomers[6,12,18-21].
In this work, we obtained xerogels based on chemically cross-linked poly(vinyl alcohol) (PVA) and PVA loaded with nanoparticulate hydrophilic silica (SiO2). These materials were characterized by LF-NMR techniques and supporting spectroscopic characterization methods, such as Fourier-transform infrared (FT-IR) and wide angle X-ray diffraction (WAXD). Our aim was to use the information obtained mainly through TD-NMR to qualify and quantify the changes caused by cross-linking and inorganic filling of the PVA matrix.
2. Experimental
2.1 Materials
PVA (99+% hydrolyzed), Mw: 89,000-98,000 g.mol–1 and glutaraldehyde (GA) (25% m/m in H2O) were supplied by Sigma-Aldrich. Hydrochloric acid (HCl) (37% w/w) was obtained from Vetec, Brazil. SiO2, composed of 12 nm radius particles, was supplied by Degussa. Deionized water was employed during all necessary steps. All reagents were used as received.
2.2 Sample preparation
were homogeneously suspended. Then, a volume of GA enough to induce 1%, 5% and 10% of nominal cross-linking, based on the molar mass of PVA’s repeating unit, was added to the acidified solutions. Finally, the contents of the six aliquots were poured into polystyrene Petri dishes, covered and left in a fume hood at room temperature for five days to allow completion of the chemical cross-linking reaction. After this period, the gels were thoroughly washed with deionized water and put in a vacuum oven at 45 °C for 2 days. Additionally, for comparison, a film of neat PVA and one of PVA/SiO2 were produced following the same procedure, except for the acidification and the addition of GA steps. All the materials were stored in a desiccator under vacuum until needed for tests. Table 1 reports the naming scheme of the gels and polymeric films.
2.3 FT-IR analysis
The analysis was conducted on 1-mm thick films to investigate changes caused by the cross-linking reaction to the polymeric matrix, as well as interactions between PVA and SiO2. The test was run in a Varian Excalibur FT-IR spectrophotometer, with a zinc selenide crystal for ATR measurements, having the following acquisition parameters: 100 scans, 4 cm–1 spectral resolution, sampling between 600 and 4000 cm–1.
2.4 WAXD analysis
Films similar to those employed for FT-IR measurements were subjected to WAXD analysis to verify changes in the molecular order of the PVA, using a Rigaku Miniflex diffractometer, operating with Cu Kα band (1,5418 Å wavelength) radiation. The 2θ angle was varied between 5° and 50°, with sweep speed of 0.05°.s–1.
2.5 TD-NMR analysis
Relaxometry was employed to assess the samples’ molecular dynamics through spin-lattice relaxation processes. All spectra were obtained in a Maran Ultra spectrometer, with an 18 mm magnet bore, operating at 0.54 T (23.4 MHz for 1H) and equipped with a heating/cooling module. The samples were shredded in a mill for better conditioning inside the glass tube used as sample holder. The masses of each sample were measured to be similar to each other, so that the results could be better compared.
2.5.1 Spin-lattice relaxation constant determination
The inversion-recovery pulse sequence was chosen to extract the samples’ spin-lattice relaxation time constant, T1. The data were processed in commercial software packages, namely WinFit version 2.4.0.0 and Origin version 8.5. Table 2 shows the analytic parameters used to measure the samples’ relaxation times.
The T1 values displayed are the average between the results from two runs. This mean value was extracted from fitting the experimental points using Equation 1.
( )
10 1 T
M A A e
−τ
τ = + (1)
where M(τ) is the magnetization as a function of time between 180° and 90° pulses; A0 is the DC offset; A1 is a factor proportional to the number of relaxing proton nuclei in each interval; τ is the time interval between 180° and 90° pulses; and T1 is the spin-lattice relaxation time constant. Four different temperatures – 35, 45, 55 and 65 (±0.1) °C – were employed during the measurements, with the sample being left to equilibrate for 5 minutes at each step.
2.5.2 Spin diffusion path
T1 relaxation times of solid polymers are not determined solely by dynamic processes. Below the glass transition temperature (Tg), spin diffusion also contributes to the relaxation time value. This diffusion can be modeled as Fickian diffusion and can be useful to understand phase separation and to estimate the size of molecular domains. The maximum path of diffusion in a 3D matrix, L, can be approximated via Equation 2.
1 ~ 6
L DT (2)
where D is the spin diffusion coefficient (for polymers, its value is approximately 5×10–16 m2.s–1), which depends on the average distance between protons and dipolar interactions[5,25].
2.5.3 Activation energy through spin-lattice relaxation
The activation energy values (Ea) for molecular relaxation processes occurring in the samples were determined through the method employed by[27]. The spin-lattice relaxation rate can be described by Equation 3.
2 2 2 2
1
1 4
1 1 4
C T
τ τ
=+ + ω τ + ω τ (3)
Table 1. Sample names.
Name Nominal cross‑linking
Percentage of inorganic nanoparticles
PVA 0 0
PVA/SiO2 0 1% (m/m)
P1 1% (m/m) 0
P1A 1% (m/m) 1% (m/m)
P5 5% (m/m) 0
P5A 5% (m/m) 1% (m/m)
P10 10% (m/m) 0
P10A 10% (m/m) 1% (m/m)
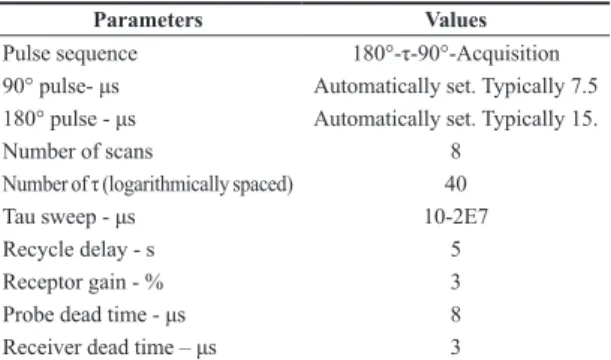
Table 2. Parameters employed in the inversion-recovery pulse
sequence.
Parameters Values
Pulse sequence 180°-τ-90°-Acquisition
90° pulse- μs Automatically set. Typically 7.5
180° pulse - μs Automatically set. Typically 15.
Number of scans 8
Number of τ (logarithmically spaced) 40
Tau sweep - μs 10-2E7
Recycle delay - s 5
Receptor gain - % 3
Probe dead time - μs 8
where τ is the correlation time; ω is the Larmor frequency; and C is a constant that represents the magnitude of the dipolar interaction between protons.
The correlation time can be understood as being thermally excited, as described in Equation 4.
( )
0Ea RT
T e
τ = τ (4)
where EA is the activation energy; R is the ideal gas constant (here 8,314 J.mol–1.K–1); and τ
0 is a pre-exponential factor.
The value of Ea can be obtained by plotting the natural logarithm of the relaxation constant versus the inverse of the absolute temperature[27,28]. The linear regressions were conducted to obtain the coefficients of determination using a routine available in the Origin 8.5 software.
3. Results and Discussion
3.1 Sample analysis
Transparent, colorless, free-standing polymeric films were obtained for PVA and PVA/SiO2 samples. Transparent, slightly yellow, free-standing films were obtained for all xerogels. The cross-linking reaction occurred when hydroxyl groups in the PVA and aldehyde groups in the GA underwent an acid-catalyzed acetalization process, producing acetal and hemiacetal bridges between polymer chains. This process is stochastic in nature and has already been shown to depend on factors such as polymer concentration and reactive group tacticity[15,29,30]. A reaction scheme is shown in Figure 1.
Nanoparticulate hydrophilic SiO2 is an amorphous material with many polar oxygenated groups on its surface. These groups promote high affinity for water, polar solvents and media, such as PVA. However, the SiO2 used in this work has a very small surface area (167.6 m2.g–1, determined through BET N2 sorption), so the extension of the interactions between nanoparticles and polymer matrix is expected to be small. 3.2 FT-IR analysis
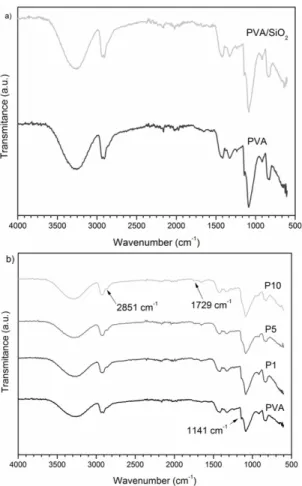
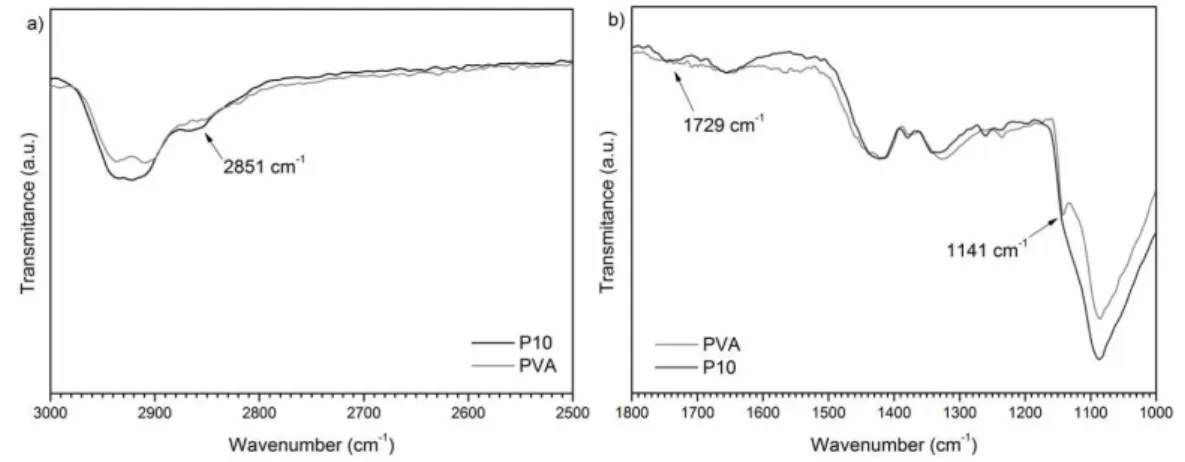
FT-IR spectra of the samples can be observed in Figure 2a, b. PVA absorptions are reported as: secondary alcohol C-O stretching between 1124-1087 cm–1; aliphatic C-H stretching between 2800-3000 cm–1; and OH broad absorption around 3300 cm–1, which contains contributions from hydrogen bonded moieties. The discrete absorption band at 1141 cm-1 was reported as being from stretching modes of C-C or C-O bonds, when PVA presents intramolecular hydrogen bonds[31]. Therefore, this absorption band is associated with spatial order inside the polymer network. The absence of absorptions between 1750-1735 cm–1, typical for ester C=O bands, confirms that this PVA is highly hydrolyzed[31,32]. Comparing the spectra of PVA and of PVA/SiO2 there are no apparent differences, which implies weak intermolecular interactions between the polymer matrix and inorganic nanoparticles (Figure 2a). For better visualization, we selected and expanded regions of the FT-IR spectra from PVA and P10 samples, as shown in Figure 3a, b. All the xerogels display absorption bands at 2850-2750 cm–1 (Figure 3a) and 1720-1750 cm–1 (Figure 3b), corresponding to absorption modes of short-chain aliphatic
aldehyde C-H and aldehyde carbonyls, which indicates some incomplete cross-linking. Although faint, the increase in the intensity of the absorption bands arising from cross-linking and the decrease in the intensity of the 1141 cm–1 band (Figure 3b), relative to spatial order in the PVA matrix, can be distinguished in the spectra. Quantification of the influence of these covalent bonds on the polymeric matrix proved to be somewhat difficult and prone to experimental errors. Furthermore, the technique did not show the apparent effect of the inorganic nanoparticles, due to the absence of strong chemical interactions.
3.3 WAXD analysis
Diffractograms of all the samples are displayed in Figure 4. Even though PVA does not form crystallites in the strict sense, it does display highly ordered domains that arise
Figure 1. Reaction scheme for the formation of chemical
cross-linking between PVA chains and GA.
because of the small size of the hydroxyl group, allowing inter/intramolecular hydrogen bonding and leading to more efficient packing of the polymer chains[30,34]. The cross-linking reaction conducted in this work acts by eliminating free hydroxyl groups from the PVA chains, replacing them with acetal and hemiacetal bonds. This effect can be perceived when the xerogels’ diffractograms are analyzed. The change is much more pronounced in the highly cross-linked samples. The presence of SiO2 nanoparticles appears to have no effect on this change. At 10% nominal cross-linking, the intensity of the diffractions coming from the sample is so low that on the scale of the graph it cannot be easily distinguished from the baseline. It is clear that the ordered conformation of the PVA chains was undone by the cross-linking reaction, as this spatial order relies on the presence of hydroxyl groups. Thus, for these systems, WAXD measurements corroborated the results obtained through FT-IR, with respect to the strength of the cross-linking reaction.
3.4 TD-NMR analysis
All the acquisition parameters shown in Table 2 underwent various steps of iterative optimization to ensure better results and finer resolution. Once these parameters
are set, they can be repeated for each sample in a batch. When compared with the other characterization techniques, relaxometry offers some advantages. First, by observing only the spin-lattice relaxation processes we could extract up to three different and complementary readings about the samples. Second, TD-NMR probes the whole volume of the sample, providing more accurate and descriptive data about the material being analyzed. Third, if needed, the samples could have been used for other tests, since relaxometry is a nondestructive analytical tool[1,3,4,7].
3.4.1 Spin-lattice relaxation constant determination
The spin-lattice relaxation constant, T1, can be interpreted as an estimate of the intermolecular interactions existing in the sample, since this parameter provides information about long chain segments under the frequency used in this experiment. This time constant is very dependent on the correlation times of the proton nuclei in the PVA chains, so that nuclei constrained in rigid domains display long correlation times. This, in turn, translates into greater values of T1. The inverse holds for short T1 values, which arise from mobile, less restricted molecular environments[18,19,33].
Figure 3. FT-IR spectra expansion of (a) short-chain aliphatic aldehyde C-H region and (b) aldehyde carbonyls and of C-C or C-O bonds.
The T1 values for PVA and PVA/SiO2 were used as standards against which the values for xerogels were measured. Tables 3 and 4 show the T1 values for the samples. The data are grouped in filled and non-filled samples, for clarity. The magnetization relaxation back to thermal equilibrium via the T1 mechanism is modulated by the molecular mobility (more or less restrained polymer chains) of the sample. The value of T1 decreases with increasing temperature, suggesting a reduction of molecular rigidity of the PVA matrix, which is expected since the system receives thermal energy. This trend occurs despite the degree of cross-linking or the presence of inorganic nanoparticles. The presence of nanoparticles, however, seems to have a dampening effect on the reduction of the samples’ T1 values due to this stimulus, especially at high temperatures. Another trend is the decrease of the T1 values with increased cross-linking between PVA chains, although the intensity of the change in T1 values starts to diminish when the cross-linking degree reaches 5% (m/m), suggesting saturation around this concentration of GA. This behavior is similar to that described by Zhao et al.[18]. The main difference between our results and theirs is that we investigated a vinyl polymer and they examined an elastomer. As previously discussed, the cross-linking process occurs, for the systems studied here, by consumption of hydroxyl moieties present in the polymer. According to the experimental results, we attributed greater lattice rigidity to neat PVA due to the strong hydrogen bonding from hydroxyl moieties in its structure. The conversion of said moieties to (hemi)acetal groups linked by three CH2 bonds, which are somewhat mobile, thus increased the net molecular mobility of the polymer matrix. That being said, the presence acetal bridges diminishes spatial organization and molecular rigidity, as reflected in the T1 values. Furthermore, the nanoparticles’ influence could be perceived when looking at T1 values for a given neat polymer/hybrid pair. For all the formulations, the hybrid displayed a shorter T1 value than its unloaded equivalent, thus showing that T1 is sensitive to the very weak surface interactions between the polymer matrix and the SiO2 nanoparticles. This result is interesting because it allows faster and better interpretation of the extent of the changes brought by the addition of the nanoparticles than the other two common spectroscopic methods employed.
3.4.2 Spin diffusion path analysis
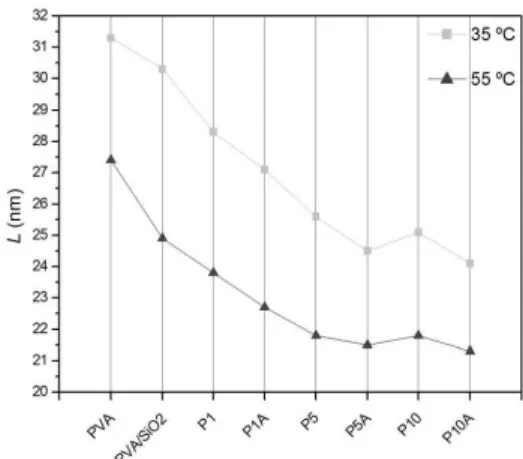
Regarding homogeneity at the molecular level, spin-lattice relaxation can be used to describe the extent of similar spin environments at nanometer scales. The parameter L is the theoretical distance where spin diffusion events can take place without causing the averaging of the magnetization. Thus, this value represents the upper limit of similar molecular mobility. In other words, L is an approximation of the size of homogeneous domains inside the material[5,25].
The values for L shown in Figure 5 demonstrate a downward trend with rising quantity of nanoparticles and cross-linking degree. The effect of temperature on this parameter is also demonstrated, with L values for the samples evaluated at 35 and 55 °C.
As the results show, the introduction of acetal bridges breaks the spatial organization between PVA chains, and although they are stochastic in nature, the effects of the cross-linking reaction demonstrate an almost linear decay with increasing GA concentration. Comparing PVA with PVA/SiO2, the introduction of SiO2 does little to disturb the homogeneity of PVA chains. Even the smallest amount of GA (P1) had a more pronounced effect on this parameter than that caused by the nanoparticles’ presence. Finally, the technique is sensitive to the effects of temperature on the homogeneity of the polymeric spin domains. With the increase of thermal energy, random movements of long
Table 3. T1 values for the non-filled samples at different temperatures.
Sample T1(ms) at 35 °C T1(ms) at 45 °C T1(ms) at 55 °C T1(ms) at 65 °C
PVA 326 286 251 188
P1 267 226 189 142
P5 219 188 159 121
P10 211 188 159 120
Table 4. T1 values for the filled samples at different temperatures.
Sample T1(ms) at 35 °C T1(ms) at 45 °C T1(ms) at 55 °C T1(ms) at 65 °C
PVA/SiO2 306 243 207 197
P1A 246 205 172 127
P5A 200 176 154 120
P10A 193 172 152 116
segments of polymer chains contribute to reduction of the spin diffusion path’s length[5,25,26].
3.4.3 Activation energy through spin-lattice relaxation
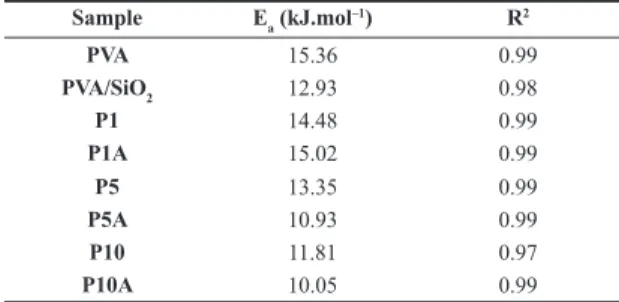
Values for Ea are related to the polymer matrix lateral groups’ rotation movement and to chain end or ramification vibrations [27,28,33]. We treated this quantity as apparent energy of activation. Table 5 lists the values for all samples.
Both cross-linking and the presence of nanoparticles caused a reduction in the value of the systems’ apparent activation energy, albeit through different mechanisms. As seen before, the SiO2 particles do not interact chemically with the polymeric matrix, but their presence is sufficient to reduce the size of the homogeneous spin domains. The reduction on the Ea value for PVA/SiO2 must have come from a disorganized, somewhat less restricted environment. The same rationale explains the effects of cross-linking, as the reaction consumes hydroxyl moieties, reported to be responsible for spatial ordering of PVA chains[30,31]. The results obtained for the apparent Ea values of non-filled samples indicate these values can be used to gauge the extent of cross-linking in this type of xerogel, as they vary linearly with GA concentration.
4. Conclusions
We prepared and analyzed SiO2 loaded and neat PVA based xerogels through FT-IR, WAXD and TD-NMR, by means of spin-lattice relaxation mechanisms. The results obtained from the FT-IR and the WAXD analyses demonstrated that the cross-linking reaction reduces the spatial ordering of the PVA polymer chains. There was no chemical interaction between the PVA hydroxyl groups and the SiO2 surface that could be detected via FT-IR, although TD-NMR results did show some level of physical interaction between polymer and nanoparticles. All three TD-NMR experiments performed in this study revealed the effect of the SiO2 presence amid the PVA chains. The data derived from the TD-NMR experiment, such as Ea and T1 constant values, can be readily employed to assess this kind of material’s degree of cross-linking without resorting to swelling-to-equilibrium solvent intake tests, with the added advantage of being faster. The experimental design employed in the work enables clearer and broader characterization of an important class of polymeric materials, the inorganic-organic hybrid xerogels.
5. Acknowledgements
We thank Roberto Pinto Cucinelli Neto for the fruitful discussions about relaxometry and his help during some of the analyses. We also thank Coordenação de Aperfeiçoamento de Pessoal de Ensino Superior (CAPES), Conselho Nacional de Desenvolvimento Científico e Tecnológico (CNPq) and Fundação Carlos Chagas Filho de Amparo a Pesquisa do Estado do Rio de Janeiro (FAPERJ) for funding.
6. References
1. Tavares, M. I. B., Monteiro, E. E. C., Harris, R. K., & Kenwright, A. M. (1994). NMR study of plasticized PVC.
European Polymer Journal, 30(9), 1089-1095. http://dx.doi. org/10.1016/0014-3057(94)90205-4.
2. Friebolin, H. (1993). Basic one- and two-dimensional NMR spectroscopy. Weinheim: VCH.
3. Bathista, A., & Tavares, M. I. B. (2010). Introdução à relaxação
magnética nuclear. São Paulo: Lulu Inc.
4. Silva, M. B. R., Tavares, M. I. B., Silva, E. O., & Cucinelli, R. P., No. (2013). Dynamic and structural evaluation of poly(3-hydroxybutyrate) layered nanocomposites. Polymer Testing, 32(1), 165-174. http://dx.doi.org/10.1016/j.polymertesting.2012.09.006. 5. Adriaensens, P., Dams, R., Lutsen, L., Vanderzande, D., &
Gelan, J. (2004). Study of the nanomorphology of OC1C10-PPV/precursor-PPV blends by solid state NMR relaxometry.
Polymer, 45(13), 4499-4505. http://dx.doi.org/10.1016/j. polymer.2004.04.010.
6. ten Brinke, J. W., Litvinov, V. M., Wijnhoven, J. E. G. J., & Noordermeer, J. W. M. (2002). Interactions of Stöber silica with natural rubber under the influence of coupling agents, studied by 1H NMR T
2 relaxation analysis. Macromolecules, 35(27), 10026-10037. http://dx.doi.org/10.1021/ma020555+. 7. Rodrigues, E. J. R., Nascimento, S. A. M., Tavares, M. I.
B., & Merat, P. P. (2012). Investigação da influência do processamento na dinâmica molecular de nanocompósitos de policarbonato e argila organofílica obtidos via intercalação por fusão. Polímeros: Ciência e Tecnologia, 22(5), 436-439. http://dx.doi.org/10.1590/S0104-1428012005000058. 8. Uehara, H., Aoike, T., Yamanobe, T., & Komoto, T. (2002).
Solid-state 1H NMR relaxation analysis of ultrahigh molecular
weight polyethylene reactor powder. Macromolecules, 35(7), 2640-2647. http://dx.doi.org/10.1021/ma010464x.
9. Barbosa, L. L., Kock, F. V. C., Silva, R. C., Freitas, J. C. C., Lacerda, V., Jr, & Castro, E. V. R. (2013). Application of low-field NMR for the determination of physical properties of petroleum fractions. Energy & Fuels, 27(2), 673-679. http:// dx.doi.org/10.1021/ef301588r.
10. Andrade, F. D., Marchi, A., No., & Colnago, L. A. (2011). Qualitative analysis by online nuclear magnetic resonance using Carr-Purcell-Meiboom-Gill sequence with low refocusing flip angles. Talanta, 84(1), 84-88. http://dx.doi.org/10.1016/j. talanta.2010.12.033. PMid:21315902.
11. Cabeça, L. F., Marconcini, L. V., Mambrini, G. P., Azeredo, R. B. V., & Colnago, L. A. (2011). Monitoring the transesterification reaction used in biodiesel production, with a low cost unilateral nuclear magnetic resonance sensor. Energy & Fuels, 25(6), 2696-2701. http://dx.doi.org/10.1021/ef200294j.
12. Litvinov, V. M., Orza, R. A., Klüppel, M., van Duin, M., & Magusin, P. C. M. M. (2011). Rubber-filler interactions and network structure in relation to stress-strain behavior of vulcanized, carbon black filled EPDM. Macromolecules,
44(12), 4887-4900. http://dx.doi.org/10.1021/ma2007255.
Table 5. Ea values calculated for all the samples. Sample Ea (kJ.mol–1) R2
PVA 15.36 0.99
PVA/SiO2 12.93 0.98
P1 14.48 0.99
P1A 15.02 0.99
P5 13.35 0.99
P5A 10.93 0.99
P10 11.81 0.97
13. Ajji, Z. (2005). Preparation of poly(vinyl alcohol) hydrogels containing citric or succinic acid using gamma radiation.
Radiation Physics and Chemistry, 74(1), 36-41. http://dx.doi. org/10.1016/j.radphyschem.2004.12.005.
14. Sánchez, L. G. J. G., & Ortega, J. A. C. (2014). Síntesis de hidrogeles de acrilamida en soluciones acuosas de etanol.
Polímeros. Ciência e Tecnologia, 24(6), 752-756. http://dx.doi. org/10.1590/0104-1428.1663.
15. Barbucci, R., Leone, G., Chiumiento, A., Di Cocoo, M. E., D’Orazio, G., Gianferri, R., & Delfini, M. (2006). Low-and high-resolution nuclear magnetic resonance (NMR) characterisation of hyaluronan-based native and sulfated hydrogels. Carbohydrate Research, 341(11), 1848-1858. http:// dx.doi.org/10.1016/j.carres.2006.04.046. PMid:16716277. 16. Kim, M. J., Park, Y. H., Youm, K. H., & Lee, K.-H. (2004). Gas
permeation through water-swollen polysaccharide – poly(vinyl alcohol) membranes. Journal of Applied Polymer Science,
91(5), 3225-3232. http://dx.doi.org/10.1002/app.13520. 17. Haque, M. A., Kurokawa, T., & Gong, J. P. (2012). Super tough
double network hydrogels and their application as biomaterials.
Polymer, 53(9), 1805-1822. http://dx.doi.org/10.1016/j. polymer.2012.03.013.
18. Zhao, F., Zhao, S., Welna, B., Kuhn, W., & Jlan, Y. (2007). Characterization of elastomer networks by NMR parameters part I. Kautschuk und Gummi, Kunststoffe, 10, 554-558. Retrieved in 06 March 2015, from http://www.kgk-rubberpoint. de/forschung/characterization-of-elastomer-networks-by-nmr-parameters-part-i/
19. Austin, D. T. R., & Hills, B. P. (2009). Two-dimensional NMR relaxation study of the pore structure in silicone hydrogel contact lenses. Applied Magnetic Resonance, 35(4), 581-591. http://dx.doi.org/10.1007/s00723-009-0187-z.
20. Saalwätcher, K. (2005). Artifacts in transverse proton NMR relaxation studies in elastomers. Macromolecules, 38(4), 1508-1512. http://dx.doi.org/10.1021/ma0478005.
21. Litvinov, V. M., & De, P. P. (2002). Spectroscopy of rubbers
and rubbery materials. Shawbury: Rapra Technology Ltd. 22. Coviello, T., Matricardi, P., Alhaique, F., Farra, R., Tesei, G.,
Fiorentino, S., Asaro, F., Milcovich, G., & Grassi, M. (2013). Guar gum/borax hydrogel: rheological, low field NMR and release characterizations. Express Polymer Letters, 7(9), 733-746. http://dx.doi.org/10.3144/expresspolymlett.2013.71. 23. Dash, S., Murthy, P. N., Nath, L., & Chowdhurt, P. (2010).
Kinetic modeling on drug release from controlled drug delivery systems. Acta Poloniae Pharmaceutica: Drug Research, 67(3), 217-223. Retrieved in 06 March 2015, from http://ptfarm.pl/ pub/File/Acta_Poloniae/2010/3/217.pdf
24. Ruiz, J., Mantecón, A., & Cádiz, V. (2001). Synthesis and properties of hydrogels from poly (vinyl alcohol) and ethylenediaminetetraacetic dianhydride. Polymer, 42(12), 6347-6354. http://dx.doi.org/10.1016/S0032-3861(01)00082-9.
25. Wang, J., Cheung, M. K., & Mi, Y. (2001). Miscibility in blends of poly(4-vinylpyridine)/poly(4-vinylphenol) as studied by 13C
solid-state NMR. Polymer, 42(7), 3087-3093. http://dx.doi. org/10.1016/S0032-3861(00)00643-1.
26. Joseph, S., Lauprêtre, F., Negrell, C., & Thomas, S. (2005). Compatibilising action of random and triblock copolymers of poly(styrene-butadiene) in polystyrene/polybutadiene blends: a study by electron microscopy, solid state NMR spectroscopy and mechanical measurements. Polymer, 46(22), 9385-9395. http://dx.doi.org/10.1016/j.polymer.2005.07.053.
27. Taylor, R. E., Bacher, A. D., & Dybowski, C. (2007). 1H NMR
relaxation in urea. Journal of Molecular Structure, 846(1-3), 147-152. http://dx.doi.org/10.1016/j.molstruc.2007.01.043. 28. Wang, Y. L., Belton, P. S., & Tang, H. R. (1997). Proton NMR
relaxation studies of solid L-alaninamide. Chemical Physics
Letters, 268(5-6), 387-392. http://dx.doi.org/10.1016/S0009-2614(97)00204-2.
29. Burczak, K., Fujisato, T., Hatada, M., & Ikada, Y. (1994). Protein permeation through poly(vinyl alcohol) hydrogel membranes. Biomaterials, 15(3), 231-238. http://dx.doi. org/10.1016/0142-9612(94)90072-8. PMid:8199296. 30. Mansur, H. S., Oréfice, R. L., & Mansur, A. A. P. (2004).
Characterization of poly(vinyl alcohol)/poly(ethylene glycol) hydrogels and PVA-derived hybrids by small angle X-ray scattering and FTIR spectroscopy. Polymer, 45(21), 7193-7202. http://dx.doi.org/10.1016/j.polymer.2004.08.036. 31. Mansur, H. S., Sadahira, C. M., Souza, A. N., & Mansur, A.
A. P. (2008). FTIR spectroscopy characterization of poly (vinyl alcohol) hydrogel with different hydrolysis degree and chemically crosslinked with glutaraldehyde. Materials Science
and Engineering C, 28(4), 539-548. http://dx.doi.org/10.1016/j. msec.2007.10.088.
32. Andrade, G. I., Barbosa-Stancioli, E. F., Mansur, A. A. P., Vasconcelos, W. L., & Mansur, H. S. (2008). Small-angle X-ray scattering and FTIR characterization of nanostructured poly(vinyl alcohol)/silicate hybrids for immunoassay applications.
Journal of Materials Science, 43(2), 450-463. http://dx.doi. org/10.1007/s10853-007-1953-7.
33. Mello, N. C., Bonagamba, T. J., Panepucci, H., Dahmouche, K., Judeinstein, P., & Aegerter, M. A. (2000). NMR study of ion-conducting organic-inorganic nanocomposites poly(ethylene glycol)-silica-LiClO4. Macromolecules, 33(4), 1280-1288. http://dx.doi.org/10.1021/ma991624w.
34. Paranhos, C. M., Soares, B. G., Oliveira, R. N., & Pessan, L. A. (2007). Poly(vinyl alcohol)/clay-based nanocomposite hydrogels: swelling behavior and characterization. Macromolecular
Materials and Engineering, 292(5), 620-626. http://dx.doi. org/10.1002/mame.200700004.